

Nationals vs Dodgers Live Score (6 Sep, 2026)
Game Information
Stage
STD
Season
2026
First Pitch
Sat, Sep 5, 9:10 pm
Venue
Dodger Stadium
Location
Los Angeles, California
Venue Type
Outdoor
Broadcast
MLB.TV
Attendance
52,785
Live Situation
2Balls
3Strikes
0Outs
—Pitcher
—At Bat
Pitch Sequence
1
BALL
Four-seam FB
98 MPH
2
STRIKE SWINGING
Four-seam FB
97 MPH
3
STRIKE SWINGING
Four-seam FB
98 MPH
4
BALL
Four-seam FB
97 MPH
5
STRIKE SWINGING
Four-seam FB
98 MPH
Injury Report
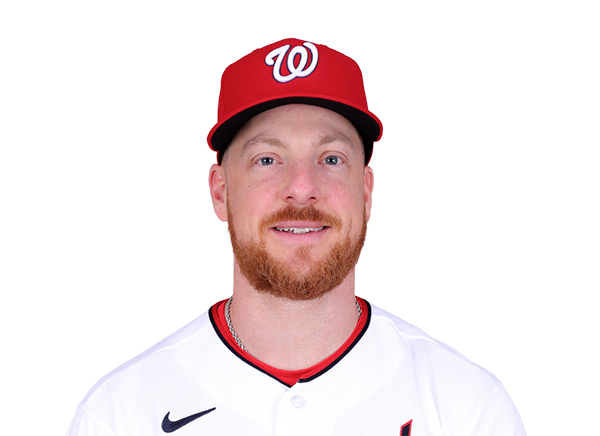
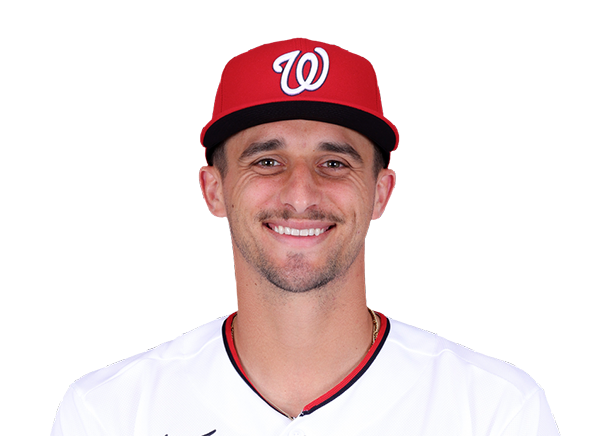
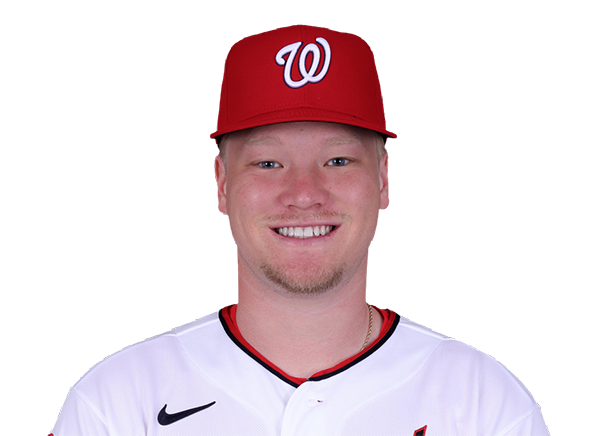
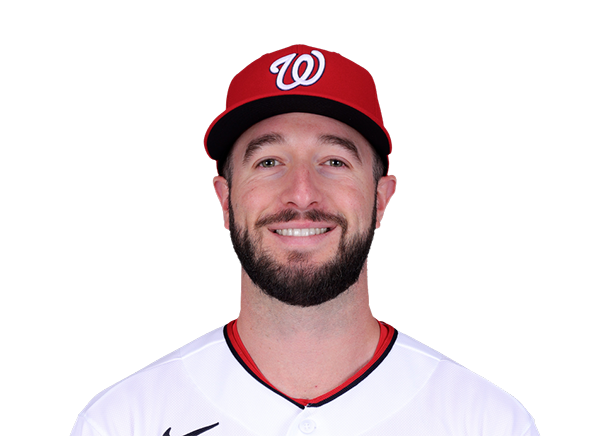
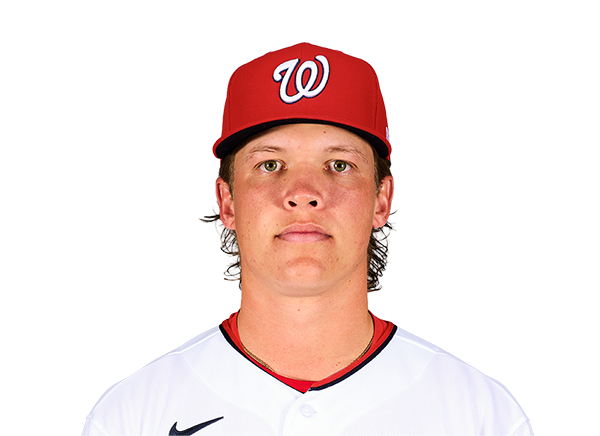
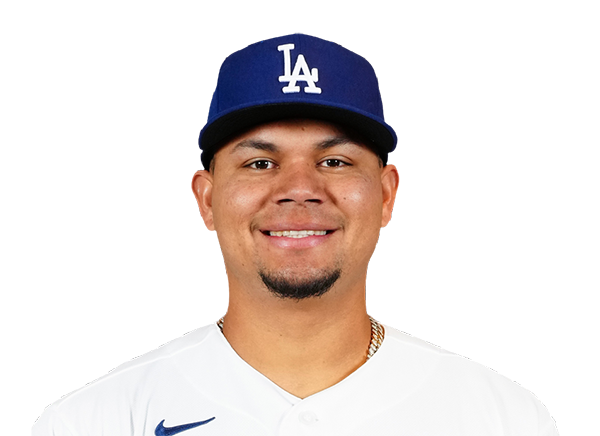
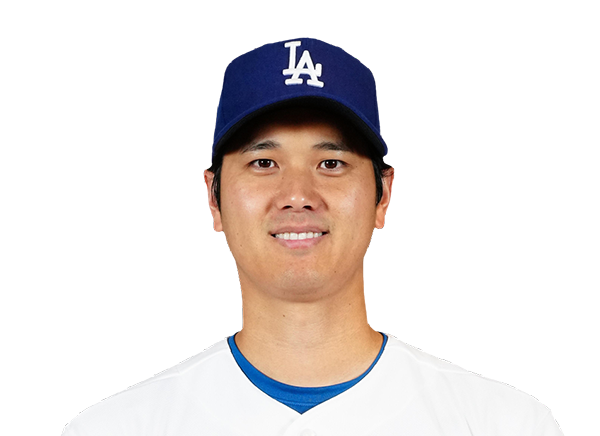

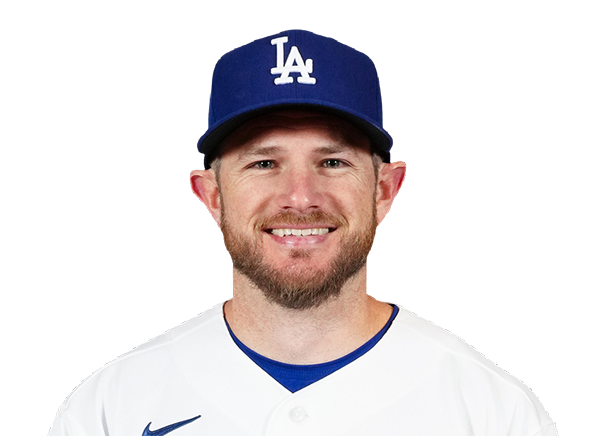
Team Stats
 WSH
LAD


5
Runs
6
10
Hits
7
0
Errors
0
0
Home Runs
1
3
Walks
3
13
Strikeouts
11
Player Box Score
Washington Nationals
| Player | H-AB | AB | R | H | RBI | HR | BB | K | #P | AVG | OBP | SLG |
|---|---|---|---|---|---|---|---|---|---|---|---|---|
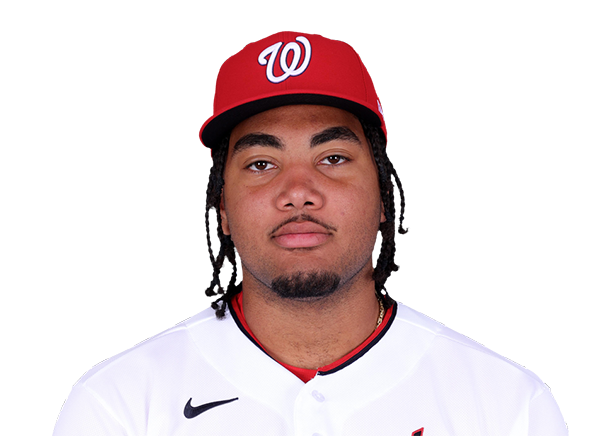 James Wood | 1-4 | 4 | 1 | 1 | 0 | 0 | 1 | 1 | 20 | .267 | .392 | .533 |
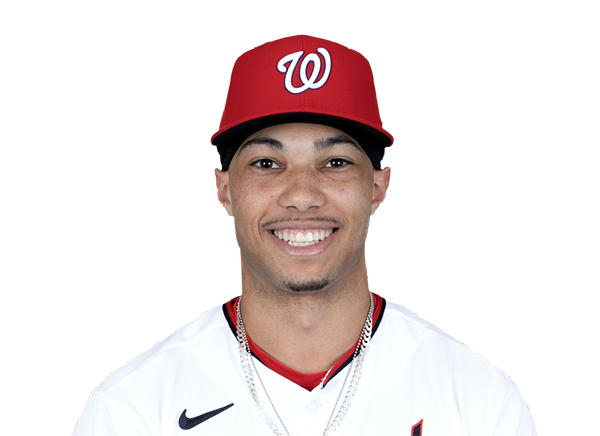 Daylen Lile | 2-5 | 5 | 0 | 2 | 2 | 0 | 0 | 0 | 18 | .254 | .308 | .438 |
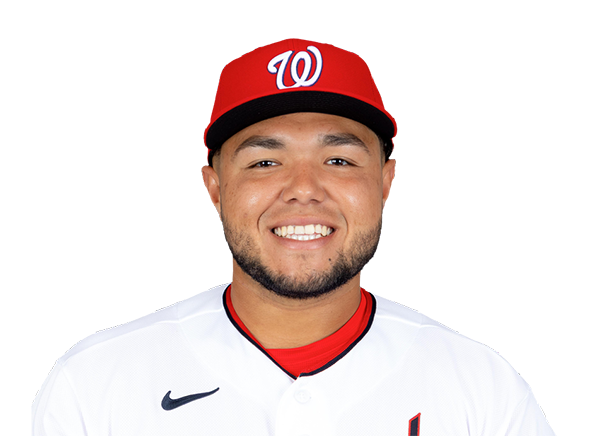 Abimelec Ortiz | 0-3 | 3 | 0 | 0 | 0 | 0 | 0 | 2 | 11 | .202 | .240 | .384 |
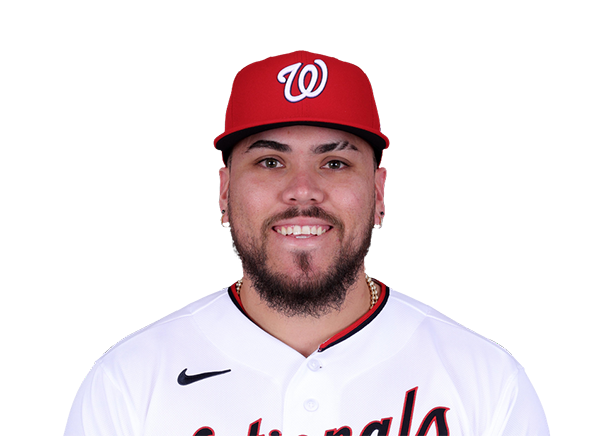 Andres Chaparro | 1-2 | 2 | 0 | 1 | 0 | 0 | 0 | 1 | 5 | .255 | .361 | .503 |
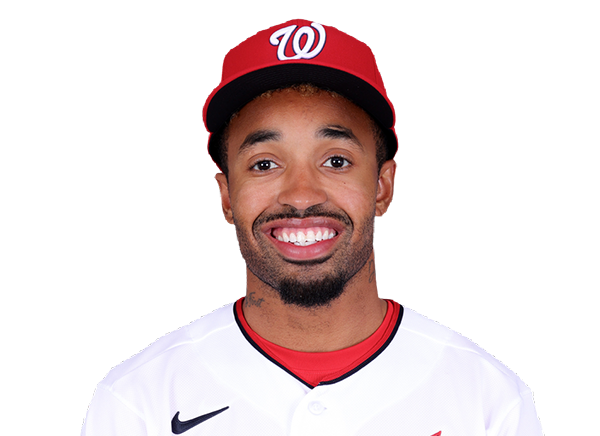 Nasim Nunez | 0-0 | 0 | 0 | 0 | 0 | 0 | 0 | 0 | 0 | .213 | .292 | .248 |
 CJ Abrams | 1-4 | 4 | 1 | 1 | 0 | 0 | 1 | 3 | 24 | .265 | .341 | .496 |
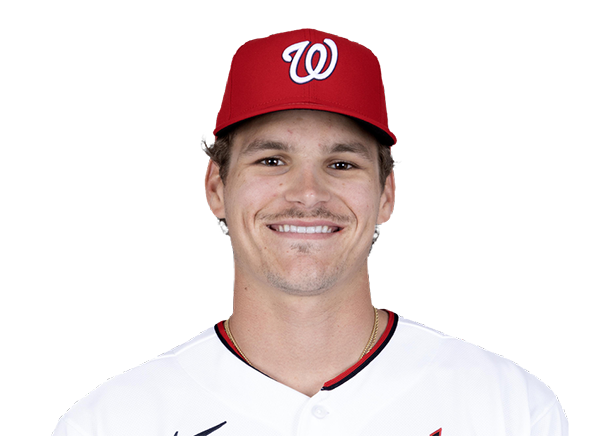 Brady House | 1-4 | 4 | 1 | 1 | 0 | 0 | 0 | 0 | 9 | .246 | .307 | .408 |
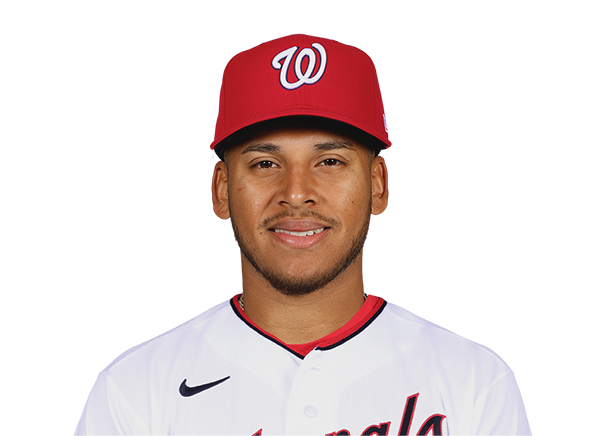 Jorbit Vivas | 0-3 | 3 | 0 | 0 | 0 | 0 | 1 | 0 | 16 | .237 | .333 | .322 |
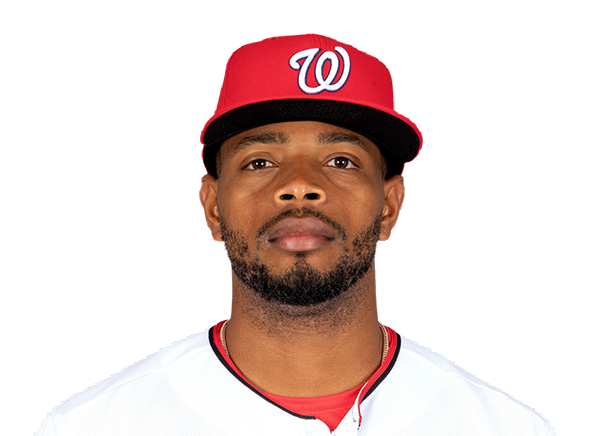 Jose Tena | 0-3 | 3 | 0 | 0 | 1 | 0 | 0 | 2 | 15 | .228 | .308 | .378 |
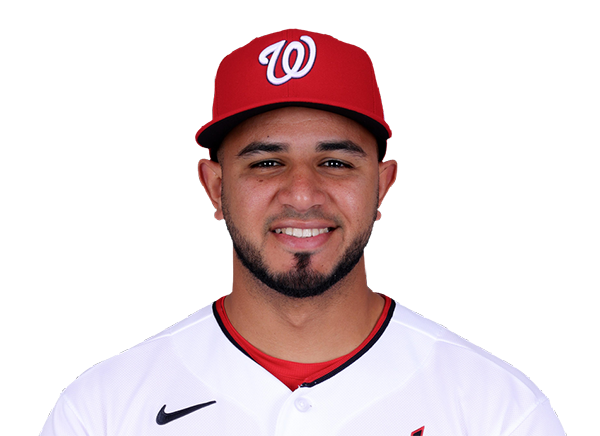 Keibert Ruiz | 2-3 | 3 | 1 | 2 | 1 | 0 | 0 | 1 | 6 | .286 | .324 | .455 |
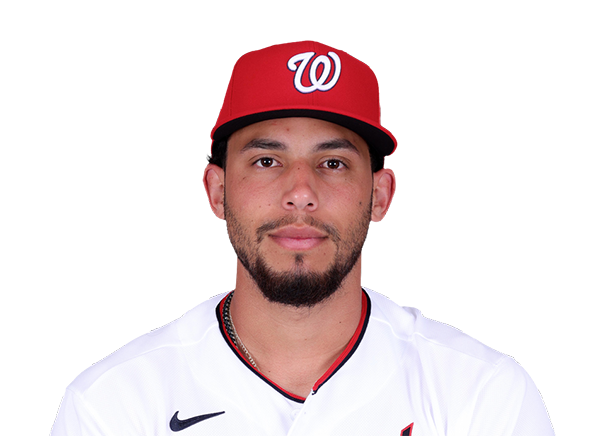 Yohandy Morales | 0-1 | 1 | 0 | 0 | 0 | 0 | 0 | 1 | 3 | .455 | .455 | .909 |
 Dylan Crews | 2-4 | 4 | 1 | 2 | 1 | 0 | 0 | 2 | 10 | .220 | .289 | .365 |
Los Angeles Dodgers
| Player | H-AB | AB | R | H | RBI | HR | BB | K | #P | AVG | OBP | SLG |
|---|---|---|---|---|---|---|---|---|---|---|---|---|
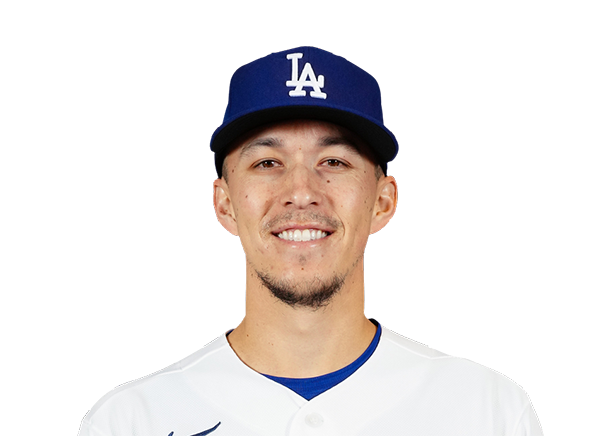 Tommy Edman | 1-4 | 4 | 1 | 1 | 3 | 1 | 0 | 2 | 16 | .273 | .348 | .414 |
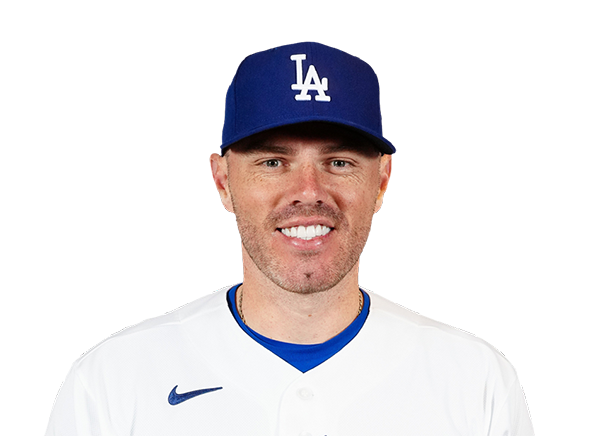 Freddie Freeman | 0-3 | 3 | 1 | 0 | 0 | 0 | 0 | 2 | 18 | .302 | .379 | .461 |
 Mookie Betts | 2-4 | 4 | 1 | 2 | 0 | 0 | 0 | 1 | 16 | .247 | .309 | .418 |
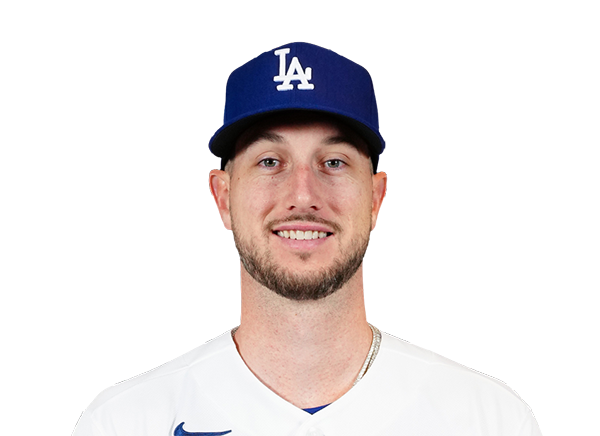 Kyle Tucker | 0-3 | 3 | 1 | 0 | 0 | 0 | 1 | 0 | 19 | .225 | .326 | .357 |
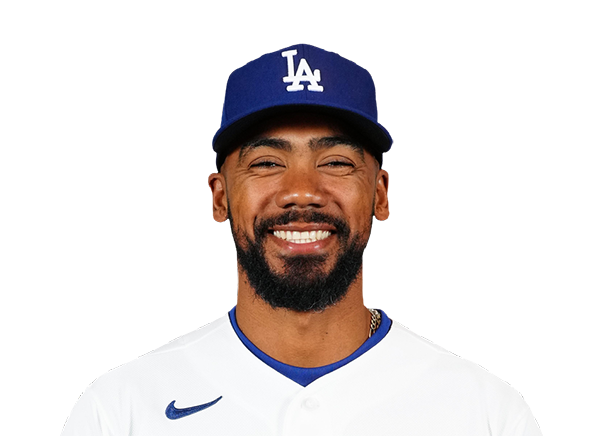 Teoscar Hernandez | 1-4 | 4 | 0 | 1 | 1 | 0 | 0 | 1 | 18 | .257 | .321 | .404 |
 Hunter Feduccia | 1-3 | 3 | 0 | 1 | 1 | 0 | 0 | 1 | 15 | .241 | .315 | .346 |
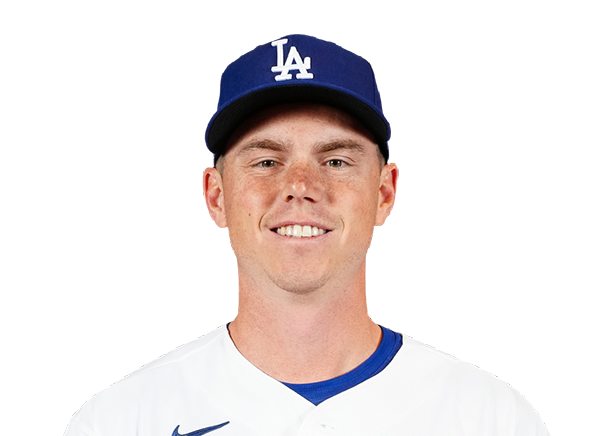 Will Smith | 0-1 | 1 | 0 | 0 | 0 | 0 | 0 | 1 | 6 | .235 | .324 | .364 |
 Alex Freeland | 1-2 | 2 | 1 | 1 | 0 | 0 | 2 | 0 | 20 | .225 | .310 | .304 |
 Alex Call | 0-3 | 3 | 0 | 0 | 1 | 0 | 0 | 1 | 16 | .248 | .358 | .324 |
 Enrique Hernandez | 1-4 | 4 | 1 | 1 | 0 | 0 | 0 | 2 | 25 | .218 | .271 | .364 |
Washington Nationals
| Player | IP | H | R | ER | BB | K | HR | PC-ST | ERA | PC |
|---|---|---|---|---|---|---|---|---|---|---|
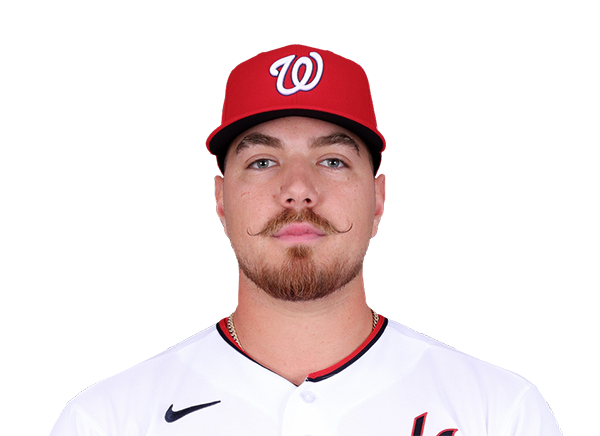 Cade Cavalli | 6.0 | 4 | 2 | 2 | 0 | 8 | 0 | 103-66 | 3.12 | 103 |
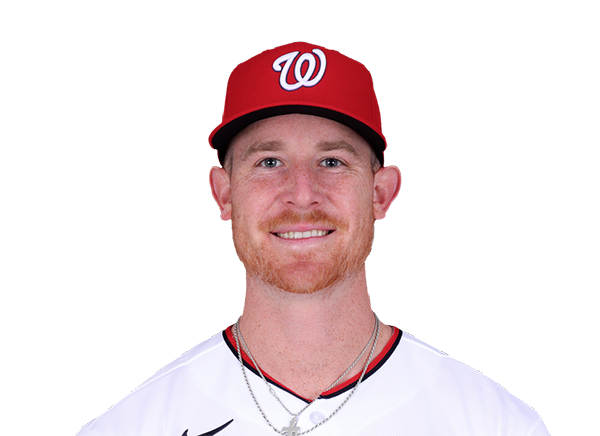 Clayton Beeter | 0.2 | 2 | 3 | 3 | 1 | 0 | 1 | 23-12 | 4.50 | 23 |
 Erik Tolman | 0.2 | 1 | 1 | 1 | 1 | 1 | 0 | 19-11 | 1.23 | 19 |
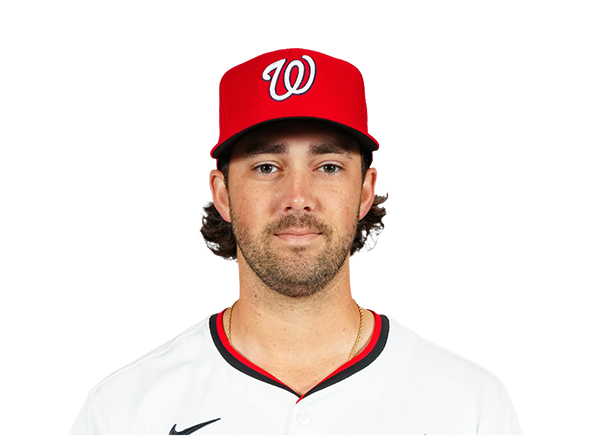 Jack Sinclair | 0.2 | 0 | 0 | 0 | 1 | 2 | 0 | 24-13 | 0.00 | 24 |
Los Angeles Dodgers
| Player | IP | H | R | ER | BB | K | HR | PC-ST | ERA | PC |
|---|---|---|---|---|---|---|---|---|---|---|
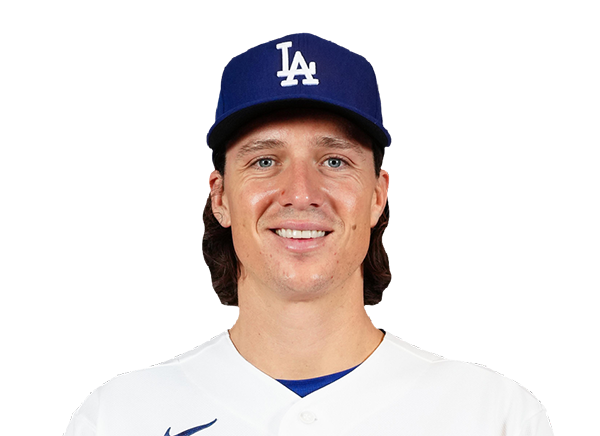 Tyler Glasnow | 6.0 | 6 | 4 | 4 | 3 | 8 | 0 | 96-56 | 3.12 | 96 |
 Alex Vesia | 1.0 | 1 | 0 | 0 | 0 | 2 | 0 | 15-11 | 3.00 | 15 |
 Evan Phillips | 1.0 | 0 | 0 | 0 | 0 | 0 | 0 | 9-5 | 3.66 | 9 |
 Tanner Scott | 1.0 | 3 | 1 | 1 | 0 | 3 | 0 | 17-14 | 2.67 | 17 |
H2H / Season Series
LAD6–5
WSH
LAD5–3
WSH
WSH6–8
LAD
WSH5–10
LAD
WSH6–13
LAD
Last 5 Games
| Date | Opponent | Result |
|---|---|---|
| Sep 5 | @ LAD | L5–6 |
| Sep 4 | @ LAD | L3–5 |
| Sep 2 |  vs ATL | L0–9 |
| Sep 1 | vs ATL | W9–5 |
| Aug 31 |  vs MIA | W6–3 |
| Date | Opponent | Result |
|---|---|---|
| Sep 5 | vs WSH | W6–5 |
| Sep 4 | vs WSH | W5–3 |
| Sep 3 |  vs STL | W3–2 |
| Sep 2 | vs STL | L6–8 |
| Sep 1 | vs STL | L8–13 |
Standings
American League
| Team | W | L | PCT | GB | DIFF | STRK |
|---|---|---|---|---|---|---|
1 Rays | 84 | 57 | .596 | - | +46 | W1 |
2 White Sox | 74 | 67 | .525 | 10 | +42 | W1 |
3 Astros | 73 | 69 | .514 | 11.5 | -36 | W3 |
4 Yankees | 80 | 61 | .567 | 4 | +114 | L1 |
5 Red Sox | 77 | 65 | .542 | 7.5 | +79 | W2 |
6 Guardians | 72 | 70 | .507 | 12.5 | -9 | W2 |
7 Blue Jays | 71 | 71 | .500 | 13.5 | -34 | W3 |
8 Rangers | 70 | 72 | .493 | 14.5 | -43 | L1 |
9 Orioles | 69 | 73 | .486 | 15.5 | -22 | L4 |
10 Twins | 67 | 74 | .475 | 17 | -41 | L2 |
11 Mariners | 66 | 76 | .465 | 18.5 | -69 | L2 |
12 Tigers | 64 | 77 | .454 | 20 | +45 | L2 |
13 Royals | 63 | 79 | .444 | 21.5 | -92 | L1 |
14 Athletics | 56 | 86 | .394 | 28.5 | -190 | W3 |
15 Angels | 53 | 88 | .376 | 31 | -81 | L3 |
National League
| Team | W | L | PCT | GB | DIFF | STRK |
|---|---|---|---|---|---|---|
1 Brewers | 88 | 54 | .620 | - | +174 | W1 |
| 2Braves | 84 | 57 | .596 | 3.5 | +121 | W2 |
| 3Dodgers | 84 | 57 | .596 | 3.5 | +149 | W2 |
4 Cubs | 80 | 62 | .563 | 8 | +138 | W2 |
5 Phillies | 79 | 62 | .560 | 8.5 | +33 | L2 |
6 Padres | 74 | 67 | .525 | 13.5 | +11 | W1 |
7 Diamondbacks | 74 | 68 | .521 | 14 | -3 | L1 |
| 8Marlins | 71 | 71 | .500 | 17 | +9 | L2 |
| 9Cardinals | 71 | 71 | .500 | 17 | -8 | W1 |
10 Pirates | 70 | 72 | .493 | 18 | +30 | W2 |
11 Reds | 67 | 74 | .475 | 20.5 | -111 | L1 |
| 12Nationals | 67 | 76 | .469 | 21.5 | +12 | L2 |
13 Mets | 64 | 77 | .454 | 23.5 | -46 | W2 |
14 Giants | 58 | 84 | .408 | 30 | -77 | L2 |
15 Rockies | 54 | 87 | .383 | 33.5 | -141 | L1 |
WSH
VS
LAD
Pitchers
Cade Cavalli
Catchers
Keibert Ruiz
Infielders
Abimelec Ortiz
CJ Abrams
Brady House
Jorbit Vivas
Outfielders
James Wood
Daylen Lile
Dylan Crews
Designated Hitters
Jose Tena
Pitchers
Tyler Glasnow
Catchers
Hunter Feduccia
Infielders
Freddie Freeman
Mookie Betts
Alex Freeland
Enrique Hernandez
Outfielders
Tommy Edman
Kyle Tucker
Alex Call
Designated Hitters
Teoscar Hernandez
Nationals
VS
Dodgers
Batting
144
Team Games Played
142
4915
At Bats
4784
1222
Hits
1227
704
Runs Batted In
658
193
Home Runs
173
156
Stolen Bases
59
.249
Batting Average
.256
743
Runs
698
251
Doubles
232
28
Triples
15
2108
Total Bases
2008
503
Walks
536
1202
Strikeouts
1120
.325
On Base Percentage
.336
.429
Slugging Percentage
.420
.753
OBP Pct + SLG Pct
.755
144
Games Played
142
144
Games Started
142
65
Hit By Pitch
57
0.0
Wins Above Replacement
0.0
0.0
Offensive Wins Above Replacement
0.0
35
Caught Stealing
18
1
Is Qualified
1
709.6
Runs Created
681.3
5.0
Runs Created Per 27 Outs
4.9
.091
Walks Per Plate Appearance
.099
0.42
Walk To Strikeout Ratio
0.48
.180
Isolated Power
.163
.307
Secondary Average
.284
3.82
Pitches Per Plate Appearance
3.93
472
Extra Base Hits
420
5537
Plate Appearances
5438
25.5
At Bats Per Home Run
27.7
18
Sacrifice Hit
14
33
Sacrifice Flies
44
Pitching
144
Team Games Played
142
33
Quality Starts
74
67
Wins
85
77
Losses
57
34
Saves
40
71
Holds
89
1249
Hits
1030
668
Earned runs
517
196
Home Runs
158
524
Walks
436
1125
Strikeouts
1302
7.9
Strikeouts Per 9 Innings
9.3
150.8
Pitches Per Start
143.8
1.39
Walks Plus Hits Per Inning Pitched
1.17
4.70
Earned Run Average
3.70
77
Losses
57
1278.0
Innings pitched
1257.2
.465
Win Percentage
.599
70
Save Opportunities
60
.255
Opponent Batting Average
.220
.333
Opponent's On-base pct.
.293
.425
Opponent's Slugging pct.
.372
.758
Opponent's OPB Pct + SLG Pct
.666
4903
At Bats
4678
225
Doubles
214
11
Triples
12
75
Batters Hit
60
107
Stolen Bases
92
144
Games Played
142
0
Complete Games
1
5
Shutouts
11
52
Wild Pitches
34
703
Runs Batted In
521
1
Balks
4
1278.0
Innings pitched
1257.2
7.9
Strikeouts Per 9 Innings
9.3
31
Caught Stealing
23
144
Games Started
142
0.0
Wins Above Replacement
0.0
1
Is Qualified
1
732
Runs
548
668
Earned Runs
517
2084
Total Bases
1742
Fielding
144
Team Games Played
142
1278
Full Innings
1258
5236
Total Chances
4965
3834
Putouts
3773
1307
Assists
1137
95
Errors
55
251
Double Plays
232
0.982
Fielding Percentage
0.989
36.2
Range Factor
35.1
0.0
Zone Rating
0.0
144
Games Played
142
0
Games Started
0
0.0
Defensive Wins Above Replacement
0.0
1
Qualified
1