

Nationals vs Dodgers Live Score (7 Sep, 2026)
Game Information
Stage
STD
Season
2026
First Pitch
Sun, Sep 6, 10:10 pm
Venue
Dodger Stadium
Location
Los Angeles, California
Venue Type
Outdoor
Broadcast
MLB.TV
Attendance
54,211
Live Situation
0Balls
3Strikes
0Outs
—Pitcher
—At Bat
Pitch Sequence
1
STRIKE SWINGING
Four-seam FB
101 MPH
2
STRIKE LOOKING
Four-seam FB
100 MPH
3
STRIKE SWINGING
Four-seam FB
101 MPH
Injury Report
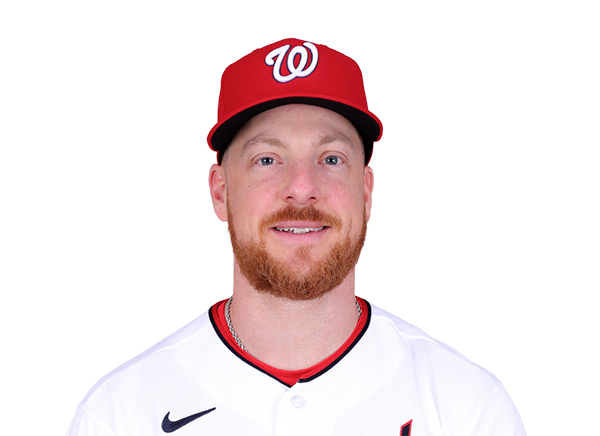
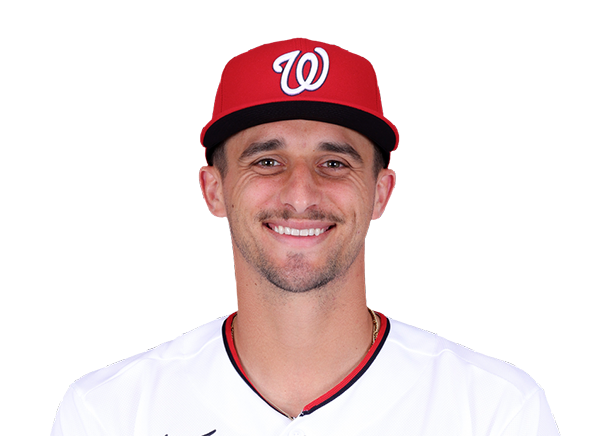
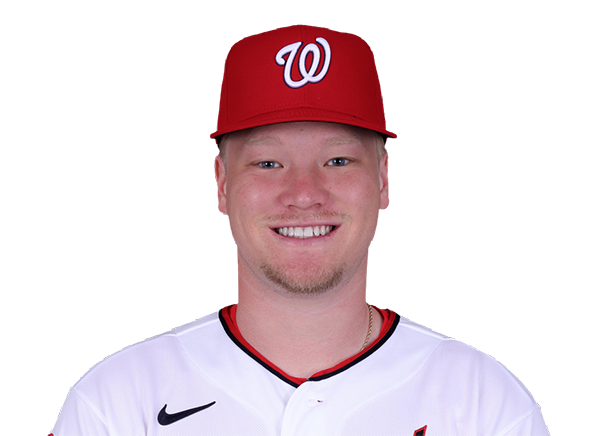
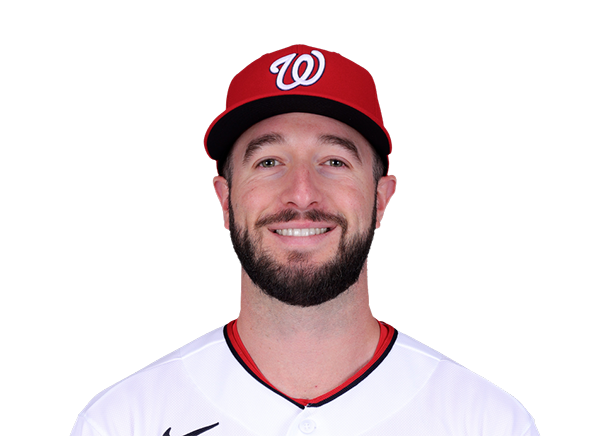
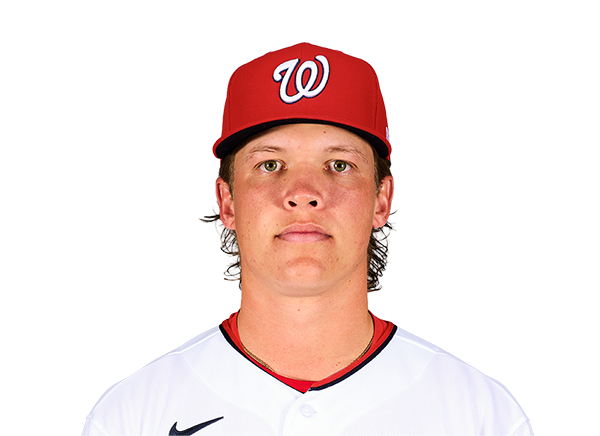
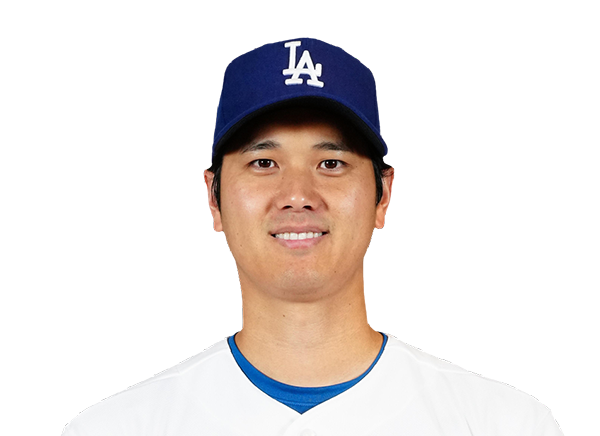
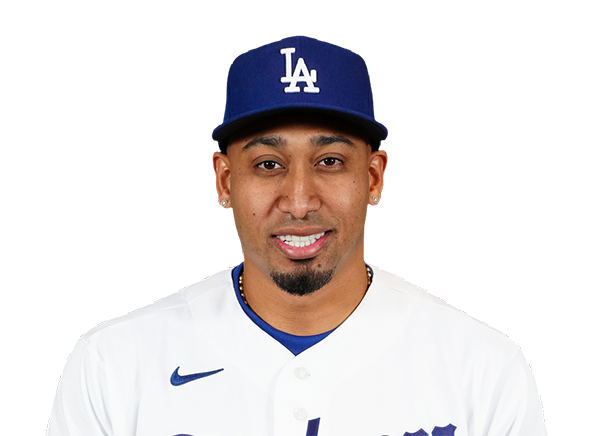
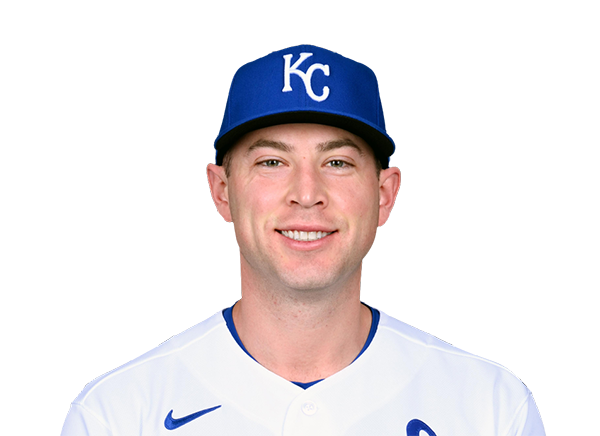
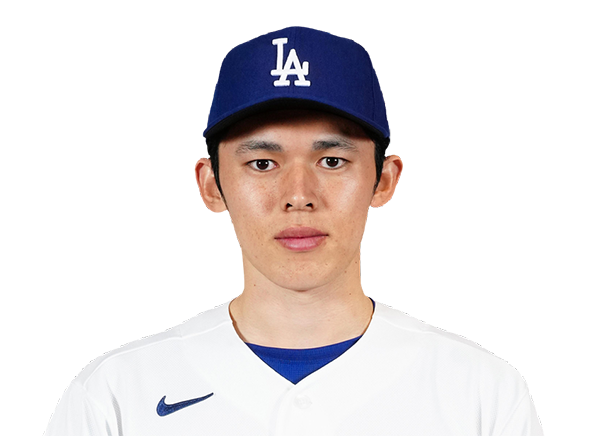

Team Stats
 WSH
LAD


5
Runs
7
9
Hits
10
0
Errors
1
1
Home Runs
1
6
Walks
5
11
Strikeouts
8
Player Box Score
Washington Nationals
| Player | H-AB | AB | R | H | RBI | HR | BB | K | #P | AVG | OBP | SLG |
|---|---|---|---|---|---|---|---|---|---|---|---|---|
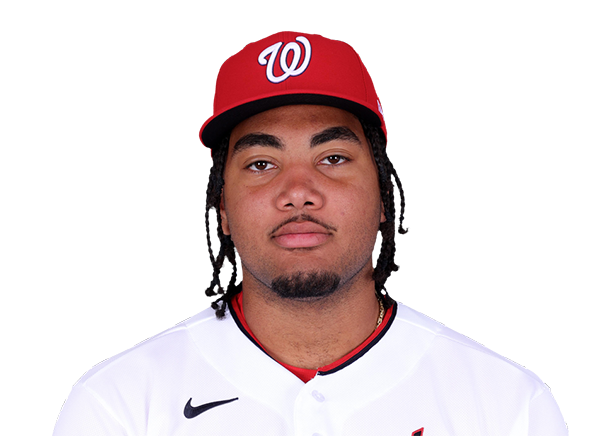 James Wood | 1-2 | 2 | 0 | 1 | 0 | 0 | 3 | 0 | 21 | .268 | .395 | .533 |
 Dylan Crews | 0-4 | 4 | 0 | 0 | 1 | 0 | 0 | 2 | 20 | .217 | .288 | .361 |
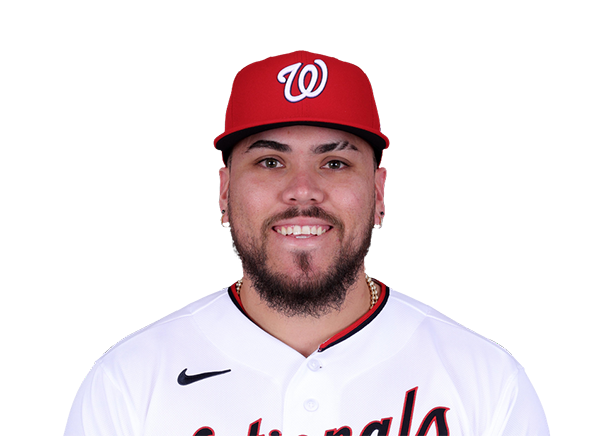 Andres Chaparro | 1-4 | 4 | 0 | 1 | 0 | 0 | 0 | 2 | 13 | .255 | .358 | .497 |
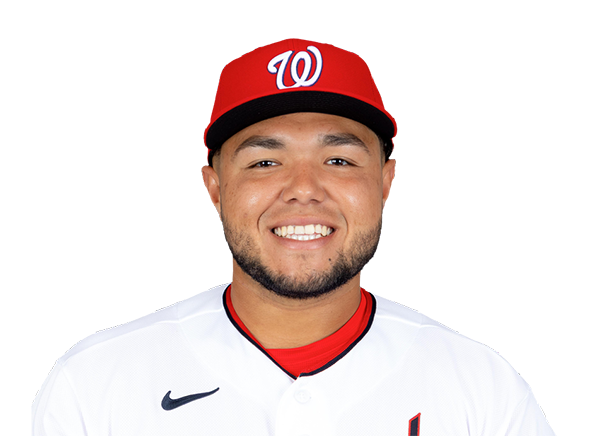 Abimelec Ortiz | 0-1 | 1 | 0 | 0 | 0 | 0 | 0 | 0 | 4 | .200 | .238 | .380 |
 CJ Abrams | 1-4 | 4 | 1 | 1 | 1 | 1 | 1 | 2 | 23 | .264 | .342 | .500 |
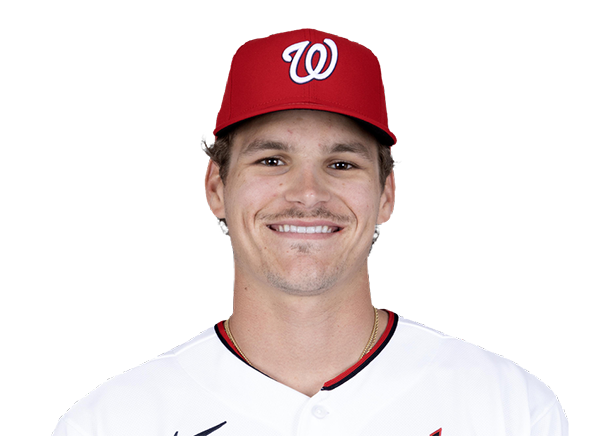 Brady House | 1-4 | 4 | 1 | 1 | 0 | 0 | 0 | 1 | 14 | .246 | .306 | .406 |
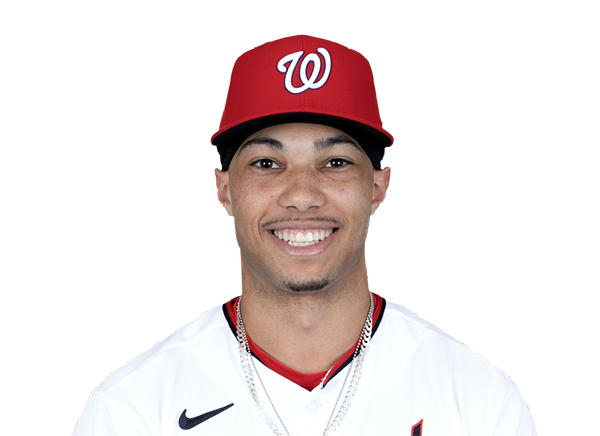 Daylen Lile | 2-4 | 4 | 1 | 2 | 0 | 0 | 0 | 2 | 22 | .256 | .309 | .442 |
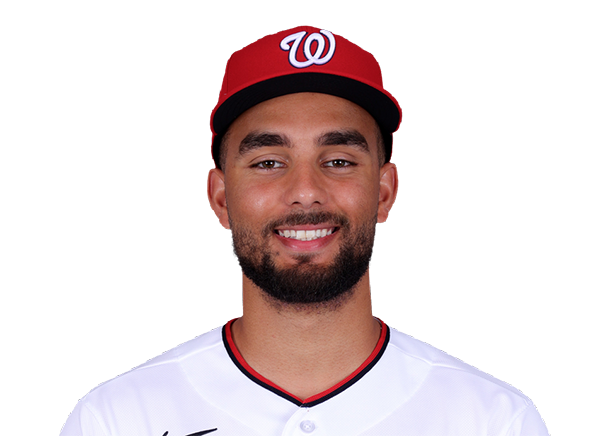 Harry Ford | 1-2 | 2 | 2 | 1 | 2 | 0 | 2 | 0 | 20 | .200 | .319 | .388 |
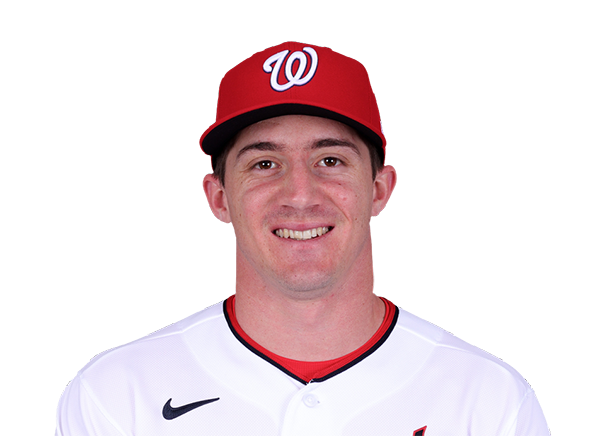 Jacob Young | 2-4 | 4 | 0 | 2 | 1 | 0 | 0 | 0 | 19 | .251 | .321 | .395 |
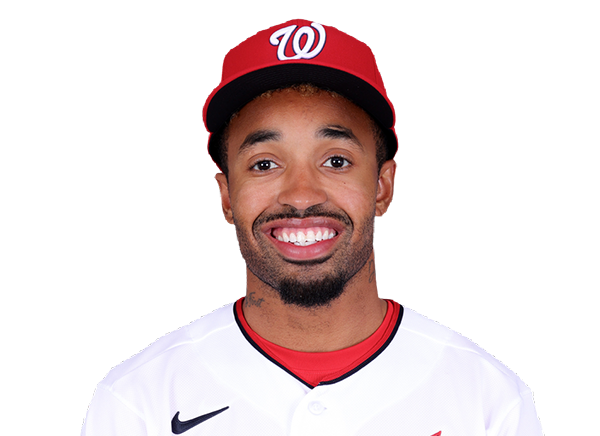 Nasim Nunez | 0-4 | 4 | 0 | 0 | 0 | 0 | 0 | 2 | 14 | .211 | .289 | .245 |
Los Angeles Dodgers
| Player | H-AB | AB | R | H | RBI | HR | BB | K | #P | AVG | OBP | SLG |
|---|---|---|---|---|---|---|---|---|---|---|---|---|
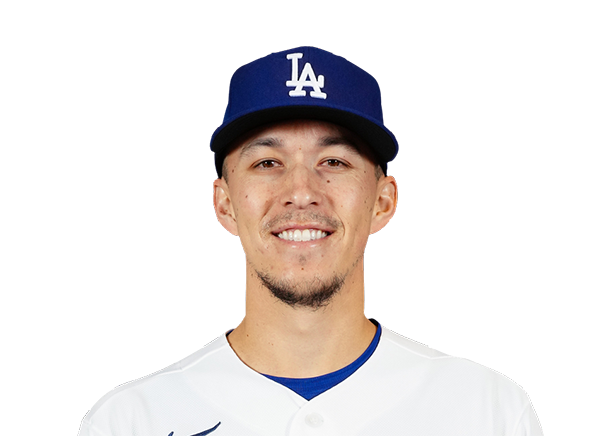 Tommy Edman | 2-4 | 4 | 2 | 2 | 1 | 0 | 1 | 1 | 14 | .277 | .353 | .420 |
 Mookie Betts | 1-5 | 5 | 1 | 1 | 4 | 1 | 0 | 0 | 14 | .246 | .308 | .423 |
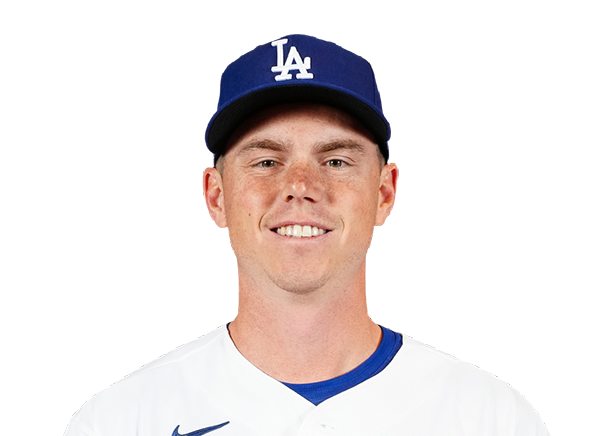 Will Smith | 1-3 | 3 | 1 | 1 | 1 | 0 | 2 | 1 | 24 | .237 | .330 | .363 |
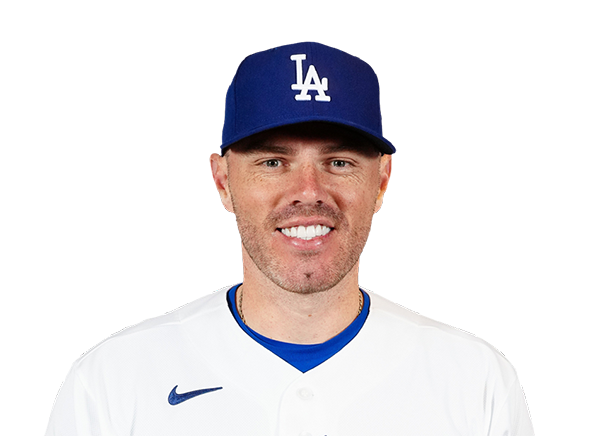 Freddie Freeman | 1-4 | 4 | 0 | 1 | 0 | 0 | 0 | 1 | 15 | .301 | .378 | .459 |
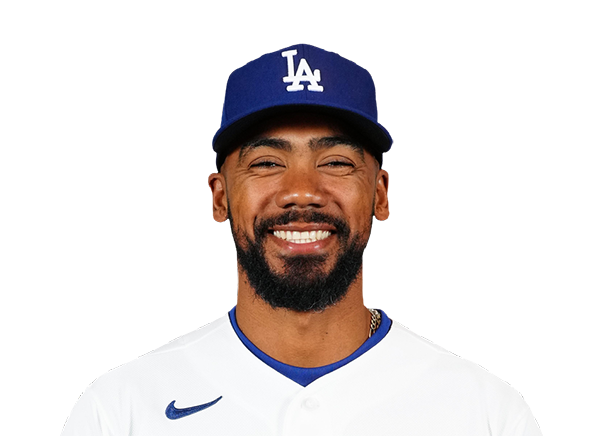 Teoscar Hernandez | 1-3 | 3 | 0 | 1 | 1 | 0 | 1 | 1 | 16 | .257 | .323 | .403 |
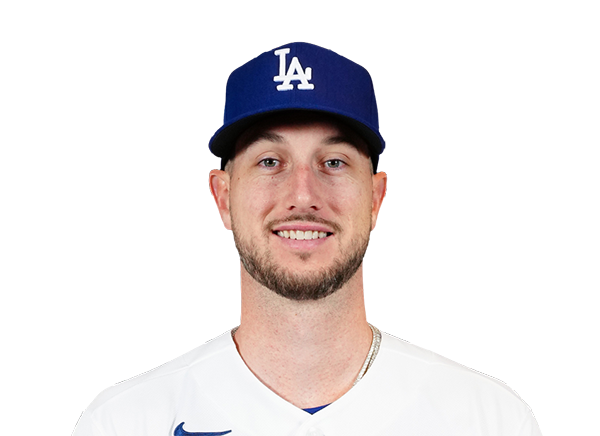 Kyle Tucker | 0-4 | 4 | 0 | 0 | 0 | 0 | 0 | 1 | 17 | .223 | .324 | .354 |
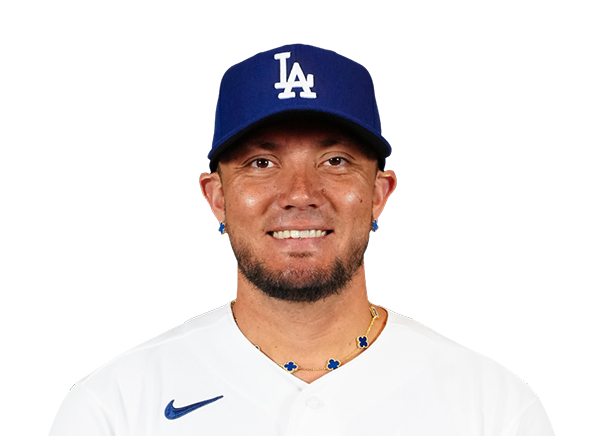 Miguel Rojas | 0-2 | 2 | 0 | 0 | 0 | 0 | 0 | 1 | 5 | .269 | .312 | .389 |
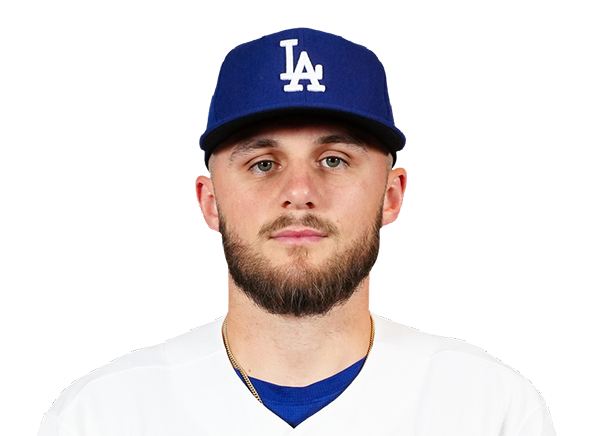 Alex Freeland | 0-2 | 2 | 0 | 0 | 0 | 0 | 0 | 0 | 10 | .223 | .308 | .301 |
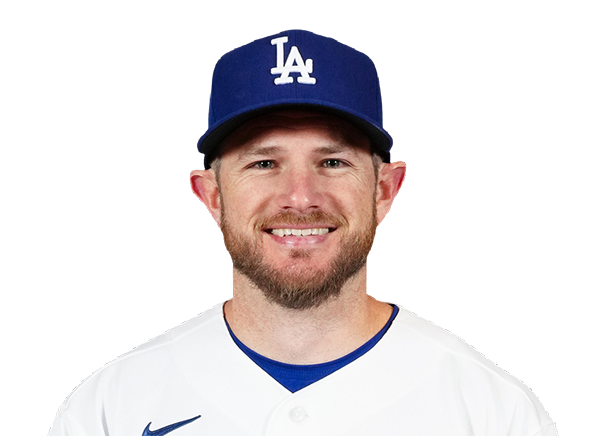 Max Muncy | 3-4 | 4 | 2 | 3 | 0 | 0 | 0 | 0 | 21 | .249 | .347 | .487 |
 Enrique Hernandez | 0-2 | 2 | 0 | 0 | 0 | 0 | 0 | 2 | 11 | .211 | .262 | .351 |
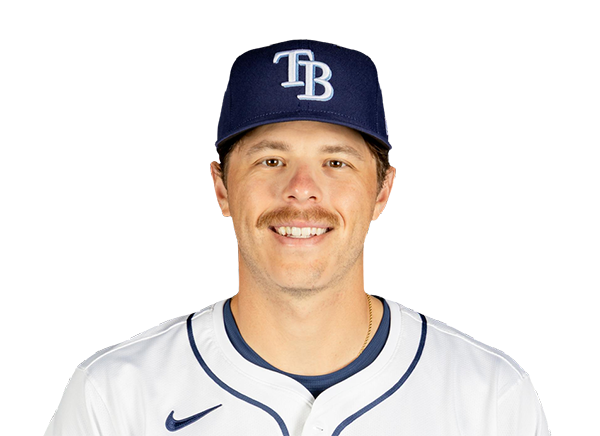 Hunter Feduccia | 0-0 | 0 | 0 | 0 | 0 | 0 | 1 | 0 | 7 | .241 | .318 | .346 |
 Alex Call | 1-1 | 1 | 1 | 1 | 0 | 0 | 0 | 0 | 3 | .253 | .362 | .329 |
Washington Nationals
| Player | IP | H | R | ER | BB | K | HR | PC-ST | ERA | PC |
|---|---|---|---|---|---|---|---|---|---|---|
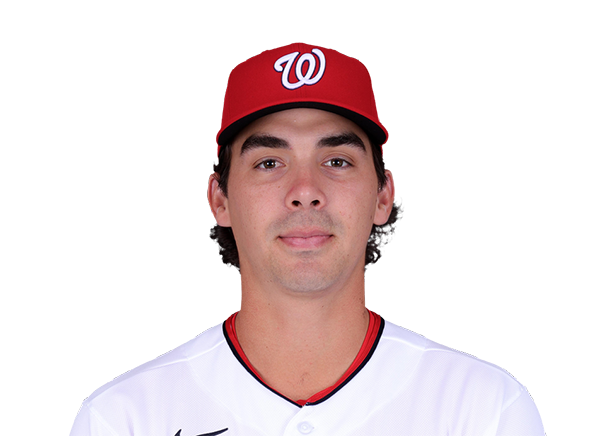 Andrew Alvarez | 4.1 | 4 | 3 | 3 | 2 | 5 | 0 | 78-48 | 3.60 | 78 |
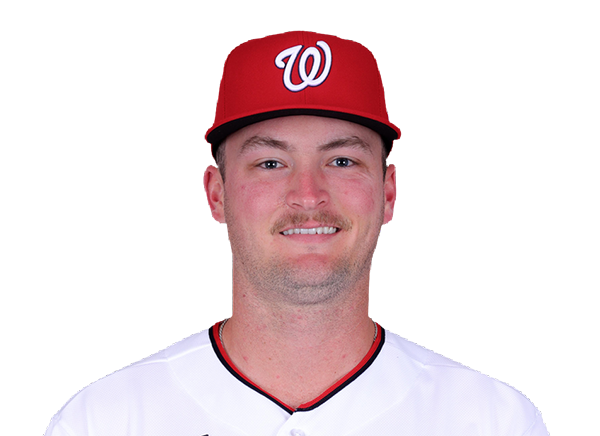 Brad Lord | 1.2 | 4 | 1 | 1 | 1 | 0 | 0 | 39-27 | 3.62 | 39 |
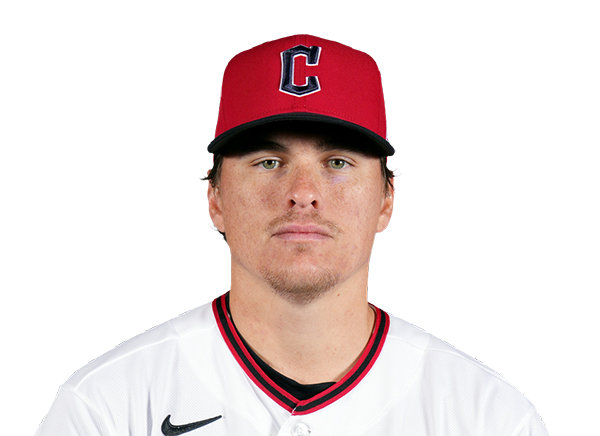 Will Dion | 2.0 | 2 | 3 | 3 | 2 | 3 | 1 | 40-25 | 3.89 | 40 |
Los Angeles Dodgers
| Player | IP | H | R | ER | BB | K | HR | PC-ST | ERA | PC |
|---|---|---|---|---|---|---|---|---|---|---|
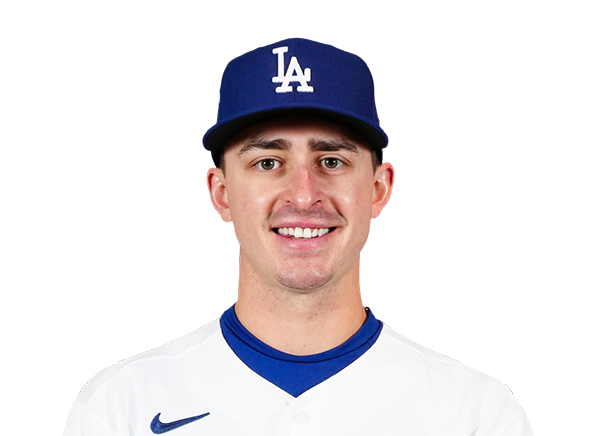 Justin Wrobleski | 3.0 | 8 | 4 | 4 | 1 | 6 | 1 | 73-50 | 3.84 | 73 |
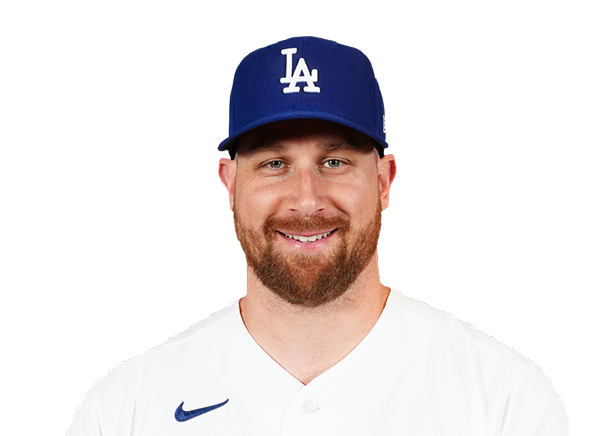 Brock Stewart | 1.0 | 0 | 0 | 0 | 1 | 0 | 0 | 11-7 | 2.49 | 11 |
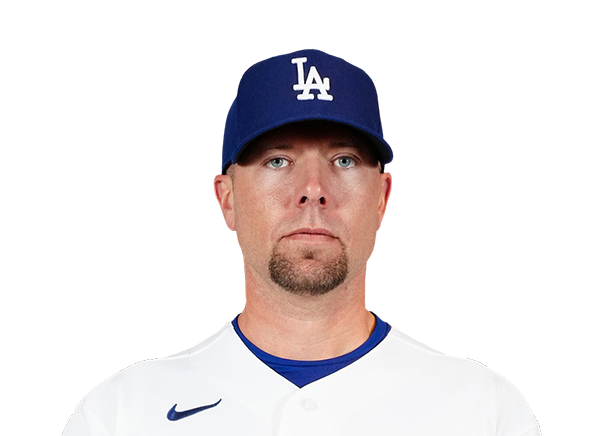 Blake Treinen | 1.0 | 0 | 0 | 0 | 1 | 1 | 0 | 16-8 | 3.38 | 16 |
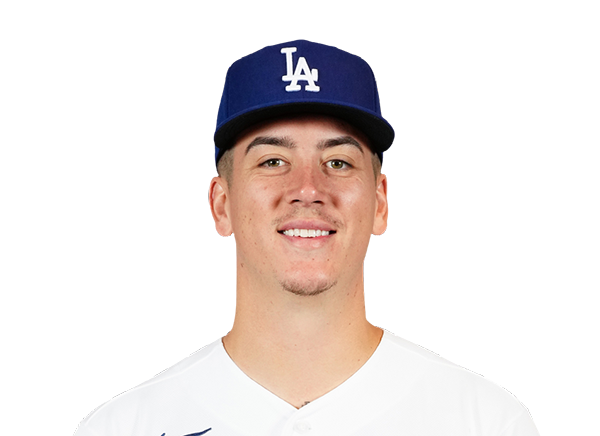 Bobby Miller | 3.0 | 1 | 1 | 1 | 2 | 2 | 0 | 53-30 | 3.00 | 53 |
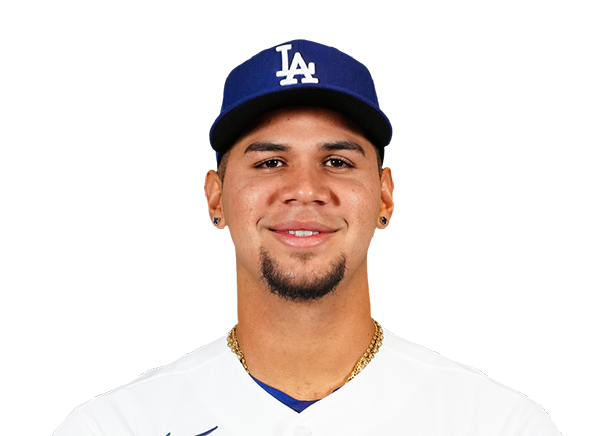 Edgardo Henriquez | 1.0 | 0 | 0 | 0 | 1 | 2 | 0 | 17-10 | 2.65 | 17 |
H2H / Season Series
LAD7–5
WSH
LAD6–5
WSH
LAD5–3
WSH
WSH6–8
LAD
WSH5–10
LAD
WSH6–13
LAD
Last 5 Games
| Date | Opponent | Result |
|---|---|---|
| Sep 6 | @ LAD | L5–7 |
| Sep 5 | @ LAD | L5–6 |
| Sep 4 | @ LAD | L3–5 |
| Sep 2 |  vs ATL | L0–9 |
| Sep 1 | vs ATL | W9–5 |
| Date | Opponent | Result |
|---|---|---|
| Sep 6 | vs WSH | W7–5 |
| Sep 5 | vs WSH | W6–5 |
| Sep 4 | vs WSH | W5–3 |
| Sep 3 |  vs STL | W3–2 |
| Sep 2 | vs STL | L6–8 |
Standings
American League
| Team | W | L | PCT | GB | DIFF | STRK |
|---|---|---|---|---|---|---|
1 Rays | 85 | 58 | .594 | - | +47 | L1 |
2 White Sox | 75 | 68 | .524 | 10 | +49 | W1 |
3 Astros | 73 | 71 | .507 | 12.5 | -38 | L2 |
4 Yankees | 81 | 62 | .566 | 4 | +117 | L1 |
5 Red Sox | 79 | 65 | .549 | 6.5 | +86 | W4 |
6 Guardians | 73 | 71 | .507 | 12.5 | -14 | W1 |
7 Blue Jays | 72 | 72 | .500 | 13.5 | -38 | L1 |
8 Rangers | 71 | 73 | .493 | 14.5 | -44 | W1 |
9 Orioles | 69 | 75 | .479 | 16.5 | -29 | L6 |
10 Twins | 68 | 75 | .476 | 17 | -48 | L1 |
11 Mariners | 67 | 77 | .465 | 18.5 | -71 | W1 |
12 Tigers | 65 | 78 | .455 | 20 | +50 | L1 |
13 Royals | 64 | 80 | .444 | 21.5 | -88 | W1 |
14 Athletics | 57 | 87 | .396 | 28.5 | -188 | L1 |
15 Angels | 54 | 89 | .378 | 31 | -77 | L1 |
National League
| Team | W | L | PCT | GB | DIFF | STRK |
|---|---|---|---|---|---|---|
1 Brewers | 88 | 56 | .611 | - | +168 | L2 |
| 2Dodgers | 86 | 57 | .601 | 1.5 | +152 | W4 |
| 3Braves | 85 | 58 | .594 | 2.5 | +120 | W1 |
4 Cubs | 81 | 63 | .563 | 7 | +132 | L1 |
5 Phillies | 80 | 63 | .559 | 7.5 | +34 | L1 |
6 Diamondbacks | 76 | 68 | .528 | 12 | -1 | W2 |
7 Padres | 75 | 68 | .524 | 12.5 | +8 | W1 |
8 Marlins | 72 | 72 | .500 | 16 | +15 | W1 |
| 9Cardinals | 72 | 72 | .500 | 16 | -9 | W1 |
10 Pirates | 71 | 73 | .493 | 17 | +26 | W1 |
11 Reds | 69 | 74 | .483 | 18.5 | -105 | W2 |
| 12Nationals | 67 | 78 | .462 | 21.5 | +9 | L4 |
13 Mets | 65 | 78 | .455 | 22.5 | -48 | W1 |
14 Giants | 59 | 85 | .410 | 29 | -75 | L1 |
15 Rockies | 55 | 88 | .385 | 32.5 | -140 | L1 |
WSH
VS
LAD
Pitchers
Andrew Alvarez
Catchers
Harry Ford
Infielders
Andres Chaparro
CJ Abrams
Brady House
Nasim Nunez
Outfielders
Dylan Crews
Daylen Lile
Jacob Young
Designated Hitters
James Wood
Pitchers
Justin Wrobleski
Catchers
Will Smith
Infielders
Mookie Betts
Freddie Freeman
Miguel Rojas
Enrique Hernandez
Outfielders
Tommy Edman
Teoscar Hernandez
Kyle Tucker
Designated Hitters
Max Muncy
Nationals
VS
Dodgers
Batting
145
Team Games Played
143
4948
At Bats
4818
1231
Hits
1237
709
Runs Batted In
665
194
Home Runs
174
156
Stolen Bases
59
.249
Batting Average
.257
748
Runs
705
252
Doubles
234
29
Triples
15
2123
Total Bases
2023
509
Walks
541
1213
Strikeouts
1128
.325
On Base Percentage
.336
.429
Slugging Percentage
.420
.754
OBP Pct + SLG Pct
.756
145
Games Played
143
145
Games Started
143
66
Hit By Pitch
57
0.0
Wins Above Replacement
0.0
0.0
Offensive Wins Above Replacement
0.0
36
Caught Stealing
18
1
Is Qualified
1
714.9
Runs Created
687.3
5.0
Runs Created Per 27 Outs
4.9
.091
Walks Per Plate Appearance
.099
0.42
Walk To Strikeout Ratio
0.48
.180
Isolated Power
.163
.307
Secondary Average
.284
3.82
Pitches Per Plate Appearance
3.93
475
Extra Base Hits
423
5577
Plate Appearances
5477
25.5
At Bats Per Home Run
27.7
18
Sacrifice Hit
14
33
Sacrifice Flies
44
Pitching
145
Team Games Played
143
33
Quality Starts
74
67
Wins
86
78
Losses
57
34
Saves
41
71
Holds
89
1259
Hits
1039
675
Earned runs
522
197
Home Runs
159
529
Walks
442
1133
Strikeouts
1313
7.9
Strikeouts Per 9 Innings
9.3
150.8
Pitches Per Start
143.9
1.39
Walks Plus Hits Per Inning Pitched
1.17
4.72
Earned Run Average
3.71
78
Losses
57
1286.0
Innings pitched
1266.2
.462
Win Percentage
.601
71
Save Opportunities
61
.255
Opponent Batting Average
.221
.333
Opponent's On-base pct.
.294
.425
Opponent's Slugging pct.
.373
.758
Opponent's OPB Pct + SLG Pct
.667
4937
At Bats
4711
227
Doubles
215
11
Triples
13
75
Batters Hit
61
107
Stolen Bases
92
145
Games Played
143
0
Complete Games
1
5
Shutouts
11
52
Wild Pitches
34
710
Runs Batted In
526
1
Balks
4
1286.0
Innings pitched
1266.2
7.9
Strikeouts Per 9 Innings
9.3
31
Caught Stealing
24
145
Games Started
143
0.0
Wins Above Replacement
0.0
1
Is Qualified
1
739
Runs
553
675
Earned Runs
522
2099
Total Bases
1757
Fielding
145
Team Games Played
143
1286
Full Innings
1267
5265
Total Chances
5005
3858
Putouts
3800
1312
Assists
1149
95
Errors
56
252
Double Plays
234
0.982
Fielding Percentage
0.989
36.2
Range Factor
35.2
0.0
Zone Rating
0.0
145
Games Played
143
0
Games Started
0
0.0
Defensive Wins Above Replacement
0.0
1
Qualified
1