

Nationals vs Giants Live Score (10 Jun, 2026)
Game Information
Stage
Standard
Season
2026
First Pitch
Wed, Jun 10, 3:45 pm
Venue
Oracle Park
Location
San Francisco, California
Attendance
32,459
Live Situation
2Balls
0Strikes
0Outs
—Pitcher
—At Bat
Pitch Sequence
1
BALL
Slider
81 MPH
2
BALL
Slider
81 MPH
3
BALL IN PLAY
Slider
80 MPH
Injury Report

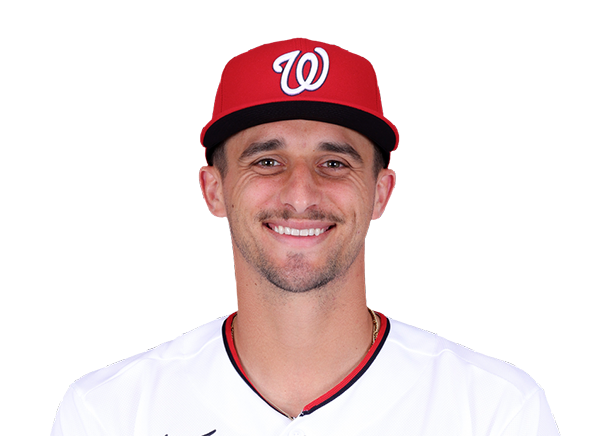
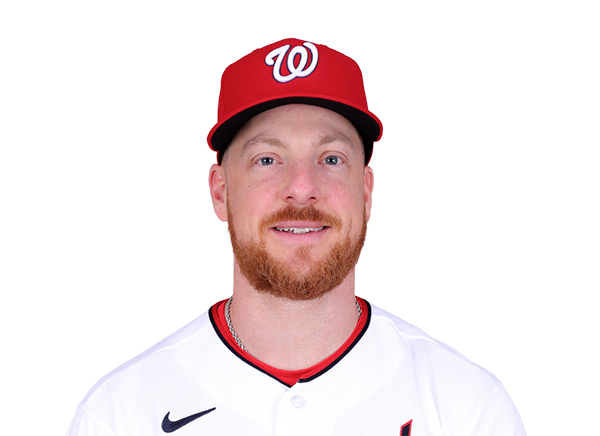
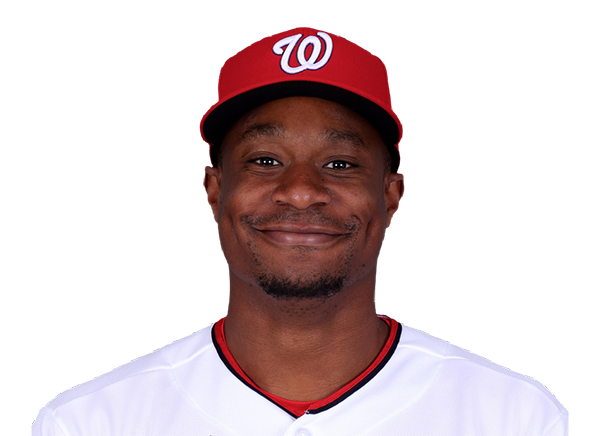
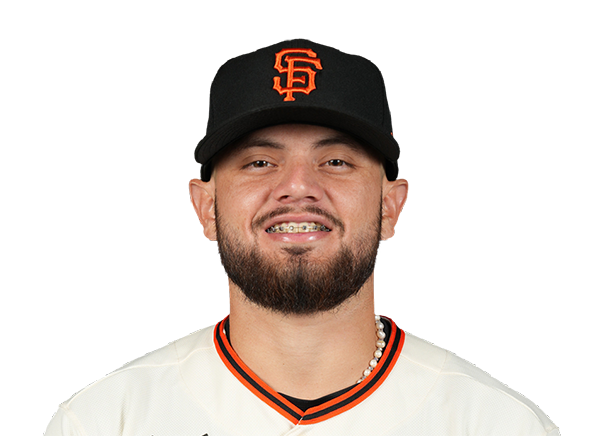
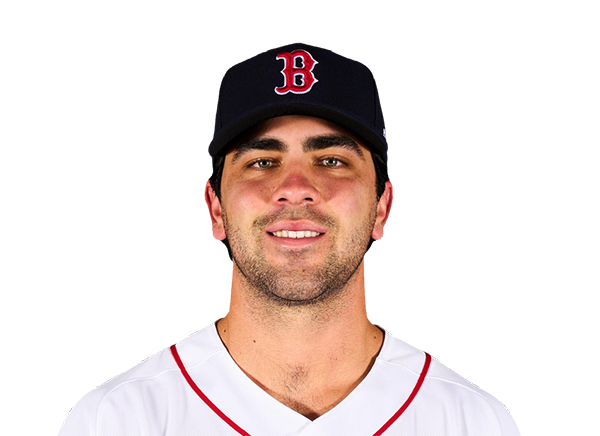
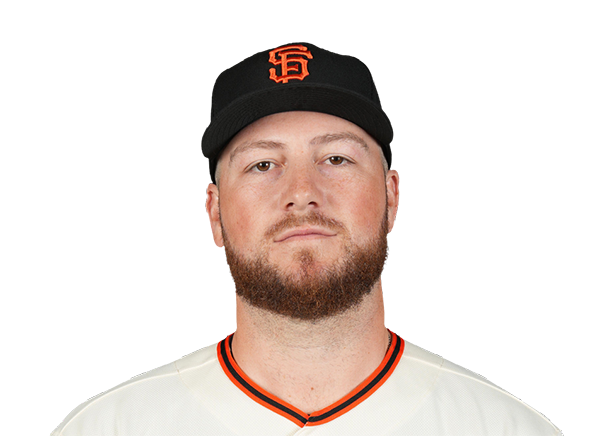

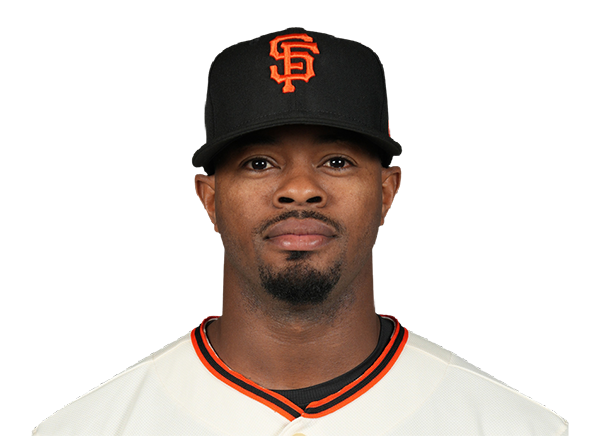
Team Stats
 WSH
SF


10
Runs
11
14
Hits
14
0
Errors
0
2
Home Runs
4
1
Walks
4
6
Strikeouts
7
Player Box Score
Washington Nationals
| Player | H-AB | AB | R | H | RBI | HR | BB | K | #P | AVG | OBP | SLG |
|---|---|---|---|---|---|---|---|---|---|---|---|---|
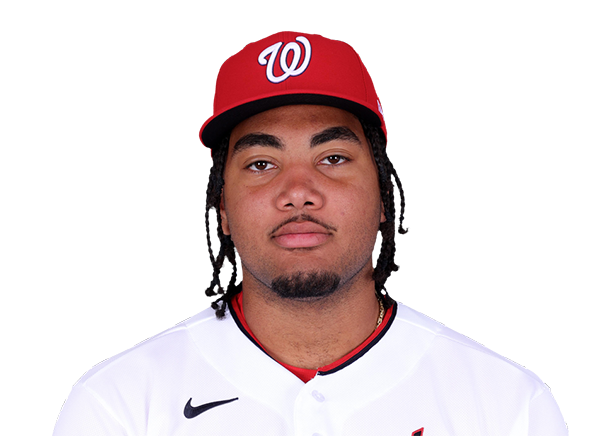 James Wood | 1-4 | 4 | 2 | 1 | 2 | 1 | 1 | 1 | 25 | .271 | .407 | .534 |
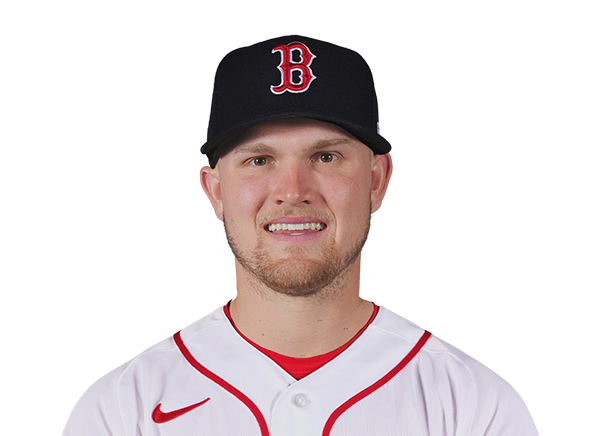 Curtis Mead | 2-5 | 5 | 2 | 2 | 1 | 1 | 0 | 0 | 22 | .242 | .349 | .485 |
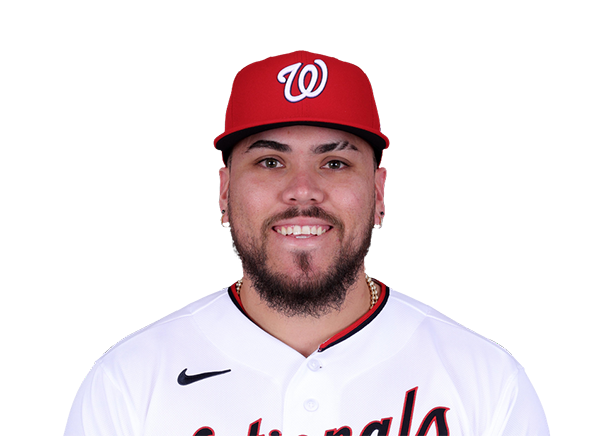 Andres Chaparro | 0-3 | 3 | 0 | 0 | 0 | 0 | 0 | 1 | 14 | .148 | .343 | .222 |
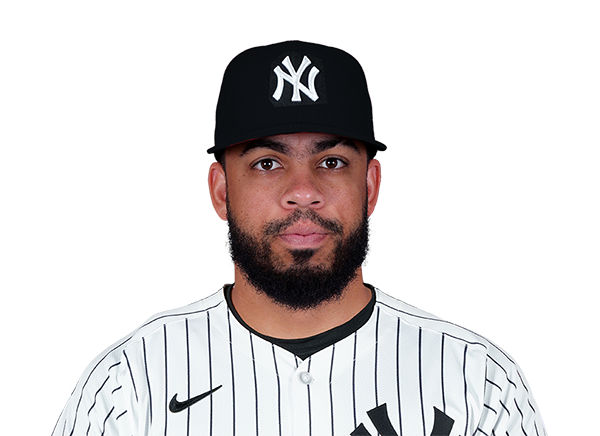 Luis Garcia Jr. | 1-2 | 2 | 1 | 1 | 1 | 0 | 0 | 1 | 10 | .264 | .290 | .466 |
 Dylan Crews | 1-5 | 5 | 1 | 1 | 1 | 0 | 0 | 0 | 14 | .183 | .237 | .282 |
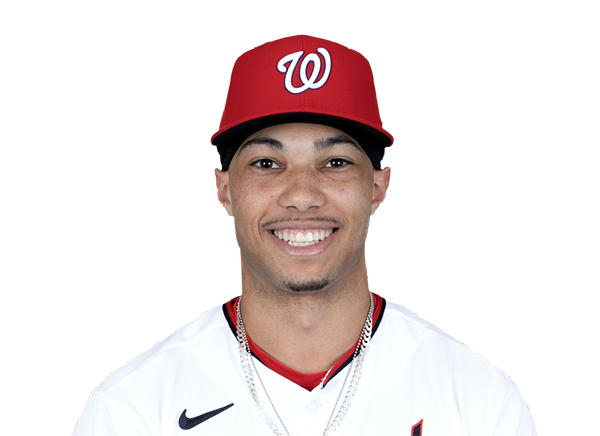 Daylen Lile | 4-5 | 5 | 1 | 4 | 2 | 0 | 0 | 0 | 15 | .266 | .323 | .424 |
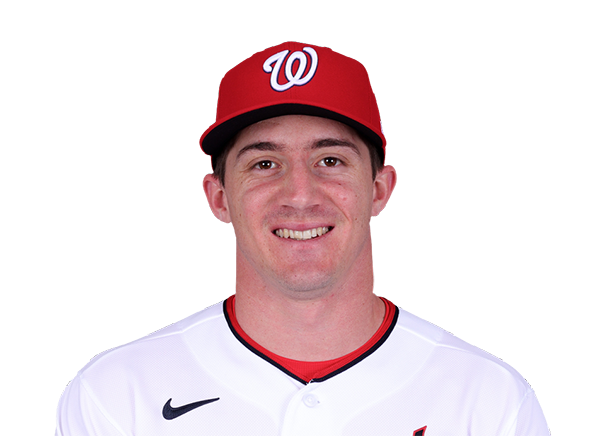 Jacob Young | 1-5 | 5 | 1 | 1 | 0 | 0 | 0 | 2 | 26 | .236 | .286 | .396 |
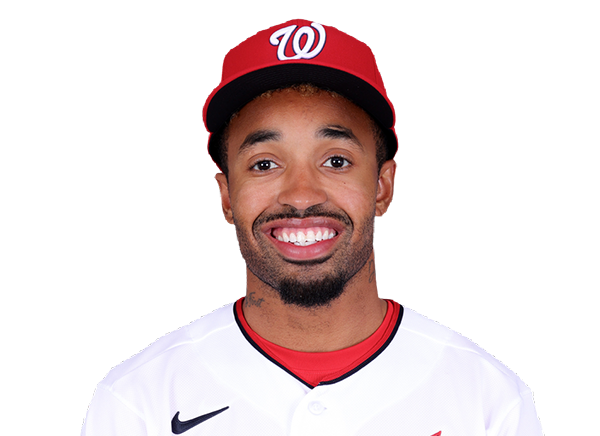 Nasim Nunez | 1-4 | 4 | 1 | 1 | 2 | 0 | 0 | 1 | 19 | .203 | .287 | .229 |
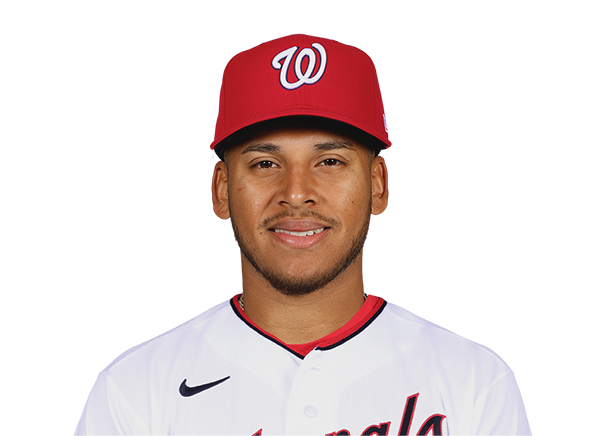 Jorbit Vivas | 2-4 | 4 | 0 | 2 | 1 | 0 | 0 | 0 | 10 | .238 | .319 | .317 |
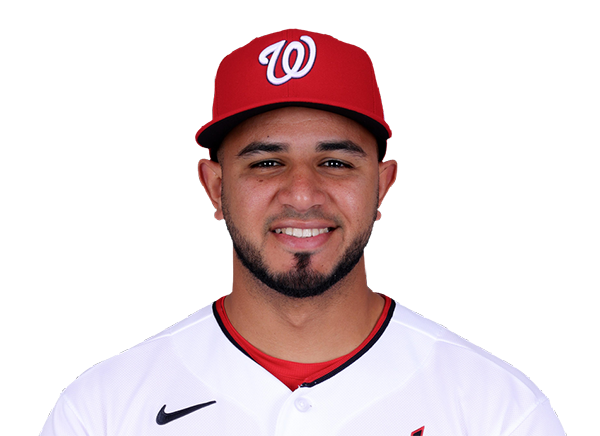 Keibert Ruiz | 1-4 | 4 | 1 | 1 | 0 | 0 | 0 | 0 | 15 | .274 | .296 | .489 |
San Francisco Giants
| Player | H-AB | AB | R | H | RBI | HR | BB | K | #P | AVG | OBP | SLG |
|---|---|---|---|---|---|---|---|---|---|---|---|---|
 Casey Schmitt | 1-5 | 5 | 0 | 1 | 0 | 0 | 0 | 0 | 16 | .276 | .307 | .516 |
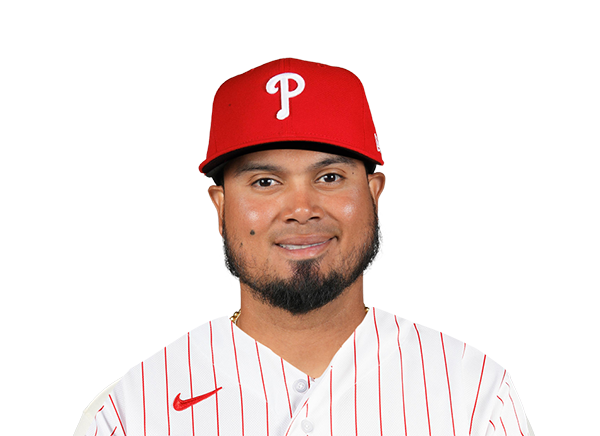 Luis Arraez | 2-5 | 5 | 1 | 2 | 0 | 0 | 0 | 0 | 22 | .327 | .361 | .441 |
 Matt Chapman | 4-5 | 5 | 3 | 4 | 3 | 2 | 0 | 0 | 18 | .262 | .345 | .409 |
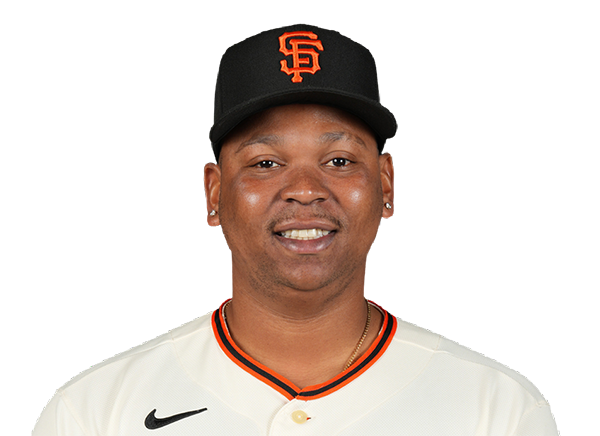 Rafael Devers | 1-4 | 4 | 2 | 1 | 1 | 1 | 1 | 1 | 21 | .233 | .292 | .415 |
 Jung Hoo Lee | 2-4 | 4 | 2 | 2 | 0 | 0 | 1 | 1 | 22 | .338 | .372 | .457 |
 Bryce Eldridge | 1-4 | 4 | 2 | 1 | 4 | 1 | 1 | 1 | 18 | .298 | .385 | .521 |
 Daniel Susac | 2-4 | 4 | 1 | 2 | 1 | 0 | 0 | 0 | 18 | .309 | .367 | .395 |
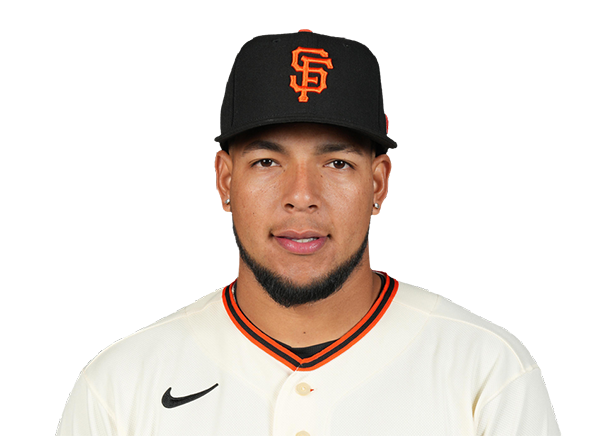 Victor Bericoto | 0-2 | 2 | 0 | 0 | 0 | 0 | 0 | 1 | 13 | .176 | .176 | .353 |
 Drew Gilbert | 0-1 | 1 | 0 | 0 | 1 | 0 | 1 | 0 | 10 | .231 | .285 | .373 |
 Jonah Cox | 1-3 | 3 | 0 | 1 | 0 | 0 | 0 | 2 | 11 | .400 | .400 | .800 |
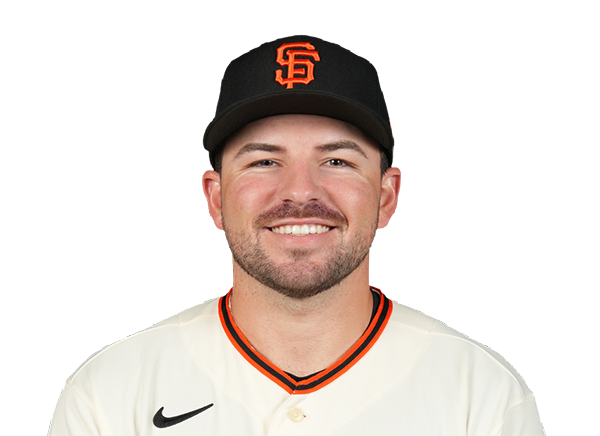 Buddy Kennedy | 0-1 | 1 | 0 | 0 | 0 | 0 | 0 | 1 | 5 | .000 | .125 | .000 |
 Eric Haase | 0-0 | 0 | 0 | 0 | 0 | 0 | 0 | 0 | 0 | .234 | .280 | .553 |
Washington Nationals
| Player | IP | H | R | ER | BB | K | HR | PC-ST | ERA | PC |
|---|---|---|---|---|---|---|---|---|---|---|
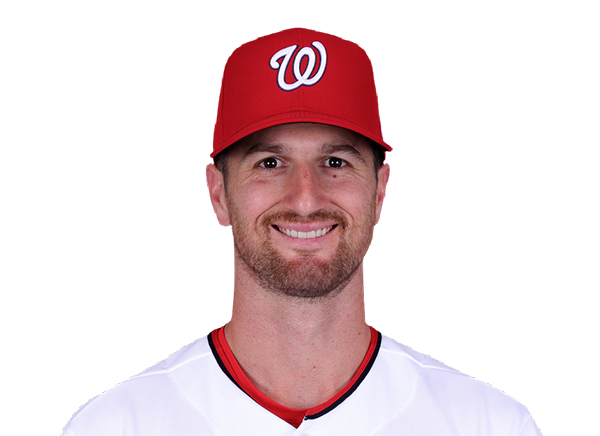 Foster Griffin | 6.0 | 6 | 1 | 1 | 0 | 5 | 1 | 100-72 | 3.46 | 100 |
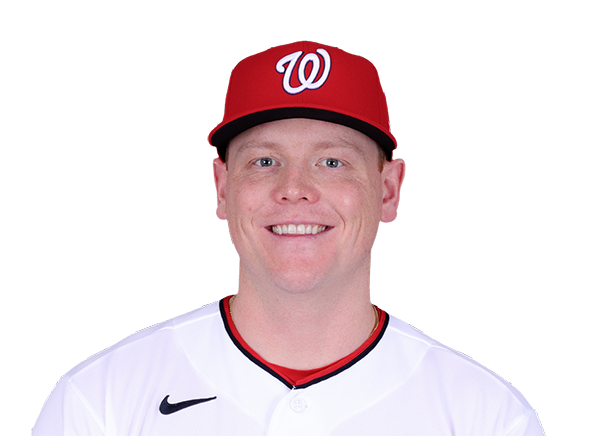 Paxton Schultz | 1.0 | 4 | 5 | 5 | 3 | 1 | 2 | 43-24 | 6.04 | 43 |
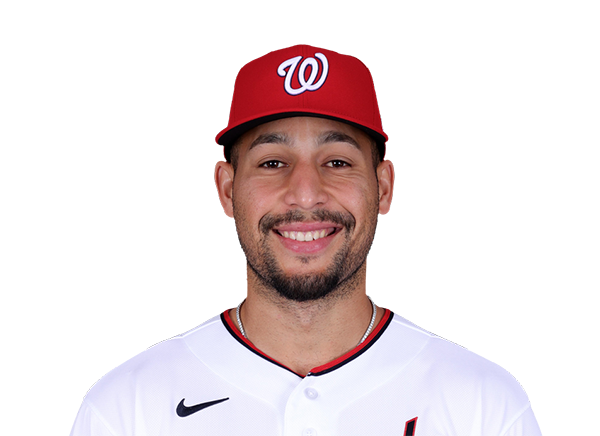 Orlando Ribalta | 1.0 | 0 | 0 | 0 | 0 | 1 | 0 | 10-7 | 1.86 | 10 |
 Gus Varland | 0.0 | 2 | 3 | 3 | 1 | 0 | 0 | 13-7 | 5.11 | 13 |
 Mitchell Parker | 0.0 | 2 | 2 | 2 | 0 | 0 | 1 | 8-5 | 5.91 | 8 |
San Francisco Giants
| Player | IP | H | R | ER | BB | K | HR | PC-ST | ERA | PC |
|---|---|---|---|---|---|---|---|---|---|---|
 Robbie Ray | 5.2 | 7 | 5 | 5 | 0 | 3 | 1 | 93-60 | 4.42 | 93 |
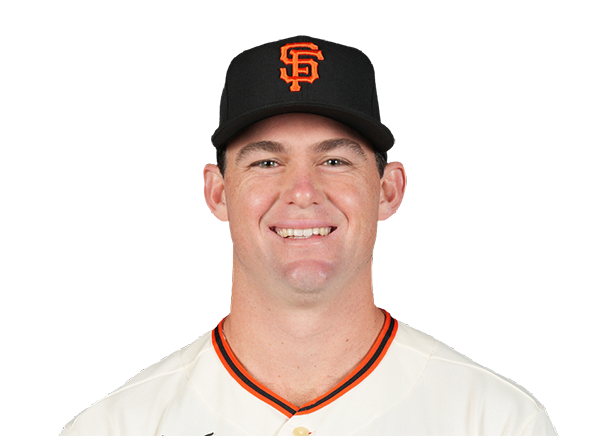 Carson Seymour | 1.1 | 5 | 4 | 4 | 1 | 1 | 0 | 46-30 | 14.54 | 46 |
 Reiver Sanmartin | 2.0 | 2 | 1 | 1 | 0 | 2 | 1 | 31-19 | 4.50 | 31 |
H2H / Season Series
SF11–10
WSH
SF3–6
WSH
SF3–4
WSH
WSH3–0
SF
WSH6–7
SF
WSH5–10
SF
Last 5 Games
| Date | Opponent | Result |
|---|---|---|
| Aug 21 |  @ MIA | L2–3 |
| Aug 20 |  @ TEX | L0–2 |
| Aug 19 | @ TEX | W6–0 |
| Aug 18 | @ TEX | L0–5 |
| Aug 16 |  @ NYM | L3–4 |
| Date | Opponent | Result |
|---|---|---|
| Aug 21 |  @ BOS | L4–6 |
| Aug 20 |  @ CLE | L2–5 |
| Aug 19 | @ CLE | W1–0 |
| Aug 18 | @ CLE | L1–8 |
| Aug 16 |  vs COL | L7–13 |
Standings
American League
| Team | W | L | PCT | GB | DIFF | STRK |
|---|---|---|---|---|---|---|
1 Rays | 76 | 52 | .594 | - | +43 | L2 |
2 White Sox | 67 | 61 | .523 | 9 | +47 | W1 |
3 Astros | 65 | 64 | .504 | 11.5 | -42 | W1 |
4 Yankees | 73 | 56 | .566 | 3.5 | +95 | L1 |
| 5Red Sox | 69 | 59 | .539 | 7 | +97 | W1 |
| 6Rangers | 64 | 65 | .496 | 12.5 | -45 | W2 |
7 Blue Jays | 64 | 67 | .489 | 13.5 | -50 | W1 |
8 Twins | 63 | 66 | .488 | 13.5 | -45 | L1 |
| 9Guardians | 63 | 66 | .488 | 13.5 | -15 | W2 |
10 Orioles | 62 | 67 | .481 | 14.5 | -34 | W1 |
11 Tigers | 61 | 67 | .477 | 15 | +79 | L3 |
12 Mariners | 61 | 68 | .473 | 15.5 | -45 | W1 |
13 Royals | 56 | 74 | .431 | 21 | -97 | W6 |
14 Angels | 51 | 78 | .395 | 25.5 | -71 | L1 |
15 Athletics | 49 | 80 | .380 | 27.5 | -189 | L5 |
National League
| Team | W | L | PCT | GB | DIFF | STRK |
|---|---|---|---|---|---|---|
1 Brewers | 81 | 49 | .623 | - | +163 | W3 |
2 Dodgers | 78 | 51 | .605 | 2.5 | +146 | W4 |
3 Braves | 75 | 55 | .577 | 6 | +108 | L2 |
4 Cubs | 74 | 55 | .574 | 6.5 | +99 | L2 |
5 Phillies | 71 | 58 | .550 | 9.5 | +16 | W7 |
6 Padres | 69 | 60 | .535 | 11.5 | +7 | W1 |
7 Diamondbacks | 68 | 61 | .527 | 12.5 | +13 | W2 |
8 Cardinals | 66 | 64 | .508 | 15 | +9 | L1 |
| 9Marlins | 65 | 64 | .504 | 15.5 | +15 | W1 |
10 Pirates | 63 | 67 | .485 | 18 | +30 | L1 |
11 Reds | 61 | 68 | .473 | 19.5 | -98 | L2 |
| 12Nationals | 61 | 69 | .469 | 20 | +16 | L2 |
| 13Mets | 58 | 71 | .450 | 22.5 | -44 | L1 |
| 14Giants | 52 | 76 | .406 | 28 | -78 | L2 |
| 15Rockies | 50 | 78 | .391 | 30 | -130 | L4 |
WSH
VS
SF
Pitchers
Foster Griffin
Paxton Schultz
Orlando Ribalta
Gus Varland
Mitchell Parker
Catchers
Keibert Ruiz
Infielders
Curtis Mead
Andres Chaparro
Luis Garcia Jr.
Nasim Nunez
Jorbit Vivas
Outfielders
Dylan Crews
Daylen Lile
Jacob Young
Designated Hitters
James Wood
Pitchers
Robbie Ray
Carson Seymour
Reiver Sanmartin
Catchers
Daniel Susac
Infielders
Casey Schmitt
Luis Arraez
Matt Chapman
Rafael Devers
Outfielders
Jung Hoo Lee
Victor Bericoto
Drew Gilbert
Jonah Cox
Eric Haase
Designated Hitters
Bryce Eldridge
Other Players
Buddy Kennedy
Nationals
VS
Giants
Batting
130
Team Games Played
128
4450
At Bats
4346
1110
Hits
1074
649
Runs Batted In
497
183
Home Runs
141
139
Stolen Bases
56
.249
Batting Average
.247
678
Runs
517
218
Doubles
214
26
Triples
24
1929
Total Bases
1759
449
Walks
338
1088
Strikeouts
1019
.325
On Base Percentage
.305
.433
Slugging Percentage
.405
.758
OBP Pct + SLG Pct
.710
130
Games Played
128
130
Games Started
128
63
Hit By Pitch
41
0.0
Wins Above Replacement
0.0
0.0
Offensive Wins Above Replacement
0.0
31
Caught Stealing
18
1
Is Qualified
1
647.9
Runs Created
540.2
5.0
Runs Created Per 27 Outs
4.3
.090
Walks Per Plate Appearance
.071
0.41
Walk To Strikeout Ratio
0.33
.184
Isolated Power
.158
.309
Secondary Average
.244
3.81
Pitches Per Plate Appearance
3.86
427
Extra Base Hits
379
5009
Plate Appearances
4783
24.3
At Bats Per Home Run
30.8
15
Sacrifice Hit
22
29
Sacrifice Flies
36
Pitching
130
Team Games Played
128
29
Quality Starts
45
61
Wins
52
69
Losses
76
33
Saves
24
67
Holds
61
1143
Hits
1053
599
Earned runs
546
178
Home Runs
118
459
Walks
481
999
Strikeouts
962
7.8
Strikeouts Per 9 Innings
7.7
150.6
Pitches Per Start
147.6
1.39
Walks Plus Hits Per Inning Pitched
1.36
4.67
Earned Run Average
4.36
69
Losses
76
1155.0
Innings pitched
1128.0
.469
Win Percentage
.406
66
Save Opportunities
43
.257
Opponent Batting Average
.247
.333
Opponent's On-base pct.
.329
.429
Opponent's Slugging pct.
.387
.761
Opponent's OPB Pct + SLG Pct
.716
4444
At Bats
4257
207
Doubles
186
11
Triples
28
66
Batters Hit
55
93
Stolen Bases
104
130
Games Played
128
0
Complete Games
1
5
Shutouts
9
46
Wild Pitches
47
639
Runs Batted In
559
1
Balks
4
1155.0
Innings pitched
1128.0
7.8
Strikeouts Per 9 Innings
7.7
28
Caught Stealing
34
130
Games Started
128
0.0
Wins Above Replacement
0.0
1
Is Qualified
1
662
Runs
595
599
Earned Runs
546
1906
Total Bases
1649
Fielding
130
Team Games Played
128
1155
Full Innings
1128
4737
Total Chances
4675
3465
Putouts
3384
1182
Assists
1207
90
Errors
84
218
Double Plays
214
0.981
Fielding Percentage
0.982
36.2
Range Factor
36.6
0.0
Zone Rating
0.0
130
Games Played
128
0
Games Started
0
0.0
Defensive Wins Above Replacement
0.0
1
Qualified
1