

Nationals vs Mets Live Score (15 Aug, 2026)
Game Information
Stage
Standard
Season
2026
First Pitch
Sat, Aug 15, 4:10 pm
Venue
Citi Field
Location
Queens, New York
Attendance
34,737
Live Situation
1Balls
2Strikes
0Outs
—Pitcher
—At Bat
Pitch Sequence
1
STRIKE LOOKING
Slider
91 MPH
2
BALL
Slider
92 MPH
3
STRIKE SWINGING
Slider
92 MPH
4
BALL IN PLAY
Slider
92 MPH
Injury Report
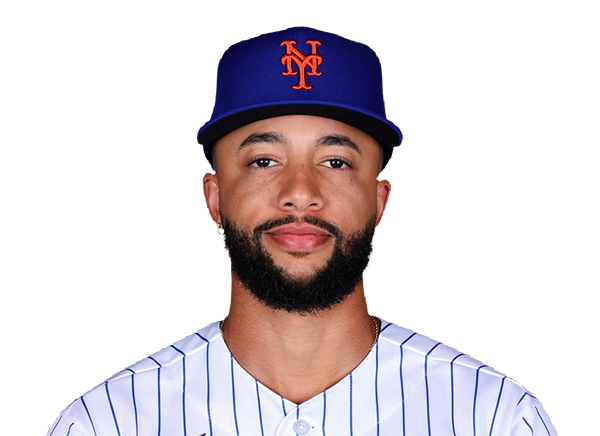
Team Stats
 WSH
NYM


4
Runs
5
7
Hits
8
0
Errors
0
2
Home Runs
1
2
Walks
7
11
Strikeouts
12
Player Box Score
Washington Nationals
| Player | H-AB | AB | R | H | RBI | HR | BB | K | #P | AVG | OBP | SLG |
|---|---|---|---|---|---|---|---|---|---|---|---|---|
 Dylan Crews | 0-4 | 4 | 0 | 0 | 0 | 0 | 0 | 1 | 14 | .214 | .285 | .365 |
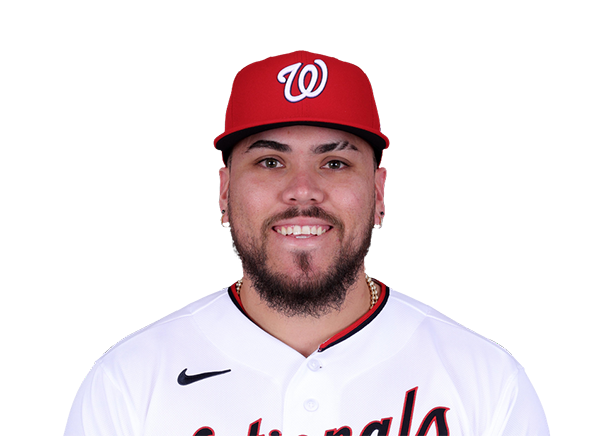 Andres Chaparro | 1-2 | 2 | 2 | 1 | 1 | 1 | 1 | 1 | 14 | .231 | .352 | .500 |
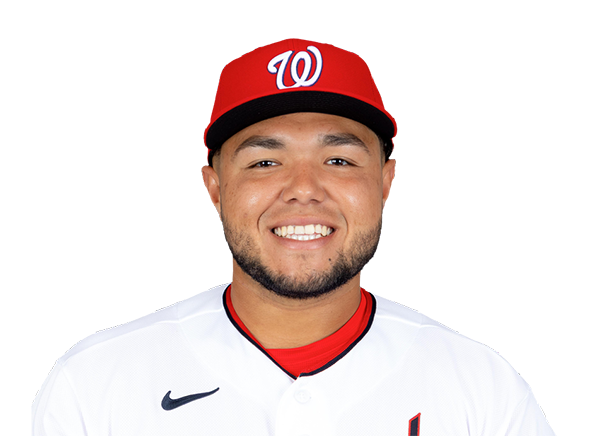 Abimelec Ortiz | 1-1 | 1 | 0 | 1 | 0 | 0 | 0 | 0 | 3 | .306 | .324 | .667 |
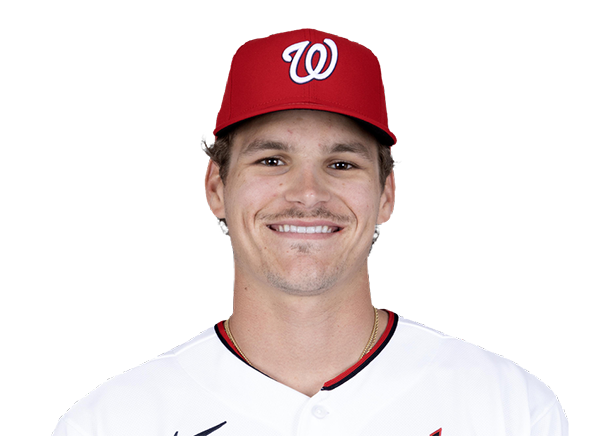 Brady House | 1-4 | 4 | 1 | 1 | 3 | 1 | 0 | 2 | 18 | .242 | .295 | .408 |
 CJ Abrams | 0-4 | 4 | 0 | 0 | 0 | 0 | 0 | 0 | 11 | .280 | .357 | .534 |
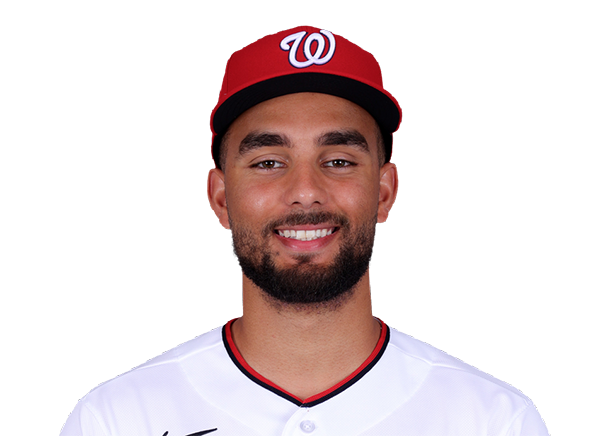 Harry Ford | 0-3 | 3 | 0 | 0 | 0 | 0 | 1 | 2 | 19 | .213 | .327 | .447 |
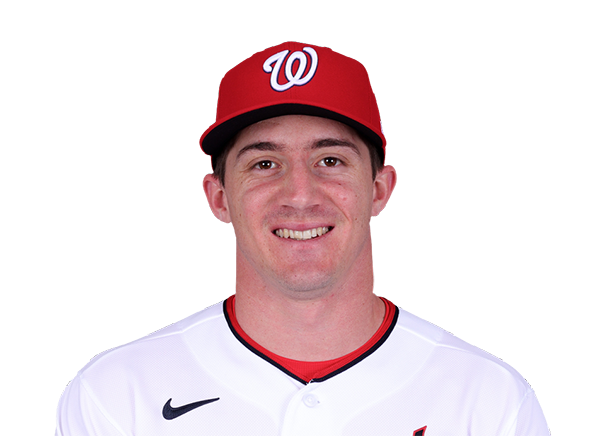 Jacob Young | 2-4 | 4 | 0 | 2 | 0 | 0 | 0 | 1 | 14 | .251 | .314 | .406 |
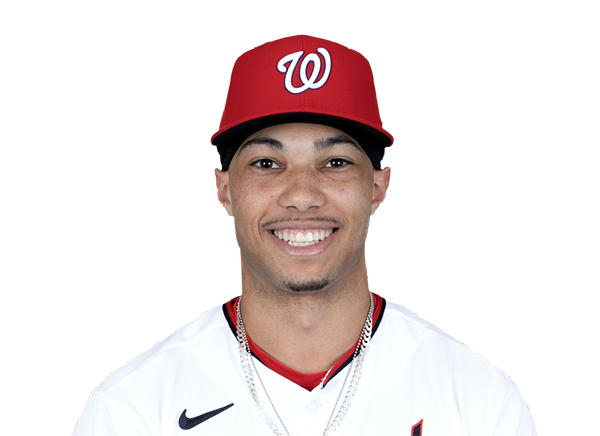 Daylen Lile | 0-4 | 4 | 0 | 0 | 0 | 0 | 0 | 2 | 13 | .247 | .295 | .413 |
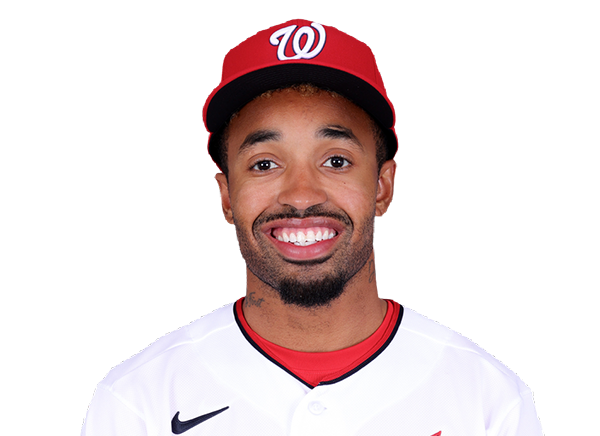 Nasim Nunez | 1-4 | 4 | 0 | 1 | 0 | 0 | 0 | 1 | 12 | .228 | .313 | .265 |
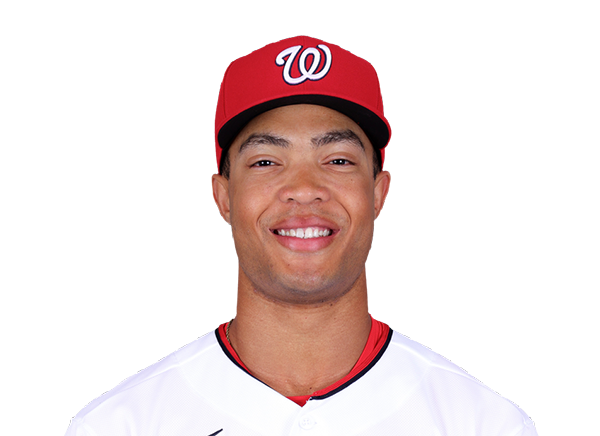 Andrew Pinckney | 1-2 | 2 | 1 | 1 | 0 | 0 | 0 | 1 | 8 | .300 | .385 | .800 |
New York Mets
| Player | H-AB | AB | R | H | RBI | HR | BB | K | #P | AVG | OBP | SLG |
|---|---|---|---|---|---|---|---|---|---|---|---|---|
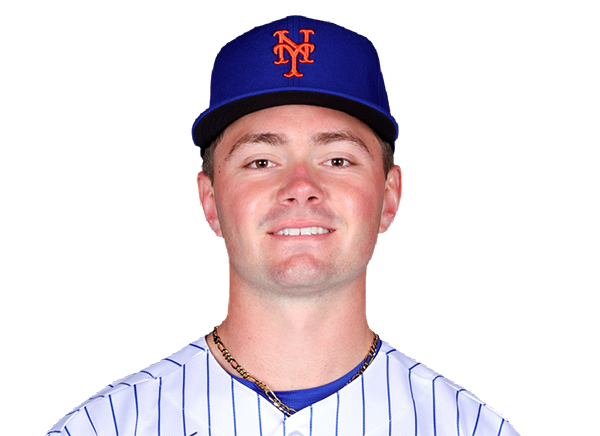 A.J. Ewing | 0-4 | 4 | 1 | 0 | 0 | 0 | 1 | 1 | 24 | .252 | .324 | .381 |
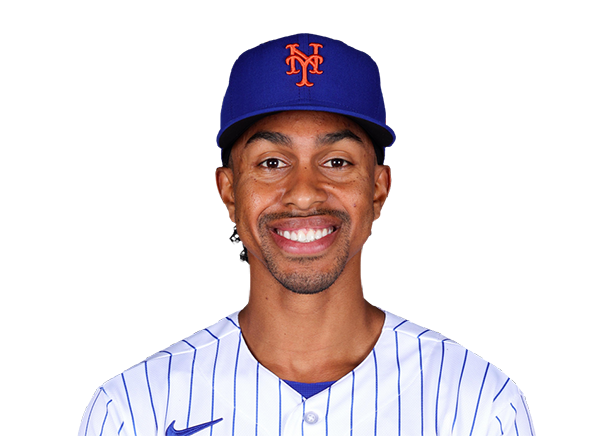 Francisco Lindor | 2-4 | 4 | 1 | 2 | 1 | 0 | 1 | 1 | 22 | .244 | .332 | .442 |
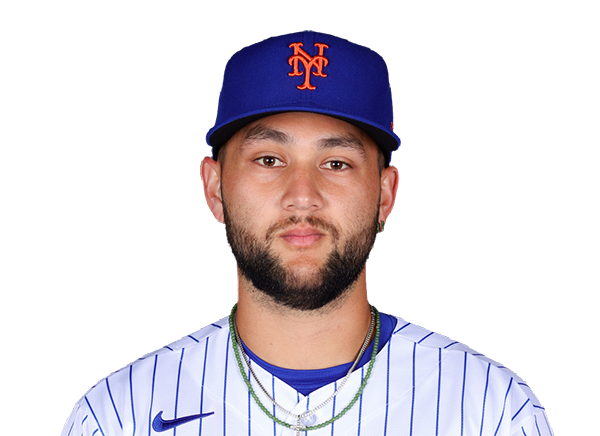 Bo Bichette | 1-4 | 4 | 0 | 1 | 0 | 0 | 0 | 2 | 16 | .262 | .308 | .378 |
 Carson Benge | 1-2 | 2 | 1 | 1 | 1 | 1 | 2 | 1 | 18 | .275 | .338 | .419 |
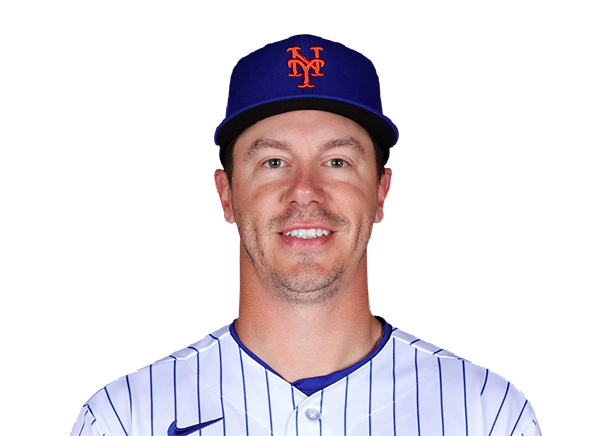 Jared Young | 2-4 | 4 | 0 | 2 | 2 | 0 | 0 | 2 | 20 | .266 | .338 | .449 |
 Marcus Semien | 0-3 | 3 | 0 | 0 | 0 | 0 | 1 | 1 | 20 | .209 | .269 | .354 |
 Brett Baty | 0-2 | 2 | 1 | 0 | 0 | 0 | 2 | 0 | 15 | .213 | .286 | .327 |
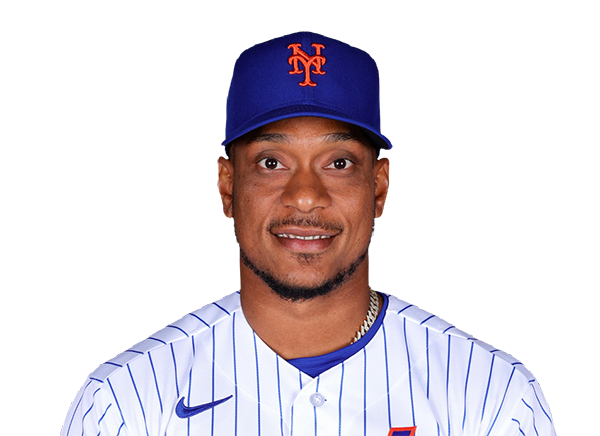 Jorge Polanco | 1-4 | 4 | 0 | 1 | 0 | 0 | 0 | 2 | 21 | .141 | .197 | .227 |
 Cristian Pache | 0-0 | 0 | 1 | 0 | 0 | 0 | 0 | 0 | 0 | .000 | .000 | .000 |
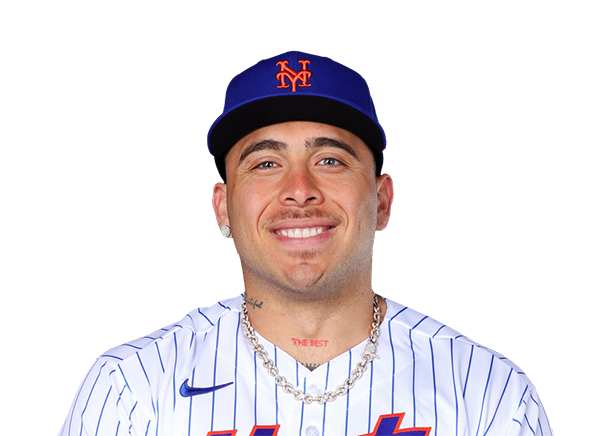 Francisco Alvarez | 1-4 | 4 | 0 | 1 | 1 | 0 | 0 | 2 | 20 | .248 | .338 | .428 |
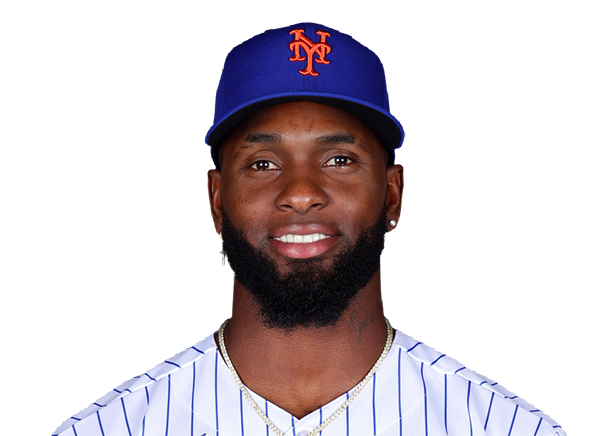 Luis Robert Jr. | 0-0 | 0 | 0 | 0 | 0 | 0 | 0 | 0 | 0 | .216 | .292 | .353 |
Washington Nationals
| Player | IP | H | R | ER | BB | K | HR | PC-ST | ERA | PC |
|---|---|---|---|---|---|---|---|---|---|---|
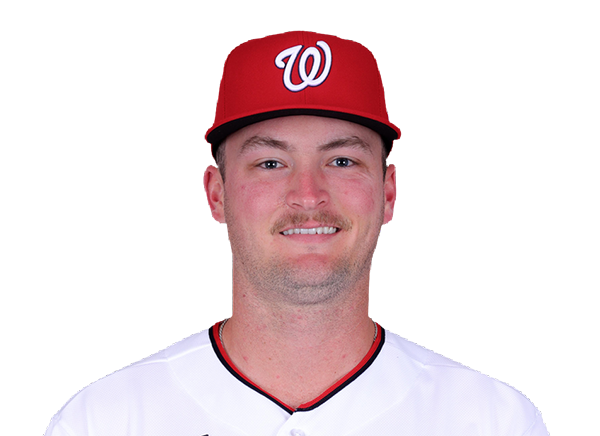 Brad Lord | 0.2 | 1 | 2 | 2 | 4 | 1 | 0 | 44-21 | 4.04 | 44 |
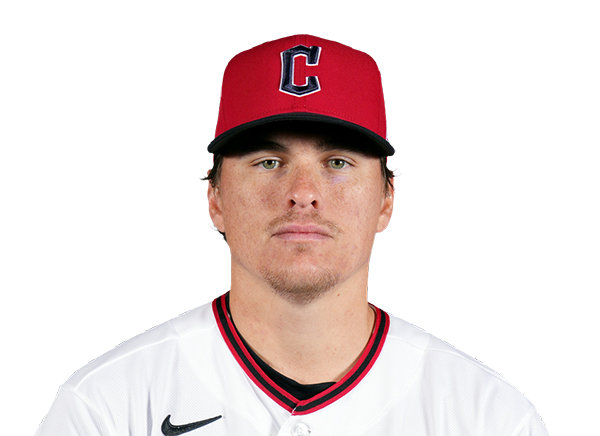 Will Dion | 4.1 | 0 | 0 | 0 | 1 | 7 | 0 | 64-41 | 3.25 | 64 |
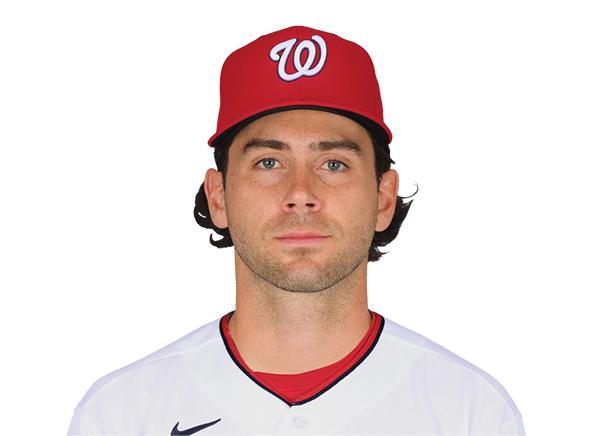 Tom Cosgrove | 1.0 | 2 | 1 | 1 | 0 | 1 | 1 | 9-7 | 3.75 | 9 |
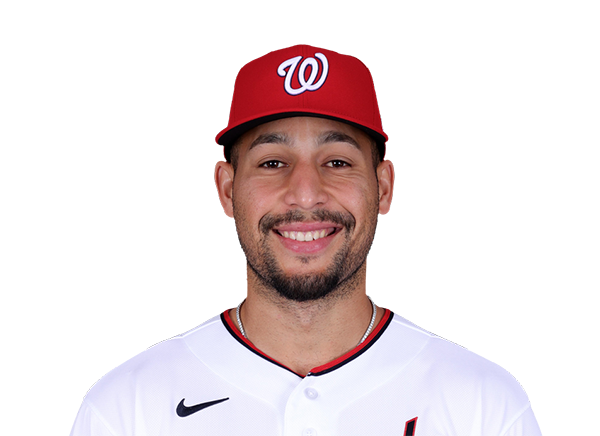 Orlando Ribalta | 1.0 | 0 | 0 | 0 | 0 | 1 | 0 | 17-9 | 3.41 | 17 |
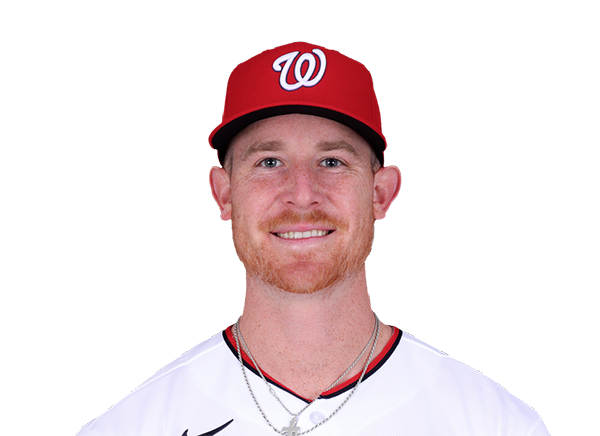 Clayton Beeter | 1.0 | 2 | 0 | 0 | 1 | 1 | 0 | 19-11 | 3.55 | 19 |
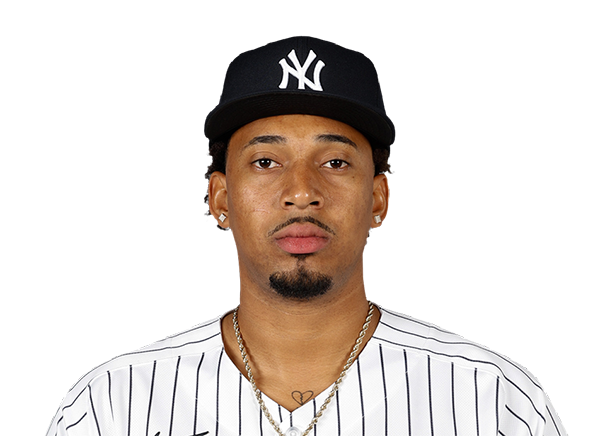 Yovanny Cruz | 0.1 | 3 | 2 | 2 | 1 | 1 | 0 | 23-13 | 6.48 | 23 |
New York Mets
| Player | IP | H | R | ER | BB | K | HR | PC-ST | ERA | PC |
|---|---|---|---|---|---|---|---|---|---|---|
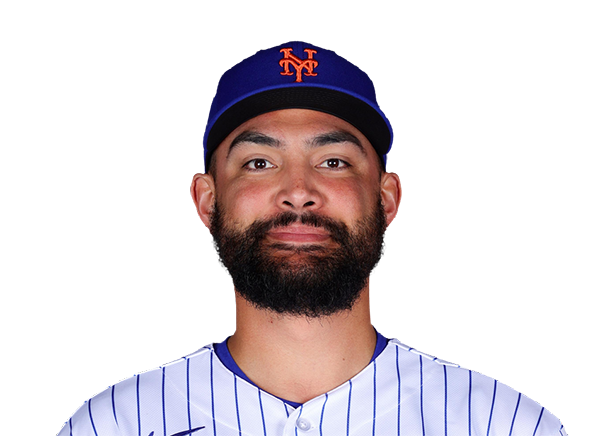 Sean Manaea | 6.1 | 6 | 4 | 4 | 2 | 7 | 2 | 93-64 | 4.22 | 93 |
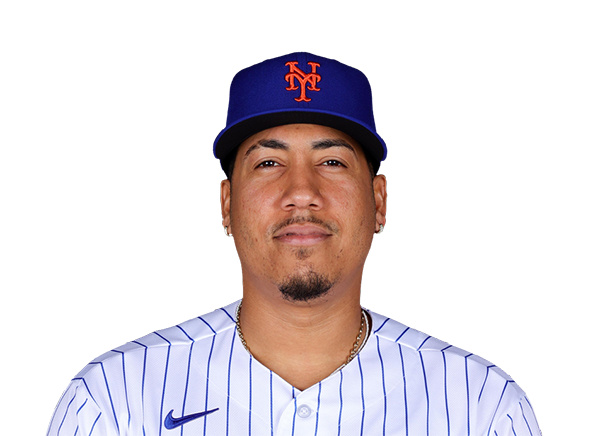 Dedniel Nunez | 1.0 | 1 | 0 | 0 | 0 | 1 | 0 | 11-7 | 13.50 | 11 |
 Jefry Yan | 1.2 | 0 | 0 | 0 | 0 | 3 | 0 | 22-14 | 1.80 | 22 |
H2H / Season Series
NYM4–3
WSH
NYM5–4
WSH
NYM4–1
WSH
WSH1–2
NYM
WSH8–4
NYM
WSH9–6
NYM
WSH7–16
NYM
NYM4–5
WSH
NYM2–14
WSH
NYM8–0
WSH
Last 5 Games
| Date | Opponent | Result |
|---|---|---|
| Aug 22 |  @ MIA | L2–4 |
| Aug 21 | @ MIA | L2–3 |
| Aug 20 |  @ TEX | L0–2 |
| Aug 19 | @ TEX | W6–0 |
| Aug 18 | @ TEX | L0–5 |
| Date | Opponent | Result |
|---|---|---|
| Aug 22 |  @ CHW | W10–5 |
| Aug 21 | @ CHW | L4–6 |
| Aug 19 |  vs SD | W4–2 |
| Aug 18 | vs SD | L2–5 |
| Aug 17 | vs SD | W2–1 |
Standings
American League
| Team | W | L | PCT | GB | DIFF | STRK |
|---|---|---|---|---|---|---|
1 Rays | 76 | 52 | .594 | - | +43 | L2 |
| 2White Sox | 67 | 61 | .523 | 9 | +47 | W1 |
3 Astros | 65 | 64 | .504 | 11.5 | -42 | W1 |
4 Yankees | 73 | 56 | .566 | 3.5 | +95 | L1 |
5 Red Sox | 69 | 59 | .539 | 7 | +97 | W1 |
| 6Rangers | 64 | 66 | .492 | 13 | -48 | L1 |
7 Blue Jays | 64 | 67 | .489 | 13.5 | -50 | W1 |
8 Twins | 63 | 66 | .488 | 13.5 | -45 | L1 |
9 Guardians | 63 | 66 | .488 | 13.5 | -15 | W2 |
10 Orioles | 62 | 67 | .481 | 14.5 | -34 | W1 |
11 Tigers | 61 | 68 | .473 | 15.5 | +77 | L4 |
12 Mariners | 61 | 68 | .473 | 15.5 | -45 | W1 |
13 Royals | 57 | 74 | .435 | 20.5 | -95 | W7 |
14 Angels | 52 | 78 | .400 | 25 | -68 | W1 |
15 Athletics | 49 | 80 | .380 | 27.5 | -189 | L5 |
National League
| Team | W | L | PCT | GB | DIFF | STRK |
|---|---|---|---|---|---|---|
1 Brewers | 81 | 49 | .623 | - | +163 | W3 |
2 Dodgers | 78 | 51 | .605 | 2.5 | +146 | W4 |
3 Braves | 75 | 55 | .577 | 6 | +108 | L2 |
4 Cubs | 74 | 55 | .574 | 6.5 | +99 | L2 |
5 Phillies | 72 | 58 | .554 | 9 | +25 | W8 |
| 6Padres | 69 | 60 | .535 | 11.5 | +7 | W1 |
7 Diamondbacks | 68 | 61 | .527 | 12.5 | +13 | W2 |
| 8Marlins | 66 | 64 | .508 | 15 | +17 | W2 |
9 Cardinals | 66 | 65 | .504 | 15.5 | 0 | L2 |
10 Pirates | 63 | 67 | .485 | 18 | +30 | L1 |
11 Reds | 61 | 68 | .473 | 19.5 | -98 | L2 |
| 12Nationals | 61 | 70 | .466 | 20.5 | +14 | L3 |
| 13Mets | 58 | 71 | .450 | 22.5 | -44 | L1 |
14 Giants | 52 | 76 | .406 | 28 | -78 | L2 |
15 Rockies | 50 | 78 | .391 | 30 | -130 | L4 |
WSH
VS
NYM
Pitchers
Brad Lord
Will Dion
Tom Cosgrove
Orlando Ribalta
Clayton Beeter
Yovanny Cruz
Catchers
Harry Ford
Infielders
Andres Chaparro
Abimelec Ortiz
Brady House
CJ Abrams
Nasim Nunez
Outfielders
Dylan Crews
Jacob Young
Andrew Pinckney
Designated Hitters
Daylen Lile
Pitchers
Sean Manaea
Dedniel Nunez
Jefry Yan
Catchers
Francisco Alvarez
Infielders
Francisco Lindor
Bo Bichette
Jared Young
Marcus Semien
Outfielders
A.J. Ewing
Carson Benge
Brett Baty
Designated Hitters
Jorge Polanco
Other Players
Cristian Pache
Luis Robert Jr.
Nationals
VS
Mets
Batting
124
Team Games Played
123
4254
At Bats
4139
1071
Hits
973
634
Runs Batted In
491
177
Home Runs
150
135
Stolen Bases
63
.252
Batting Average
.235
663
Runs
514
213
Doubles
153
25
Triples
16
1865
Total Bases
1608
434
Walks
395
1031
Strikeouts
1045
.328
On Base Percentage
.306
.438
Slugging Percentage
.388
.766
OBP Pct + SLG Pct
.695
124
Games Played
123
124
Games Started
123
61
Hit By Pitch
42
0.0
Wins Above Replacement
0.0
0.0
Offensive Wins Above Replacement
0.0
29
Caught Stealing
25
1
Is Qualified
1
631.3
Runs Created
495.5
5.1
Runs Created Per 27 Outs
4.0
.091
Walks Per Plate Appearance
.085
0.42
Walk To Strikeout Ratio
0.38
.187
Isolated Power
.153
.314
Secondary Average
.258
3.81
Pitches Per Plate Appearance
3.93
415
Extra Base Hits
319
4795
Plate Appearances
4626
24.0
At Bats Per Home Run
27.6
14
Sacrifice Hit
16
29
Sacrifice Flies
30
Pitching
124
Team Games Played
123
28
Quality Starts
35
60
Wins
54
64
Losses
69
33
Saves
22
63
Holds
50
1098
Hits
991
580
Earned runs
499
174
Home Runs
132
433
Walks
438
941
Strikeouts
1104
7.7
Strikeouts Per 9 Innings
9.1
151.1
Pitches Per Start
149.2
1.38
Walks Plus Hits Per Inning Pitched
1.31
4.72
Earned Run Average
4.10
64
Losses
69
1105.2
Innings pitched
1094.2
.484
Win Percentage
.439
64
Save Opportunities
36
.258
Opponent Batting Average
.238
.332
Opponent's On-base pct.
.318
.431
Opponent's Slugging pct.
.393
.763
Opponent's OPB Pct + SLG Pct
.712
4259
At Bats
4156
200
Doubles
212
8
Triples
18
65
Batters Hit
60
89
Stolen Bases
56
124
Games Played
123
0
Complete Games
0
4
Shutouts
5
44
Wild Pitches
31
621
Runs Batted In
532
1
Balks
3
1105.2
Innings pitched
1094.2
7.7
Strikeouts Per 9 Innings
9.1
27
Caught Stealing
26
124
Games Started
123
0.0
Wins Above Replacement
0.0
1
Is Qualified
1
643
Runs
558
580
Earned Runs
499
1836
Total Bases
1635
Fielding
124
Team Games Played
123
1106
Full Innings
1095
4554
Total Chances
4338
3317
Putouts
3284
1148
Assists
974
89
Errors
80
213
Double Plays
153
0.980
Fielding Percentage
0.982
36.3
Range Factor
35.0
0.0
Zone Rating
0.0
124
Games Played
123
0
Games Started
0
0.0
Defensive Wins Above Replacement
0.0
1
Qualified
1