

Nationals vs Padres Live Score (7 Sep, 2026)
Game Information
Stage
STD
Season
2026
First Pitch
Mon, Sep 7, 5:10 pm
Venue
Petco Park
Location
San Diego, California
Venue Type
Outdoor
Broadcast
MLB.TV
Attendance
38,149
Live Situation
0Balls
0Strikes
0Outs
—Pitcher
—At Bat
Pitch Sequence
1
BALL IN PLAY
Slider
88 MPH
Injury Report

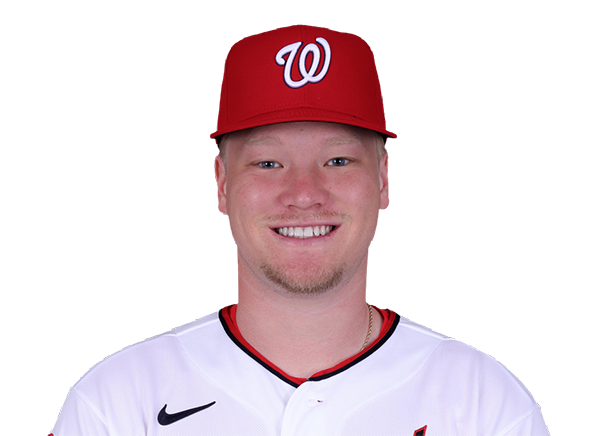
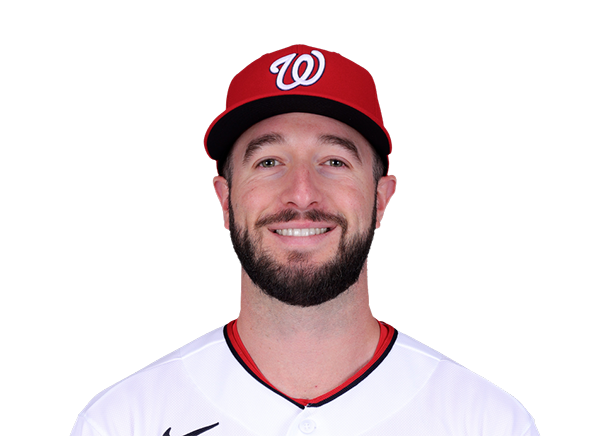
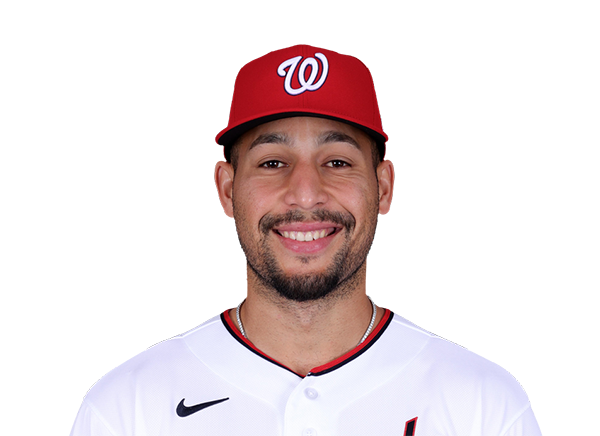
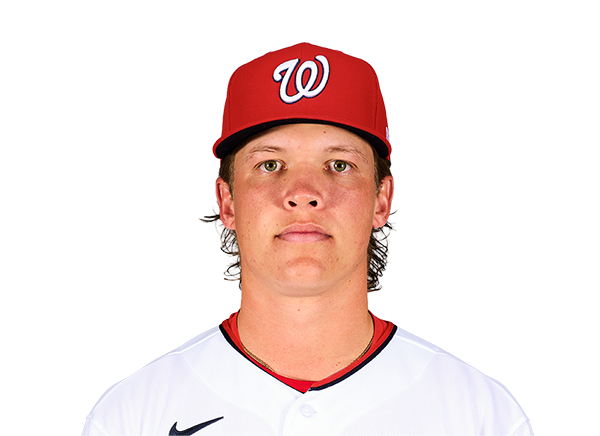




Team Stats
 WSH
SD


2
Runs
3
5
Hits
9
0
Errors
0
1
Home Runs
0
0
Walks
3
8
Strikeouts
4
Player Box Score
Washington Nationals
| Player | H-AB | AB | R | H | RBI | HR | BB | K | #P | AVG | OBP | SLG |
|---|---|---|---|---|---|---|---|---|---|---|---|---|
 James Wood | 1-4 | 4 | 0 | 1 | 0 | 0 | 0 | 0 | 12 | .268 | .394 | .533 |
 Abimelec Ortiz | 1-4 | 4 | 1 | 1 | 0 | 0 | 0 | 1 | 16 | .202 | .239 | .375 |
 Dylan Crews | 2-4 | 4 | 1 | 2 | 2 | 1 | 0 | 0 | 15 | .220 | .290 | .371 |
 CJ Abrams | 0-4 | 4 | 0 | 0 | 0 | 0 | 0 | 1 | 20 | .262 | .340 | .496 |
 Brady House | 0-4 | 4 | 0 | 0 | 0 | 0 | 0 | 2 | 14 | .243 | .302 | .400 |
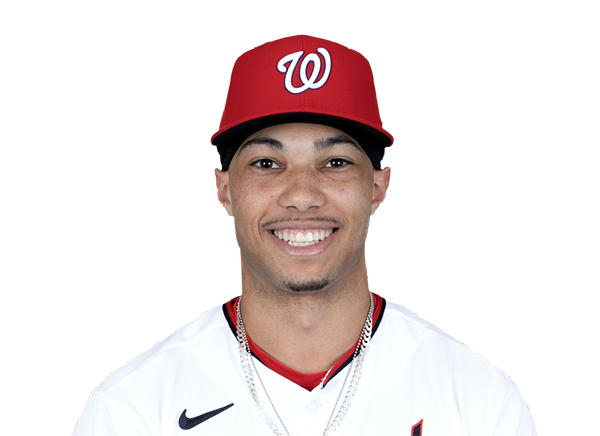 Daylen Lile | 0-3 | 3 | 0 | 0 | 0 | 0 | 0 | 2 | 15 | .255 | .308 | .440 |
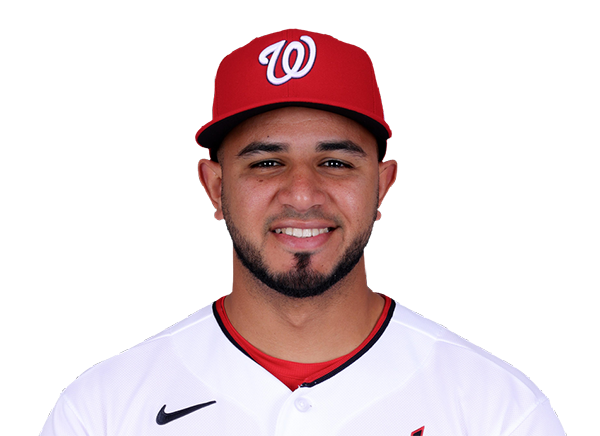 Keibert Ruiz | 0-3 | 3 | 0 | 0 | 0 | 0 | 0 | 0 | 9 | .283 | .321 | .450 |
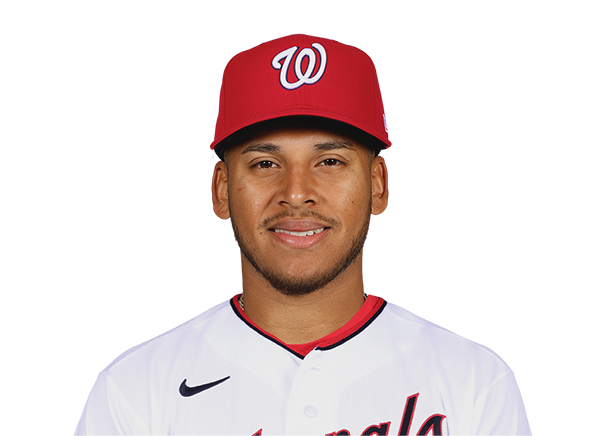 Jorbit Vivas | 1-2 | 2 | 0 | 1 | 0 | 0 | 0 | 0 | 5 | .239 | .334 | .324 |
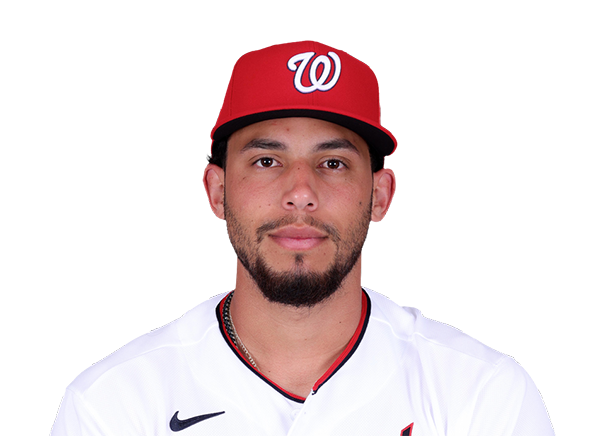 Yohandy Morales | 0-1 | 1 | 0 | 0 | 0 | 0 | 0 | 1 | 3 | .417 | .417 | .833 |
 Nasim Nunez | 0-0 | 0 | 0 | 0 | 0 | 0 | 0 | 0 | 0 | .211 | .289 | .245 |
 Jacob Young | 0-3 | 3 | 0 | 0 | 0 | 0 | 0 | 1 | 13 | .249 | .319 | .392 |
San Diego Padres
| Player | H-AB | AB | R | H | RBI | HR | BB | K | #P | AVG | OBP | SLG |
|---|---|---|---|---|---|---|---|---|---|---|---|---|
 Fernando Tatis Jr. | 3-4 | 4 | 1 | 3 | 0 | 0 | 0 | 1 | 17 | .283 | .349 | .450 |
 Jake Cronenworth | 0-4 | 4 | 0 | 0 | 0 | 0 | 0 | 1 | 14 | .210 | .295 | .292 |
 Manny Machado | 2-4 | 4 | 2 | 2 | 1 | 0 | 0 | 0 | 18 | .224 | .312 | .416 |
 Ty France | 0-3 | 3 | 0 | 0 | 0 | 0 | 1 | 0 | 18 | .288 | .359 | .507 |
 Jackson Merrill | 3-4 | 4 | 0 | 3 | 2 | 0 | 0 | 0 | 12 | .241 | .293 | .415 |
 Luis Campusano | 0-3 | 3 | 0 | 0 | 0 | 0 | 0 | 1 | 17 | .280 | .383 | .470 |
 Dustin Harris | 0-3 | 3 | 0 | 0 | 0 | 0 | 0 | 0 | 9 | .279 | .351 | .338 |
 Jase Bowen | 0-0 | 0 | 0 | 0 | 0 | 0 | 1 | 0 | 6 | .167 | .213 | .286 |
 Xander Bogaerts | 1-3 | 3 | 0 | 1 | 0 | 0 | 1 | 1 | 13 | .219 | .319 | .320 |
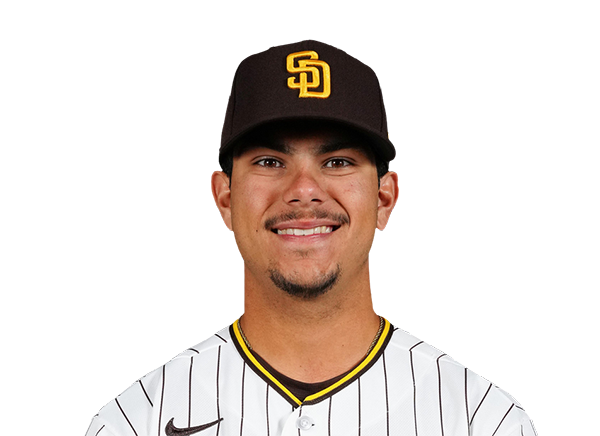 Ethan Salas | 0-2 | 2 | 0 | 0 | 0 | 0 | 0 | 0 | 3 | .000 | .000 | .000 |
 Austin Hays | 0-1 | 1 | 0 | 0 | 0 | 0 | 0 | 0 | 8 | .222 | .250 | .321 |
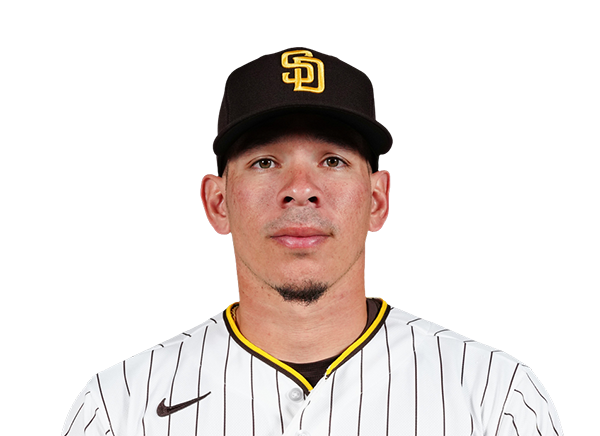 Freddy Fermin | 0-0 | 0 | 0 | 0 | 0 | 0 | 0 | 0 | 0 | .192 | .263 | .300 |
Washington Nationals
| Player | IP | H | R | ER | BB | K | HR | PC-ST | ERA | PC |
|---|---|---|---|---|---|---|---|---|---|---|
 Jake Irvin | 5.2 | 8 | 3 | 3 | 2 | 3 | 0 | 102-60 | 5.52 | 102 |
 Jared Simpson | 1.0 | 0 | 0 | 0 | 0 | 1 | 0 | 15-10 | 0.00 | 15 |
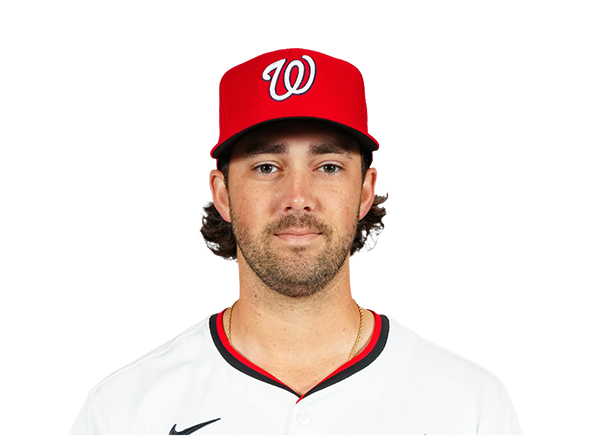 Jack Sinclair | 1.1 | 1 | 0 | 0 | 1 | 0 | 0 | 18-9 | 0.00 | 18 |
San Diego Padres
| Player | IP | H | R | ER | BB | K | HR | PC-ST | ERA | PC |
|---|---|---|---|---|---|---|---|---|---|---|
 Nick Pivetta | 5.0 | 2 | 0 | 0 | 0 | 2 | 0 | 63-39 | 3.43 | 63 |
 Kyle Hart | 1.0 | 2 | 2 | 2 | 0 | 1 | 1 | 23-14 | 4.12 | 23 |
 Bradgley Rodriguez | 1.0 | 0 | 0 | 0 | 0 | 2 | 0 | 12-9 | 1.93 | 12 |
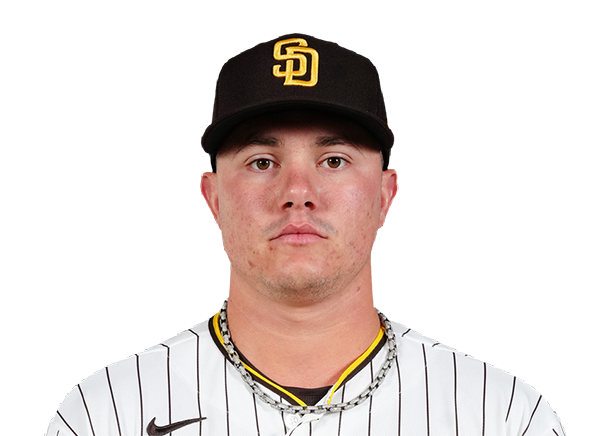 Adrian Morejon | 1.0 | 0 | 0 | 0 | 0 | 1 | 0 | 9-7 | 2.90 | 9 |
 Mason Miller | 1.0 | 1 | 0 | 0 | 0 | 2 | 0 | 15-12 | 1.17 | 15 |
H2H / Season Series
SD3–2
WSH
WSH4–2
SD
WSH9–4
SD
WSH5–7
SD
Last 5 Games
| Date | Opponent | Result |
|---|---|---|
| Sep 7 | @ SD | L2–3 |
| Sep 6 |  @ LAD | L5–7 |
| Sep 5 | @ LAD | L5–6 |
| Sep 4 | @ LAD | L3–5 |
| Sep 2 |  vs ATL | L0–9 |
| Date | Opponent | Result |
|---|---|---|
| Sep 7 | vs WSH | W3–2 |
| Sep 6 |  vs NYY | W4–3 |
| Sep 5 | vs NYY | L1–5 |
| Sep 4 | vs NYY | W3–2 |
| Sep 2 |  @ CIN | L3–7 |
Standings
American League
| Team | W | L | PCT | GB | DIFF | STRK |
|---|---|---|---|---|---|---|
1 Rays | 85 | 58 | .594 | - | +47 | L1 |
2 White Sox | 75 | 68 | .524 | 10 | +49 | W1 |
3 Astros | 73 | 71 | .507 | 12.5 | -38 | L2 |
| 4Yankees | 81 | 62 | .566 | 4 | +117 | L1 |
5 Red Sox | 80 | 65 | .552 | 6 | +89 | W5 |
6 Guardians | 73 | 72 | .503 | 13 | -16 | L1 |
7 Blue Jays | 72 | 73 | .497 | 14 | -39 | L2 |
8 Rangers | 71 | 73 | .493 | 14.5 | -44 | W1 |
9 Orioles | 70 | 75 | .483 | 16 | -27 | W1 |
10 Twins | 68 | 76 | .472 | 17.5 | -49 | L2 |
11 Mariners | 67 | 77 | .465 | 18.5 | -71 | W1 |
12 Tigers | 66 | 78 | .458 | 19.5 | +51 | W1 |
13 Royals | 64 | 81 | .441 | 22 | -89 | L1 |
14 Athletics | 58 | 87 | .400 | 28 | -187 | W1 |
15 Angels | 54 | 90 | .375 | 31.5 | -80 | L2 |
National League
| Team | W | L | PCT | GB | DIFF | STRK |
|---|---|---|---|---|---|---|
1 Brewers | 89 | 56 | .614 | - | +169 | W1 |
| 2Dodgers | 87 | 57 | .604 | 1.5 | +155 | W5 |
| 3Braves | 85 | 59 | .590 | 3.5 | +119 | L1 |
4 Phillies | 81 | 63 | .563 | 7.5 | +35 | W1 |
5 Cubs | 81 | 64 | .559 | 8 | +131 | L2 |
6 Diamondbacks | 77 | 68 | .531 | 12 | 0 | W3 |
| 7Padres | 76 | 68 | .528 | 12.5 | +9 | W2 |
8 Marlins | 72 | 73 | .497 | 17 | +10 | L1 |
9 Cardinals | 72 | 73 | .497 | 17 | -10 | L1 |
10 Pirates | 71 | 73 | .493 | 17.5 | +26 | W1 |
| 11Reds | 69 | 75 | .479 | 19.5 | -108 | L1 |
| 12Nationals | 67 | 79 | .459 | 22.5 | +8 | L5 |
13 Mets | 66 | 78 | .458 | 22.5 | -43 | W2 |
14 Giants | 60 | 85 | .414 | 29 | -74 | W1 |
15 Rockies | 55 | 88 | .385 | 33 | -140 | L1 |
WSH
VS
SD
Pitchers
Jake Irvin
Catchers
Keibert Ruiz
Infielders
Abimelec Ortiz
CJ Abrams
Brady House
Jorbit Vivas
Outfielders
James Wood
Dylan Crews
Jacob Young
Designated Hitters
Daylen Lile
Pitchers
Nick Pivetta
Catchers
Ethan Salas
Infielders
Jake Cronenworth
Manny Machado
Ty France
Xander Bogaerts
Outfielders
Fernando Tatis Jr.
Jackson Merrill
Dustin Harris
Designated Hitters
Luis Campusano
Nationals
VS
Padres
Batting
146
Team Games Played
144
4980
At Bats
4739
1236
Hits
1120
711
Runs Batted In
583
195
Home Runs
159
156
Stolen Bases
142
.248
Batting Average
.236
750
Runs
605
253
Doubles
206
29
Triples
14
2132
Total Bases
1831
509
Walks
497
1221
Strikeouts
1164
.324
On Base Percentage
.314
.428
Slugging Percentage
.386
.752
OBP Pct + SLG Pct
.700
146
Games Played
144
146
Games Started
144
66
Hit By Pitch
54
0.0
Wins Above Replacement
0.0
0.0
Offensive Wins Above Replacement
0.0
36
Caught Stealing
40
1
Is Qualified
1
715.8
Runs Created
586.3
4.9
Runs Created Per 27 Outs
4.1
.091
Walks Per Plate Appearance
.093
0.42
Walk To Strikeout Ratio
0.43
.180
Isolated Power
.150
.306
Secondary Average
.276
3.82
Pitches Per Plate Appearance
3.92
477
Extra Base Hits
379
5609
Plate Appearances
5353
25.5
At Bats Per Home Run
29.8
18
Sacrifice Hit
22
33
Sacrifice Flies
38
Pitching
146
Team Games Played
144
33
Quality Starts
33
67
Wins
76
79
Losses
68
34
Saves
42
71
Holds
90
1268
Hits
1151
678
Earned runs
552
197
Home Runs
157
532
Walks
489
1137
Strikeouts
1170
7.9
Strikeouts Per 9 Innings
8.3
150.7
Pitches Per Start
146.8
1.39
Walks Plus Hits Per Inning Pitched
1.29
4.72
Earned Run Average
3.90
79
Losses
68
1294.0
Innings pitched
1275.1
.459
Win Percentage
.528
71
Save Opportunities
60
.255
Opponent Batting Average
.241
.334
Opponent's On-base pct.
.317
.425
Opponent's Slugging pct.
.388
.758
Opponent's OPB Pct + SLG Pct
.705
4968
At Bats
4782
229
Doubles
202
11
Triples
16
76
Batters Hit
59
109
Stolen Bases
92
146
Games Played
144
0
Complete Games
0
5
Shutouts
11
52
Wild Pitches
38
713
Runs Batted In
574
1
Balks
4
1294.0
Innings pitched
1275.1
7.9
Strikeouts Per 9 Innings
8.3
31
Caught Stealing
48
146
Games Started
144
0.0
Wins Above Replacement
0.0
1
Is Qualified
1
742
Runs
596
678
Earned Runs
552
2110
Total Bases
1856
Fielding
146
Team Games Played
144
1294
Full Innings
1275
5295
Total Chances
5160
3882
Putouts
3826
1318
Assists
1273
95
Errors
61
253
Double Plays
206
0.982
Fielding Percentage
0.988
36.2
Range Factor
36.0
0.0
Zone Rating
0.0
146
Games Played
144
0
Games Started
0
0.0
Defensive Wins Above Replacement
0.0
1
Qualified
1