

Nationals vs Rockies Live Score (21 Jul, 2026)
Game Information
Stage
Standard
Season
2026
First Pitch
Mon, Jul 20, 8:40 pm
Venue
Coors Field
Location
Denver, Colorado
Attendance
20,050
Live Situation
1Balls
0Strikes
0Outs
—Pitcher
—At Bat
Pitch Sequence
1
BALL
Sweeper
73 MPH
2
BALL IN PLAY
Sweeper
72 MPH
Injury Report


Team Stats
 WSH
COL


7
Runs
3
12
Hits
6
2
Errors
0
3
Home Runs
0
2
Walks
5
7
Strikeouts
3
Player Box Score
Washington Nationals
| Player | H-AB | AB | R | H | RBI | HR | BB | K | #P | AVG | OBP | SLG |
|---|---|---|---|---|---|---|---|---|---|---|---|---|
 James Wood | 1-4 | 4 | 2 | 1 | 0 | 0 | 1 | 0 | 16 | .271 | .401 | .553 |
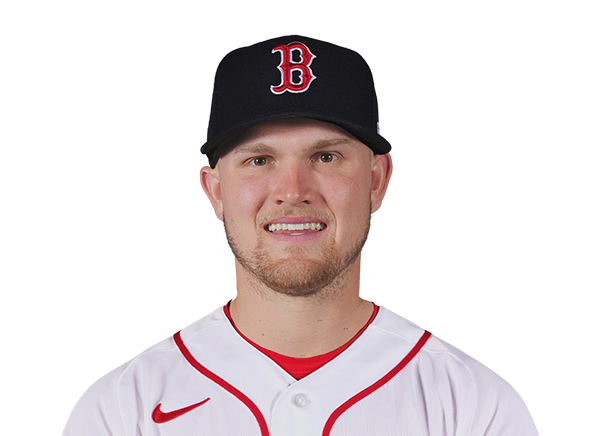 Curtis Mead | 3-5 | 5 | 1 | 3 | 0 | 0 | 0 | 1 | 24 | .262 | .354 | .516 |
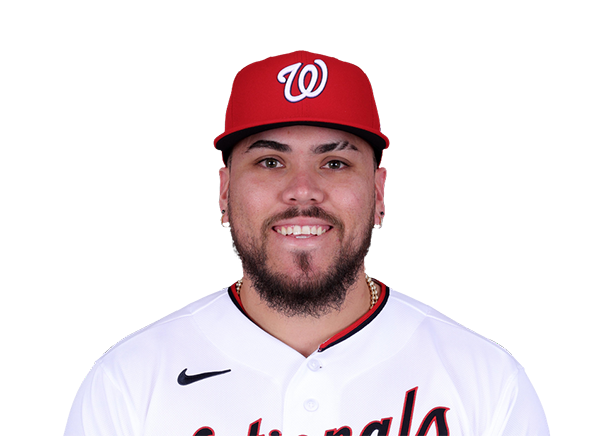 Andres Chaparro | 1-3 | 3 | 1 | 1 | 3 | 1 | 0 | 0 | 8 | .215 | .346 | .446 |
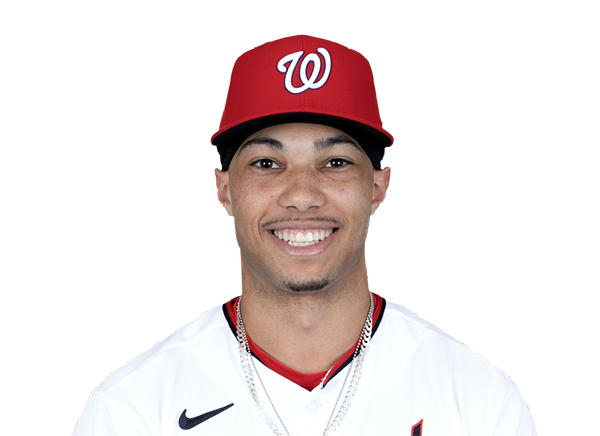 Daylen Lile | 1-2 | 2 | 1 | 1 | 1 | 0 | 0 | 0 | 7 | .247 | .298 | .408 |
 CJ Abrams | 1-5 | 5 | 1 | 1 | 2 | 1 | 0 | 2 | 17 | .275 | .350 | .521 |
 Dylan Crews | 0-3 | 3 | 0 | 0 | 0 | 0 | 1 | 1 | 14 | .206 | .279 | .349 |
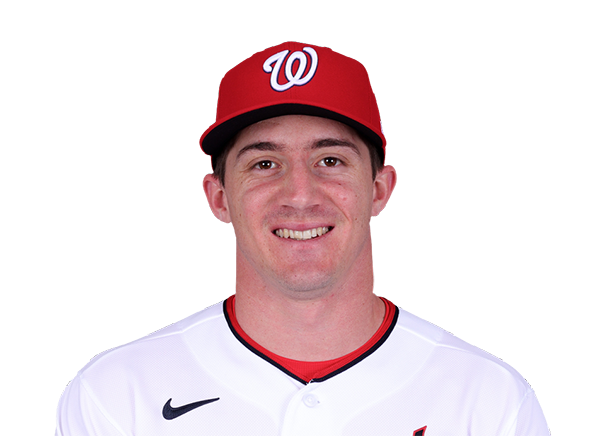 Jacob Young | 3-4 | 4 | 1 | 3 | 1 | 1 | 0 | 0 | 12 | .233 | .289 | .387 |
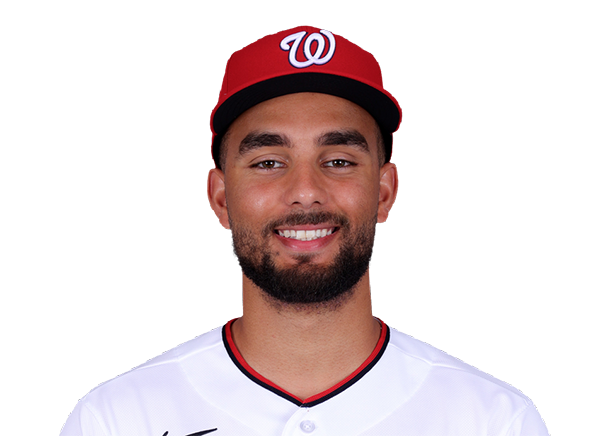 Harry Ford | 0-3 | 3 | 0 | 0 | 0 | 0 | 0 | 2 | 11 | .273 | .385 | .636 |
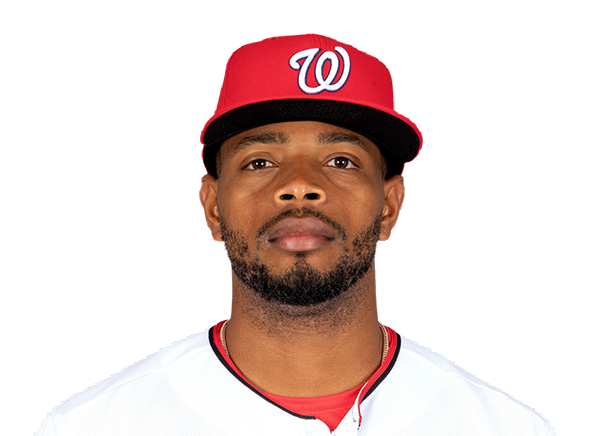 Jose Tena | 0-1 | 1 | 0 | 0 | 0 | 0 | 0 | 0 | 4 | .240 | .307 | .406 |
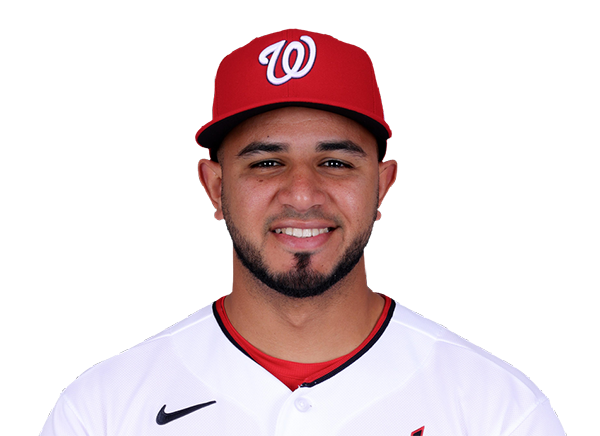 Keibert Ruiz | 0-0 | 0 | 0 | 0 | 0 | 0 | 0 | 0 | 0 | .279 | .306 | .471 |
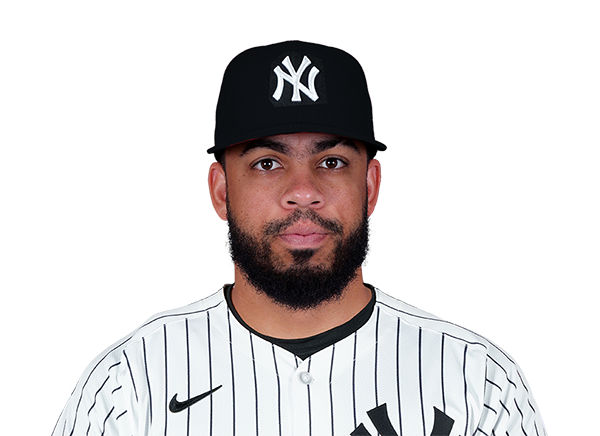 Luis Garcia Jr. | 1-4 | 4 | 0 | 1 | 0 | 0 | 0 | 1 | 9 | .279 | .311 | .542 |
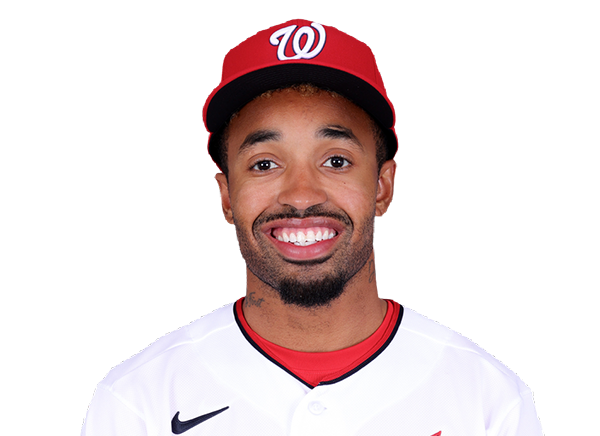 Nasim Nunez | 1-4 | 4 | 0 | 1 | 0 | 0 | 0 | 0 | 18 | .246 | .329 | .293 |
Colorado Rockies
| Player | H-AB | AB | R | H | RBI | HR | BB | K | #P | AVG | OBP | SLG |
|---|---|---|---|---|---|---|---|---|---|---|---|---|
 Jake McCarthy | 2-4 | 4 | 1 | 2 | 0 | 0 | 0 | 0 | 10 | .305 | .350 | .512 |
 Kyle Karros | 1-3 | 3 | 0 | 1 | 0 | 0 | 1 | 1 | 15 | .260 | .355 | .429 |
 Cole Carrigg | 1-4 | 4 | 1 | 1 | 0 | 0 | 0 | 0 | 8 | .287 | .367 | .519 |
 Hunter Goodman | 0-3 | 3 | 0 | 0 | 0 | 0 | 1 | 1 | 14 | .255 | .325 | .556 |
 TJ Rumfield | 0-3 | 3 | 1 | 0 | 0 | 0 | 1 | 1 | 15 | .296 | .379 | .476 |
 Willi Castro | 1-3 | 3 | 0 | 1 | 3 | 0 | 1 | 0 | 11 | .264 | .333 | .399 |
 Braxton Fulford | 0-2 | 2 | 0 | 0 | 0 | 0 | 0 | 0 | 8 | .186 | .265 | .305 |
 Troy Johnston | 0-1 | 1 | 0 | 0 | 0 | 0 | 1 | 0 | 9 | .295 | .367 | .410 |
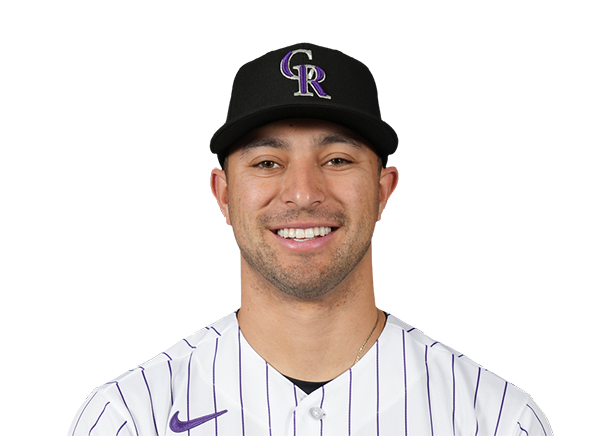 Tyler Freeman | 1-4 | 4 | 0 | 1 | 0 | 0 | 0 | 0 | 12 | .255 | .331 | .329 |
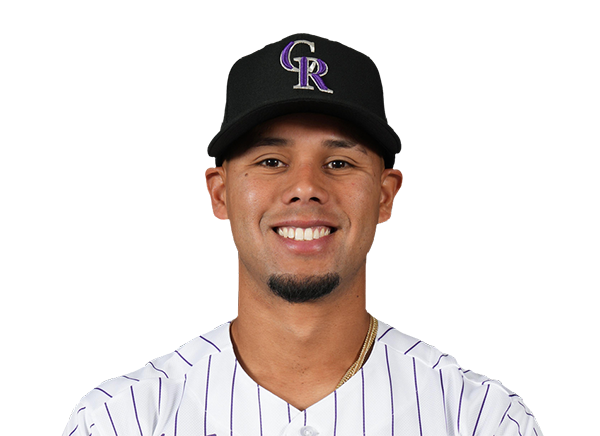 Ezequiel Tovar | 0-3 | 3 | 0 | 0 | 0 | 0 | 0 | 0 | 17 | .198 | .242 | .324 |
 Brett Sullivan | 0-1 | 1 | 0 | 0 | 0 | 0 | 0 | 0 | 2 | .220 | .263 | .394 |
Washington Nationals
| Player | IP | H | R | ER | BB | K | HR | PC-ST | ERA | PC |
|---|---|---|---|---|---|---|---|---|---|---|
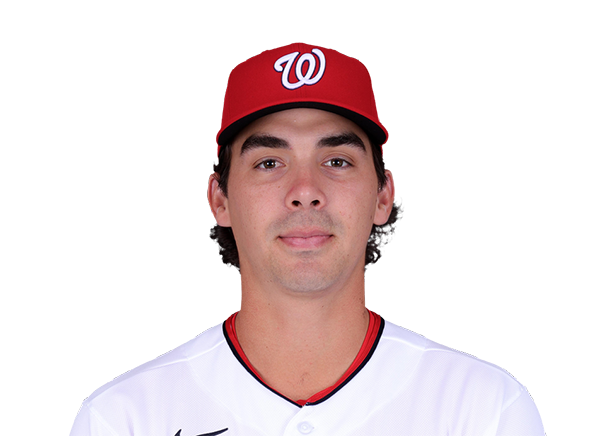 Andrew Alvarez | 4.1 | 6 | 3 | 3 | 3 | 2 | 0 | 74-46 | 4.22 | 74 |
 Riley Cornelio | 1.2 | 0 | 0 | 0 | 2 | 0 | 0 | 29-15 | 6.06 | 29 |
 Matt Krook | 1.0 | 0 | 0 | 0 | 0 | 1 | 0 | 8-6 | 9.82 | 8 |
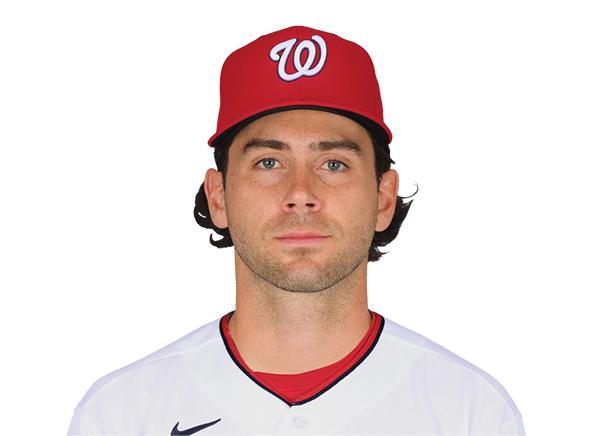 Tom Cosgrove | 2.0 | 0 | 0 | 0 | 0 | 0 | 0 | 10-7 | 0.00 | 10 |
Colorado Rockies
| Player | IP | H | R | ER | BB | K | HR | PC-ST | ERA | PC |
|---|---|---|---|---|---|---|---|---|---|---|
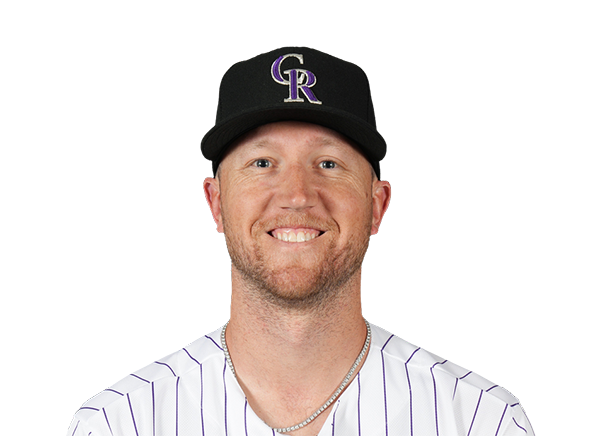 Kyle Freeland | 6.0 | 7 | 4 | 4 | 2 | 4 | 2 | 91-60 | 7.28 | 91 |
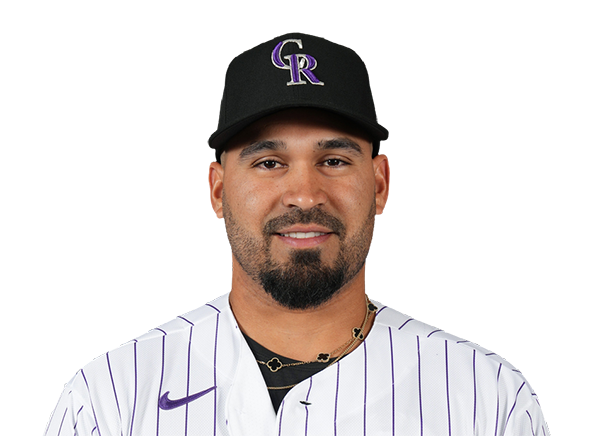 Antonio Senzatela | 1.0 | 2 | 2 | 2 | 0 | 2 | 1 | 19-12 | 3.60 | 19 |
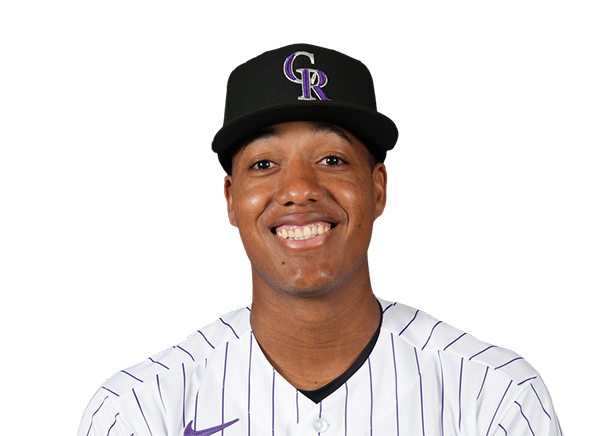 Juan Mejia | 1.0 | 1 | 0 | 0 | 0 | 1 | 0 | 12-8 | 5.52 | 12 |
 Victor Vodnik | 1.0 | 2 | 1 | 1 | 0 | 0 | 0 | 18-13 | 5.64 | 18 |
H2H / Season Series
COL0–8
WSH
COL8–7
WSH
COL3–7
WSH
Last 5 Games
| Date | Opponent | Result |
|---|---|---|
| Aug 23 |  @ MIA | L2–6 |
| Aug 22 | @ MIA | L2–4 |
| Aug 21 | @ MIA | L2–3 |
| Aug 20 |  @ TEX | L0–2 |
| Aug 19 | @ TEX | W6–0 |
| Date | Opponent | Result |
|---|---|---|
| Aug 23 |  vs CLE | L2–7 |
| Aug 22 | vs CLE | L3–4 |
| Aug 21 | vs CLE | L1–9 |
| Aug 19 |  vs LAD | L4–6 |
| Aug 18 | vs LAD | L6–7 |
Standings
American League
| Team | W | L | PCT | GB | DIFF | STRK |
|---|---|---|---|---|---|---|
1 Rays | 77 | 53 | .592 | - | +44 | W1 |
2 White Sox | 68 | 62 | .523 | 9 | +43 | W1 |
3 Astros | 65 | 66 | .496 | 12.5 | -44 | L2 |
4 Yankees | 74 | 56 | .569 | 3 | +100 | W1 |
5 Red Sox | 71 | 59 | .546 | 6 | +99 | W3 |
| 6Rangers | 65 | 66 | .496 | 12.5 | -46 | W1 |
| 7Guardians | 65 | 66 | .496 | 12.5 | -9 | W4 |
8 Blue Jays | 64 | 68 | .485 | 14 | -55 | L1 |
9 Twins | 63 | 68 | .481 | 14.5 | -54 | L3 |
10 Orioles | 63 | 68 | .481 | 14.5 | -35 | L1 |
11 Mariners | 62 | 69 | .473 | 15.5 | -61 | L1 |
12 Tigers | 61 | 69 | .469 | 16 | +73 | L5 |
13 Royals | 58 | 74 | .439 | 20 | -91 | W8 |
14 Angels | 52 | 79 | .397 | 25.5 | -70 | L1 |
15 Athletics | 51 | 80 | .389 | 26.5 | -187 | W2 |
National League
| Team | W | L | PCT | GB | DIFF | STRK |
|---|---|---|---|---|---|---|
1 Brewers | 81 | 50 | .618 | - | +161 | L1 |
| 2Dodgers | 80 | 51 | .611 | 1 | +151 | W6 |
3 Braves | 76 | 55 | .580 | 5 | +110 | W1 |
4 Cubs | 75 | 56 | .573 | 6 | +115 | W1 |
5 Phillies | 73 | 58 | .557 | 8 | +27 | W9 |
6 Padres | 71 | 60 | .542 | 10 | +16 | W3 |
7 Diamondbacks | 69 | 62 | .527 | 12 | +9 | W1 |
| 8Marlins | 67 | 64 | .511 | 14 | +21 | W3 |
9 Cardinals | 66 | 66 | .500 | 15.5 | -2 | L3 |
10 Pirates | 63 | 69 | .477 | 18.5 | +25 | L3 |
11 Reds | 62 | 69 | .473 | 19 | -94 | L1 |
| 12Nationals | 61 | 71 | .462 | 20.5 | +10 | L4 |
13 Mets | 59 | 72 | .450 | 22 | -40 | L1 |
14 Giants | 52 | 78 | .400 | 28.5 | -80 | L4 |
| 15Rockies | 50 | 80 | .385 | 30.5 | -136 | L6 |
WSH
VS
COL
Pitchers
Andrew Alvarez
Riley Cornelio
Matt Krook
Tom Cosgrove
Catchers
Harry Ford
Keibert Ruiz
Infielders
Curtis Mead
CJ Abrams
Luis Garcia Jr.
Nasim Nunez
Outfielders
James Wood
Dylan Crews
Jacob Young
Designated Hitters
Andres Chaparro
Daylen Lile
Other Players
Jose Tena
Pitchers
Kyle Freeland
Antonio Senzatela
Juan Mejia
Victor Vodnik
Catchers
Braxton Fulford
Brett Sullivan
Infielders
Kyle Karros
TJ Rumfield
Willi Castro
Tyler Freeman
Ezequiel Tovar
Outfielders
Jake McCarthy
Cole Carrigg
Troy Johnston
Designated Hitters
Hunter Goodman
Nationals
VS
Rockies
Batting
132
Team Games Played
130
4513
At Bats
4410
1118
Hits
1113
652
Runs Batted In
593
183
Home Runs
144
139
Stolen Bases
88
.248
Batting Average
.252
682
Runs
617
222
Doubles
238
26
Triples
26
1941
Total Bases
1835
455
Walks
409
1101
Strikeouts
1125
.324
On Base Percentage
.322
.430
Slugging Percentage
.416
.754
OBP Pct + SLG Pct
.738
132
Games Played
130
132
Games Started
130
65
Hit By Pitch
63
0.0
Wins Above Replacement
0.0
0.0
Offensive Wins Above Replacement
0.0
31
Caught Stealing
35
1
Is Qualified
1
650.0
Runs Created
601.1
5.0
Runs Created Per 27 Outs
4.7
.090
Walks Per Plate Appearance
.083
0.41
Walk To Strikeout Ratio
0.36
.182
Isolated Power
.164
.307
Secondary Average
.268
3.82
Pitches Per Plate Appearance
3.74
431
Extra Base Hits
408
5080
Plate Appearances
4943
24.7
At Bats Per Home Run
30.6
15
Sacrifice Hit
15
29
Sacrifice Flies
45
Pitching
132
Team Games Played
130
29
Quality Starts
21
61
Wins
50
71
Losses
80
33
Saves
29
67
Holds
50
1158
Hits
1315
609
Earned runs
704
180
Home Runs
180
467
Walks
423
1013
Strikeouts
880
7.8
Strikeouts Per 9 Innings
6.9
150.5
Pitches Per Start
149.3
1.39
Walks Plus Hits Per Inning Pitched
1.52
4.68
Earned Run Average
5.54
71
Losses
80
1171.0
Innings pitched
1143.2
.462
Win Percentage
.385
66
Save Opportunities
49
.257
Opponent Batting Average
.289
.333
Opponent's On-base pct.
.351
.429
Opponent's Slugging pct.
.490
.761
Opponent's OPB Pct + SLG Pct
.841
4504
At Bats
4558
211
Doubles
291
11
Triples
44
67
Batters Hit
51
94
Stolen Bases
102
132
Games Played
130
0
Complete Games
1
5
Shutouts
1
46
Wild Pitches
35
649
Runs Batted In
723
1
Balks
5
1171.0
Innings pitched
1143.2
7.8
Strikeouts Per 9 Innings
6.9
28
Caught Stealing
20
132
Games Started
130
0.0
Wins Above Replacement
0.0
1
Is Qualified
1
672
Runs
753
609
Earned Runs
704
1931
Total Bases
2234
Fielding
132
Team Games Played
130
1171
Full Innings
1144
4802
Total Chances
4623
3513
Putouts
3431
1199
Assists
1108
90
Errors
84
222
Double Plays
238
0.981
Fielding Percentage
0.982
36.2
Range Factor
35.7
0.0
Zone Rating
0.0
132
Games Played
130
0
Games Started
0
0.0
Defensive Wins Above Replacement
0.0
1
Qualified
1