

Nationals vs Tigers Live Score (23 Sep, 2026)
Game Information
Stage
STD
Season
2026
First Pitch
Wed, Sep 23, 1:10 pm
Venue
Comerica Park
Location
Detroit, Michigan
Venue Type
Outdoor
Broadcast
ESPN Unlmtd
Attendance
21,373
Live Situation
2Balls
2Strikes
0Outs
—Pitcher
—At Bat
Pitch Sequence
1
STRIKE LOOKING
Slider
91 MPH
2
BALL
Splitter
89 MPH
3
STRIKE SWINGING
Splitter
86 MPH
4
BALL
Splitter
88 MPH
5
BALL IN PLAY
Slider
91 MPH
Injury Report








Team Stats
 WSH
DET


4
Runs
2
6
Hits
8
0
Errors
0
1
Home Runs
1
4
Walks
6
8
Strikeouts
9
Player Box Score
Washington Nationals
| Player | H-AB | AB | R | H | RBI | HR | BB | K | #P | AVG | OBP | SLG |
|---|---|---|---|---|---|---|---|---|---|---|---|---|
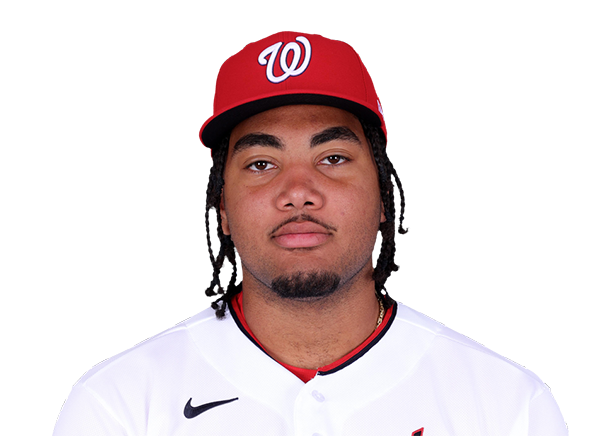 James Wood | 0-4 | 4 | 0 | 0 | 1 | 0 | 0 | 2 | 13 | .262 | .385 | .505 |
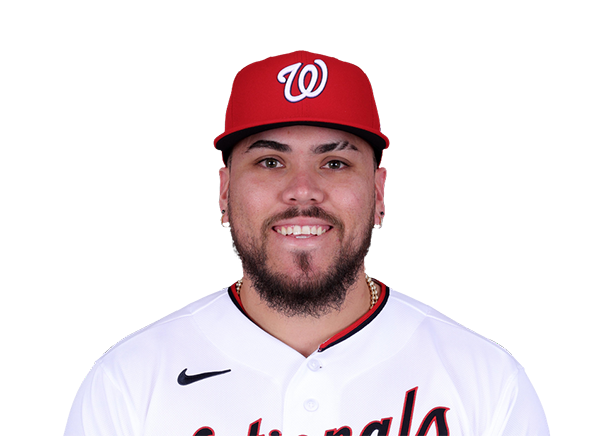 Andres Chaparro | 1-4 | 4 | 1 | 1 | 0 | 0 | 0 | 2 | 17 | .257 | .357 | .497 |
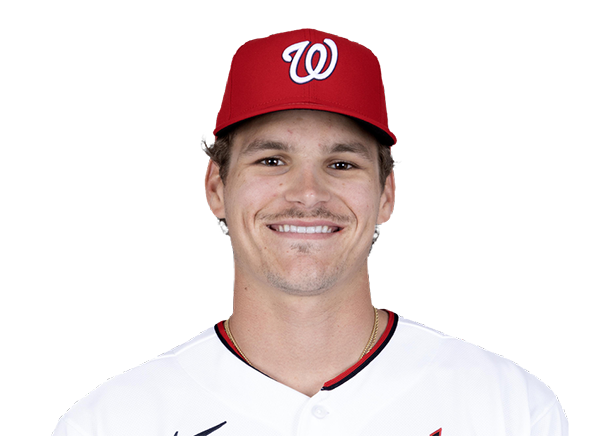 Brady House | 2-4 | 4 | 1 | 2 | 0 | 0 | 0 | 1 | 11 | .244 | .308 | .395 |
 CJ Abrams | 1-2 | 2 | 0 | 1 | 1 | 0 | 2 | 0 | 17 | .262 | .338 | .500 |
 Dylan Crews | 0-4 | 4 | 0 | 0 | 0 | 0 | 0 | 0 | 13 | .223 | .288 | .368 |
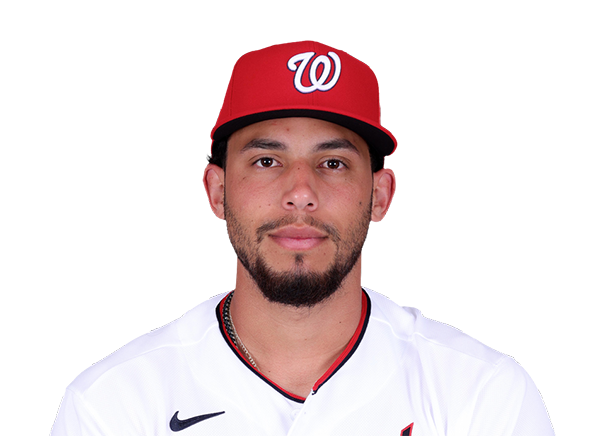 Yohandy Morales | 1-4 | 4 | 1 | 1 | 2 | 1 | 0 | 1 | 18 | .279 | .279 | .651 |
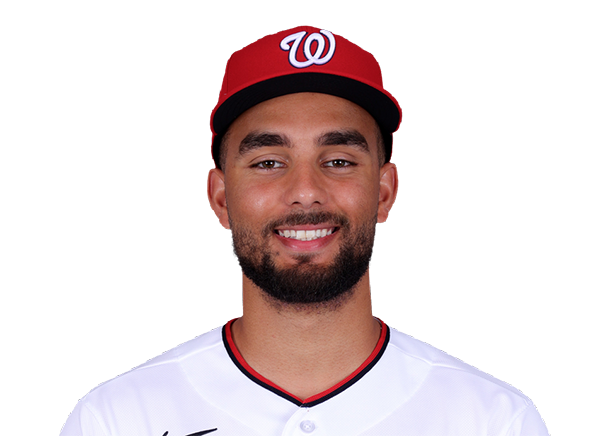 Harry Ford | 0-2 | 2 | 0 | 0 | 0 | 0 | 1 | 1 | 15 | .186 | .307 | .340 |
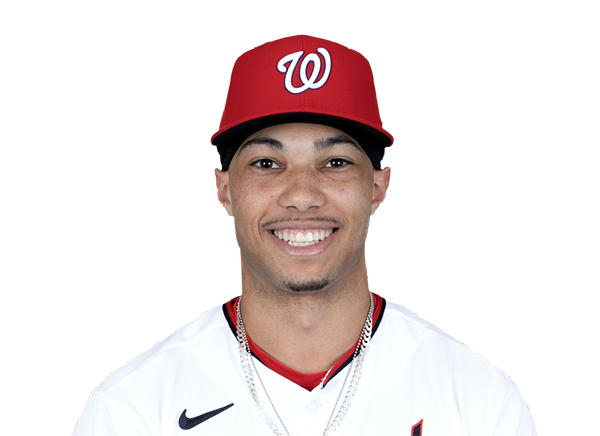 Daylen Lile | 0-1 | 1 | 0 | 0 | 0 | 0 | 0 | 0 | 4 | .247 | .299 | .433 |
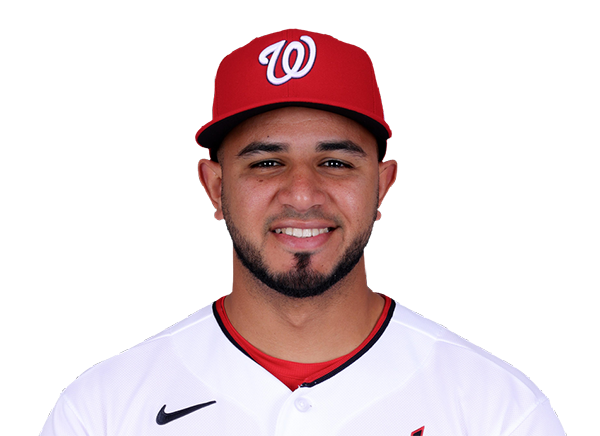 Keibert Ruiz | 0-0 | 0 | 0 | 0 | 0 | 0 | 0 | 0 | 0 | .283 | .320 | .449 |
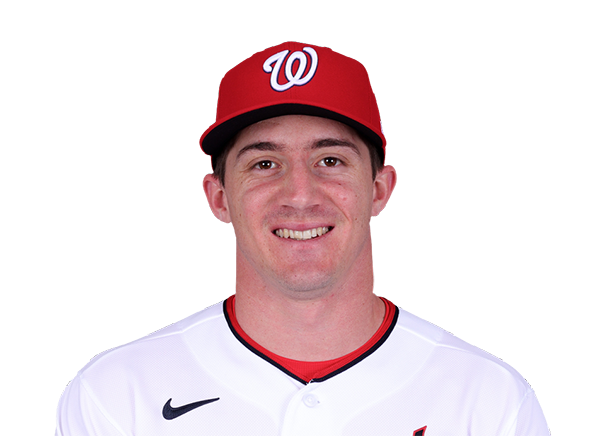 Jacob Young | 0-4 | 4 | 0 | 0 | 0 | 0 | 0 | 1 | 18 | .249 | .317 | .390 |
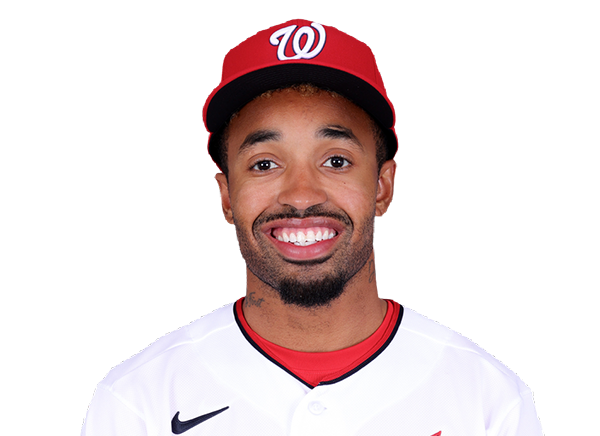 Nasim Nunez | 1-2 | 2 | 1 | 1 | 0 | 0 | 1 | 0 | 11 | .209 | .291 | .242 |
Detroit Tigers
| Player | H-AB | AB | R | H | RBI | HR | BB | K | #P | AVG | OBP | SLG |
|---|---|---|---|---|---|---|---|---|---|---|---|---|
 Kevin McGonigle | 3-5 | 5 | 0 | 3 | 0 | 0 | 0 | 1 | 14 | .278 | .378 | .428 |
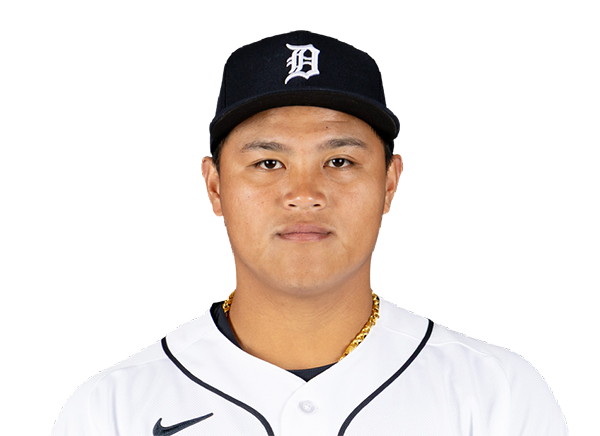 Hao-Yu Lee | 1-5 | 5 | 0 | 1 | 0 | 0 | 0 | 1 | 21 | .267 | .324 | .431 |
 Ben Malgeri | 2-5 | 5 | 1 | 2 | 2 | 1 | 0 | 0 | 7 | .250 | .353 | .422 |
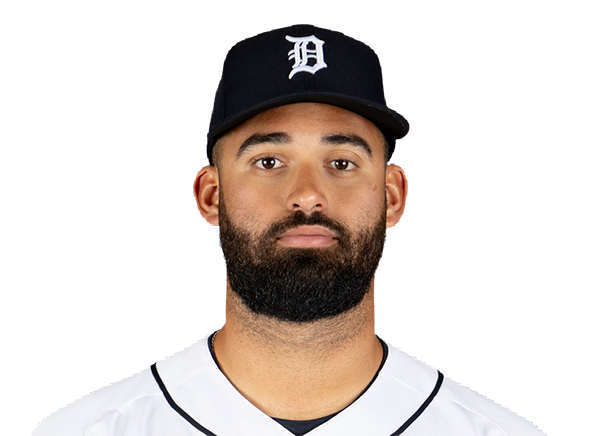 Riley Greene | 0-3 | 3 | 0 | 0 | 0 | 0 | 2 | 0 | 28 | .282 | .371 | .478 |
 Dillon Dingler | 0-3 | 3 | 0 | 0 | 0 | 0 | 1 | 0 | 23 | .244 | .304 | .450 |
 Max Clark | 1-2 | 2 | 0 | 1 | 0 | 0 | 1 | 0 | 17 | .283 | .365 | .440 |
 Spencer Torkelson | 0-4 | 4 | 0 | 0 | 0 | 0 | 0 | 4 | 14 | .228 | .328 | .425 |
 John Peck | 0-2 | 2 | 0 | 0 | 0 | 0 | 1 | 1 | 9 | .164 | .288 | .180 |
 Brett Callahan | 0-1 | 1 | 0 | 0 | 0 | 0 | 0 | 1 | 6 | .212 | .274 | .333 |
 Zach McKinstry | 0-1 | 1 | 0 | 0 | 0 | 0 | 1 | 0 | 12 | .201 | .287 | .296 |
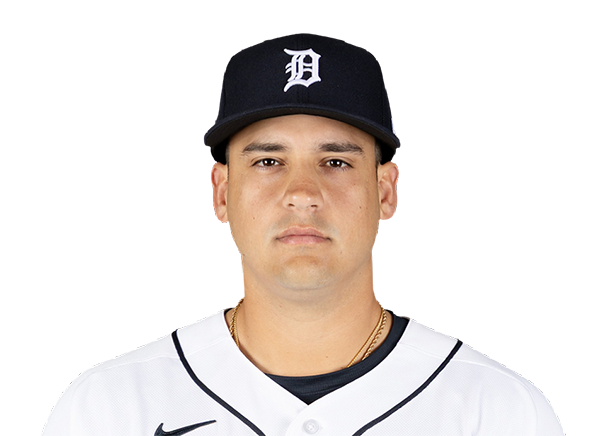 Eduardo Valencia | 0-1 | 1 | 0 | 0 | 0 | 0 | 0 | 1 | 3 | .339 | .366 | .602 |
 Jace Jung | 1-1 | 1 | 1 | 1 | 0 | 0 | 0 | 0 | 1 | .250 | .400 | .250 |
Washington Nationals
| Player | IP | H | R | ER | BB | K | HR | PC-ST | ERA | PC |
|---|---|---|---|---|---|---|---|---|---|---|
 Richard Lovelady | 1.1 | 1 | 0 | 0 | 1 | 0 | 0 | 19-12 | 3.71 | 19 |
 Brad Lord | 3.1 | 1 | 0 | 0 | 2 | 3 | 0 | 49-32 | 3.78 | 49 |
 Will Dion | 2.0 | 3 | 1 | 1 | 1 | 4 | 1 | 41-30 | 3.78 | 41 |
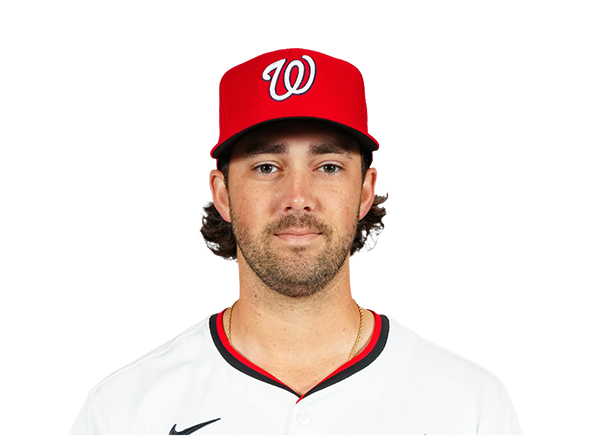 Jack Sinclair | 0.1 | 0 | 0 | 0 | 0 | 0 | 0 | 4-2 | 1.93 | 4 |
|
Erik Tolman | 0.2 | 0 | 0 | 0 | 2 | 0 | 0 | 20-8 | 3.21 | 20 |
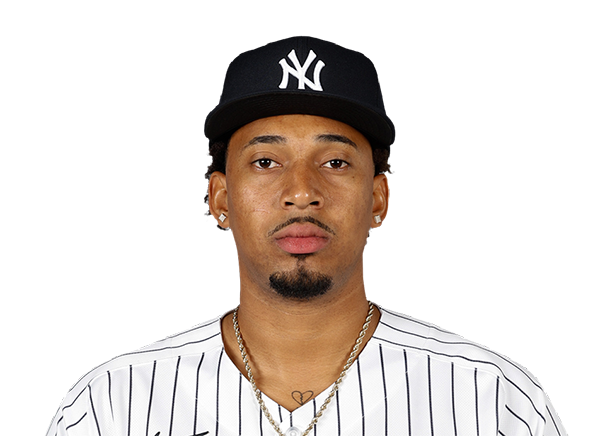 Yovanny Cruz | 1.1 | 3 | 1 | 1 | 0 | 2 | 0 | 22-15 | 5.40 | 22 |
Detroit Tigers
| Player | IP | H | R | ER | BB | K | HR | PC-ST | ERA | PC |
|---|---|---|---|---|---|---|---|---|---|---|
 Framber Valdez | 5.1 | 4 | 2 | 2 | 3 | 6 | 0 | 87-53 | 4.03 | 87 |
 Tyler Kinley | 0.2 | 1 | 1 | 1 | 0 | 0 | 1 | 13-10 | 3.49 | 13 |
 Jacob Waguespack | 2.0 | 1 | 1 | 1 | 1 | 2 | 0 | 28-18 | 2.56 | 28 |
 Kenley Jansen | 1.0 | 0 | 0 | 0 | 0 | 0 | 0 | 9-7 | 3.27 | 9 |
H2H / Season Series
DET2–4
WSH
DET1–3
WSH
DET9–2
WSH
Last 5 Games
| Date | Opponent | Result |
|---|---|---|
| Sep 23 | @ DET | W4–2 |
| Sep 22 | @ DET | W3–1 |
| Sep 21 | @ DET | L2–9 |
| Sep 20 |  @ STL | L3–5 |
| Sep 19 | @ STL | W8–5 |
| Date | Opponent | Result |
|---|---|---|
| Sep 23 | vs WSH | L2–4 |
| Sep 22 | vs WSH | L1–3 |
| Sep 21 | vs WSH | W9–2 |
| Sep 20 |  @ CHW | L1–8 |
| Sep 19 | @ CHW | L1–3 |
Standings
American League
| Team | W | L | PCT | GB | DIFF | STRK |
|---|---|---|---|---|---|---|
1 Rays | 96 | 62 | .608 | - | +79 | L1 |
2 Guardians | 82 | 76 | .519 | 14 | +2 | L1 |
3 Astros | 78 | 79 | .497 | 17.5 | -52 | W1 |
4 Yankees | 91 | 67 | .576 | 5 | +141 | W1 |
5 Red Sox | 85 | 73 | .538 | 11 | +80 | W1 |
| 6White Sox | 81 | 77 | .513 | 15 | +44 | L1 |
7 Rangers | 78 | 80 | .494 | 18 | -42 | L3 |
8 Orioles | 78 | 81 | .491 | 18.5 | -26 | W3 |
9 Blue Jays | 77 | 82 | .484 | 19.5 | -47 | L3 |
10 Twins | 75 | 84 | .472 | 21.5 | -64 | W2 |
| 11Tigers | 74 | 85 | .465 | 22.5 | +71 | L2 |
12 Mariners | 73 | 84 | .465 | 22.5 | -63 | L1 |
13 Royals | 68 | 90 | .430 | 28 | -104 | W1 |
14 Athletics | 62 | 95 | .395 | 33.5 | -221 | W1 |
15 Angels | 60 | 97 | .382 | 35.5 | -89 | L2 |
National League
| Team | W | L | PCT | GB | DIFF | STRK |
|---|---|---|---|---|---|---|
1 Brewers | 99 | 59 | .627 | - | +203 | W1 |
2 Dodgers | 97 | 60 | .618 | 1.5 | +200 | W5 |
3 Braves | 93 | 65 | .589 | 6 | +117 | W1 |
4 Padres | 87 | 70 | .554 | 11.5 | +34 | L1 |
5 Cubs | 87 | 71 | .551 | 12 | +145 | L2 |
6 Phillies | 87 | 71 | .551 | 12 | +28 | L1 |
7 Diamondbacks | 84 | 74 | .532 | 15 | +6 | W4 |
8 Pirates | 80 | 78 | .506 | 19 | +27 | L1 |
9 Marlins | 78 | 80 | .494 | 21 | +4 | W2 |
| 10Cardinals | 77 | 81 | .487 | 22 | -21 | W1 |
| 11Nationals | 75 | 84 | .472 | 24.5 | +9 | W2 |
12 Reds | 73 | 85 | .462 | 26 | -160 | L1 |
13 Mets | 73 | 85 | .462 | 26 | -33 | W2 |
14 Giants | 65 | 94 | .409 | 34.5 | -84 | L2 |
15 Rockies | 57 | 101 | .361 | 42 | -184 | L3 |
WSH
VS
DET
Pitchers
Richard Lovelady
Catchers
Harry Ford
Infielders
Brady House
CJ Abrams
Yohandy Morales
Nasim Nunez
Outfielders
James Wood
Dylan Crews
Jacob Young
Designated Hitters
Andres Chaparro
Pitchers
Framber Valdez
Catchers
Dillon Dingler
Infielders
Kevin McGonigle
Spencer Torkelson
John Peck
Zach McKinstry
Outfielders
Ben Malgeri
Riley Greene
Max Clark
Designated Hitters
Hao-Yu Lee
Nationals
VS
Tigers
Batting
159
Team Games Played
159
5414
At Bats
5360
1333
Hits
1292
765
Runs Batted In
672
207
Home Runs
177
176
Stolen Bases
56
.246
Batting Average
.241
807
Runs
709
277
Doubles
255
30
Triples
33
2291
Total Bases
2144
546
Walks
574
1327
Strikeouts
1381
.321
On Base Percentage
.320
.423
Slugging Percentage
.400
.744
OBP Pct + SLG Pct
.720
159
Games Played
159
159
Games Started
159
68
Hit By Pitch
66
0.0
Wins Above Replacement
0.0
0.0
Offensive Wins Above Replacement
0.0
39
Caught Stealing
23
1
Is Qualified
1
764.0
Runs Created
699.9
4.8
Runs Created Per 27 Outs
4.5
.090
Walks Per Plate Appearance
.095
0.41
Walk To Strikeout Ratio
0.42
.177
Isolated Power
.159
.303
Secondary Average
.272
3.82
Pitches Per Plate Appearance
3.93
514
Extra Base Hits
465
6088
Plate Appearances
6059
26.2
At Bats Per Home Run
30.3
19
Sacrifice Hit
9
37
Sacrifice Flies
44
Pitching
159
Team Games Played
159
36
Quality Starts
56
75
Wins
74
84
Losses
85
40
Saves
31
80
Holds
70
1366
Hits
1217
729
Earned runs
570
211
Home Runs
163
593
Walks
499
1254
Strikeouts
1280
8.0
Strikeouts Per 9 Innings
8.2
151.0
Pitches Per Start
142.3
1.39
Walks Plus Hits Per Inning Pitched
1.22
4.65
Earned Run Average
3.65
84
Losses
85
1410.0
Innings pitched
1407.0
.472
Win Percentage
.465
82
Save Opportunities
63
.253
Opponent Batting Average
.232
.333
Opponent's On-base pct.
.306
.422
Opponent's Slugging pct.
.377
.755
Opponent's OPB Pct + SLG Pct
.683
5397
At Bats
5256
255
Doubles
238
12
Triples
20
81
Batters Hit
78
115
Stolen Bases
93
159
Games Played
159
0
Complete Games
0
5
Shutouts
15
65
Wild Pitches
38
764
Runs Batted In
606
1
Balks
4
1410.0
Innings pitched
1407.0
8.0
Strikeouts Per 9 Innings
8.2
33
Caught Stealing
31
159
Games Started
159
0.0
Wins Above Replacement
0.0
1
Is Qualified
1
798
Runs
638
729
Earned Runs
570
2278
Total Bases
1984
Fielding
159
Team Games Played
159
1410
Full Innings
1407
5761
Total Chances
5718
4230
Putouts
4221
1427
Assists
1420
104
Errors
77
277
Double Plays
255
0.982
Fielding Percentage
0.987
36.1
Range Factor
36.1
0.0
Zone Rating
0.0
159
Games Played
159
0
Games Started
0
0.0
Defensive Wins Above Replacement
0.0
1
Qualified
1