

Orioles vs Mets Live Score (16 Sep, 2026)
Game Information
Stage
STD
Season
2026
First Pitch
Wed, Sep 16, 7:00 pm
Venue
Citi Field
Location
Queens, New York
Venue Type
Outdoor
Broadcast
ESPN
Attendance
25,324
Live Situation
2Balls
1Strikes
0Outs
—Pitcher
—At Bat
Pitch Sequence
1
BALL
Splitter
89 MPH
2
BALL
Splitter
89 MPH
3
STRIKE LOOKING
Sinker
95 MPH
4
BALL IN PLAY
Sinker
96 MPH
Injury Report


Team Stats
 BAL
NYM


7
Runs
1
9
Hits
7
1
Errors
0
4
Home Runs
0
2
Walks
1
11
Strikeouts
8
Player Box Score
Baltimore Orioles
| Player | H-AB | AB | R | H | RBI | HR | BB | K | #P | AVG | OBP | SLG |
|---|---|---|---|---|---|---|---|---|---|---|---|---|
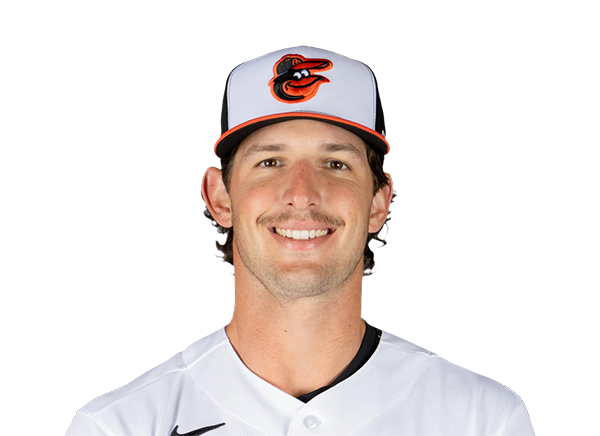 Dylan Beavers | 0-4 | 4 | 0 | 0 | 0 | 0 | 0 | 2 | 14 | .237 | .313 | .376 |
 Heston Kjerstad | 0-1 | 1 | 0 | 0 | 0 | 0 | 0 | 1 | 8 | .222 | .222 | .278 |
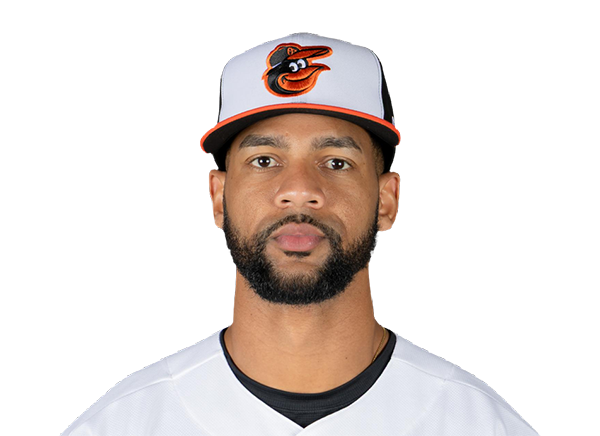 Leody Taveras | 0-0 | 0 | 0 | 0 | 0 | 0 | 0 | 0 | 0 | .217 | .287 | .343 |
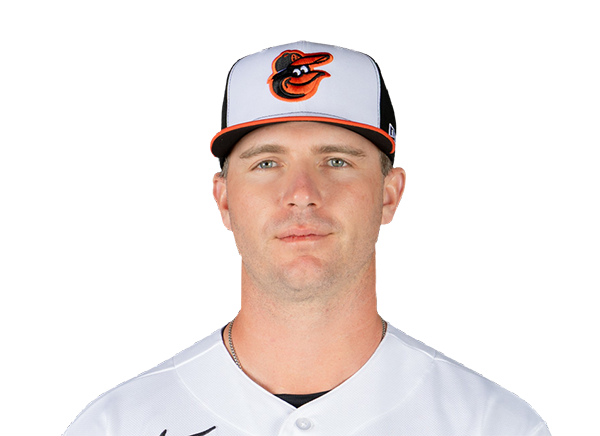 Pete Alonso | 1-4 | 4 | 1 | 1 | 1 | 1 | 0 | 1 | 16 | .267 | .361 | .503 |
 Gunnar Henderson | 0-4 | 4 | 0 | 0 | 0 | 0 | 0 | 1 | 19 | .221 | .306 | .397 |
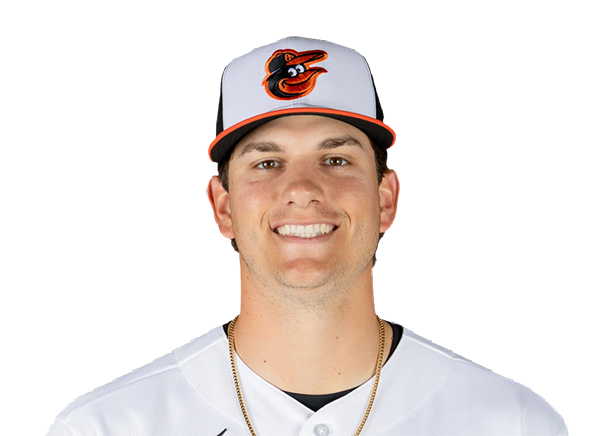 Coby Mayo | 0-3 | 3 | 1 | 0 | 0 | 0 | 1 | 0 | 17 | .225 | .290 | .465 |
 Christian Encarnacion-Strand | 3-4 | 4 | 3 | 3 | 2 | 1 | 0 | 1 | 15 | .277 | .326 | .520 |
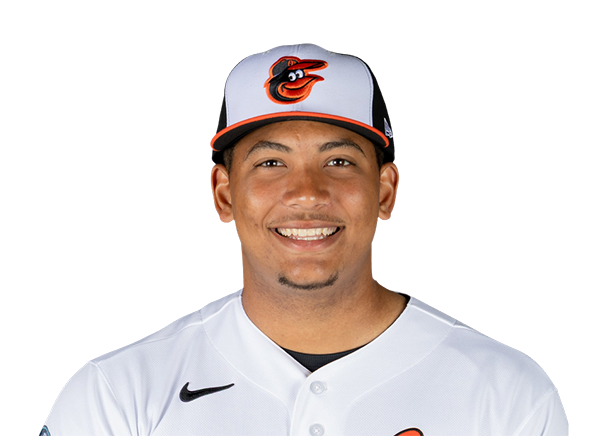 Samuel Basallo | 2-4 | 4 | 1 | 2 | 2 | 1 | 0 | 1 | 14 | .227 | .296 | .417 |
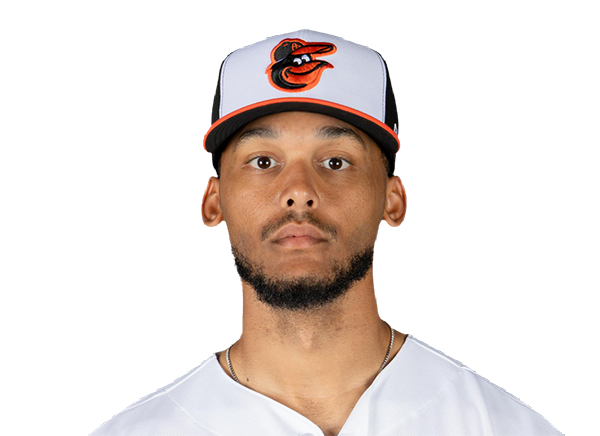 Jeremiah Jackson | 1-4 | 4 | 1 | 1 | 2 | 1 | 0 | 2 | 15 | .229 | .256 | .382 |
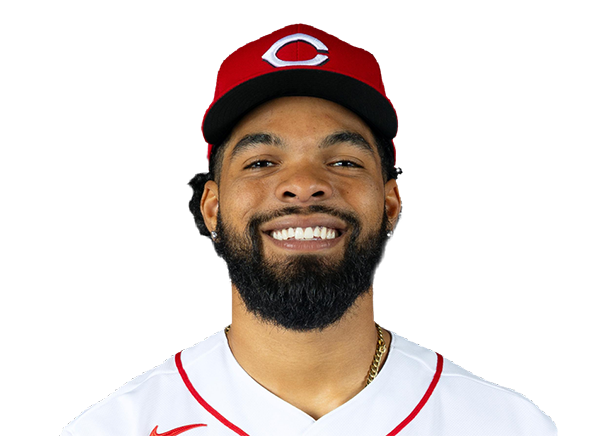 Rece Hinds | 1-4 | 4 | 0 | 1 | 0 | 0 | 0 | 1 | 10 | .157 | .224 | .235 |
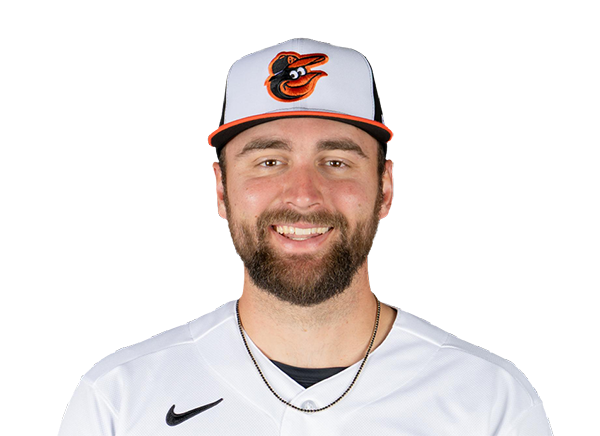 Colton Cowser | 1-3 | 3 | 0 | 1 | 0 | 0 | 1 | 1 | 17 | .217 | .308 | .362 |
New York Mets
| Player | H-AB | AB | R | H | RBI | HR | BB | K | #P | AVG | OBP | SLG |
|---|---|---|---|---|---|---|---|---|---|---|---|---|
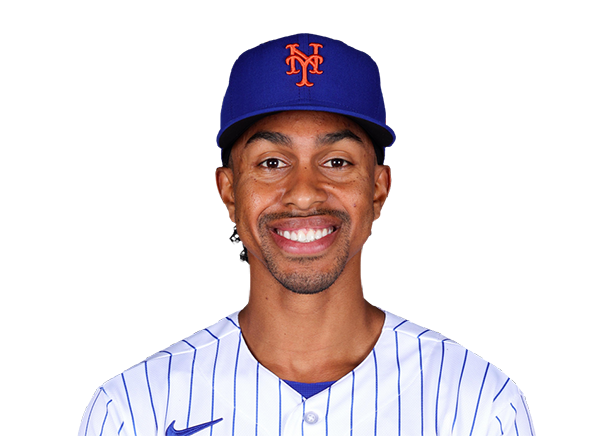 Francisco Lindor | 1-4 | 4 | 0 | 1 | 0 | 0 | 0 | 2 | 22 | .229 | .314 | .437 |
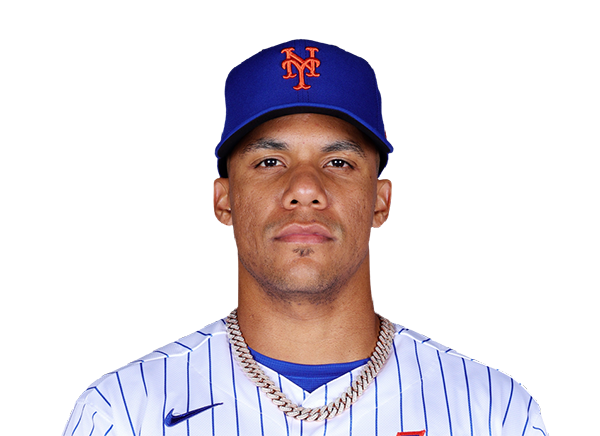 Juan Soto | 0-4 | 4 | 0 | 0 | 0 | 0 | 0 | 0 | 11 | .271 | .389 | .518 |
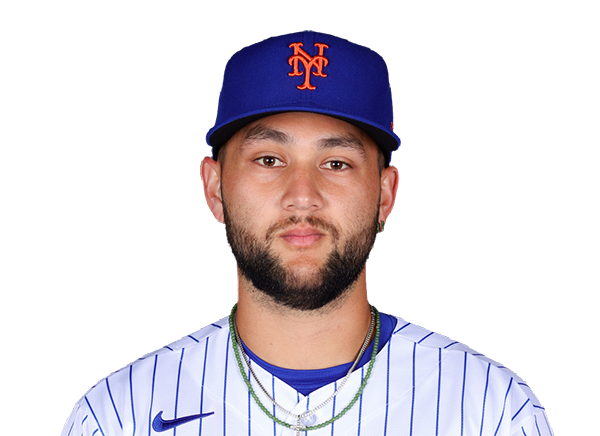 Bo Bichette | 1-4 | 4 | 0 | 1 | 0 | 0 | 0 | 2 | 12 | .263 | .313 | .391 |
 Carson Benge | 0-4 | 4 | 0 | 0 | 0 | 0 | 0 | 0 | 20 | .270 | .333 | .413 |
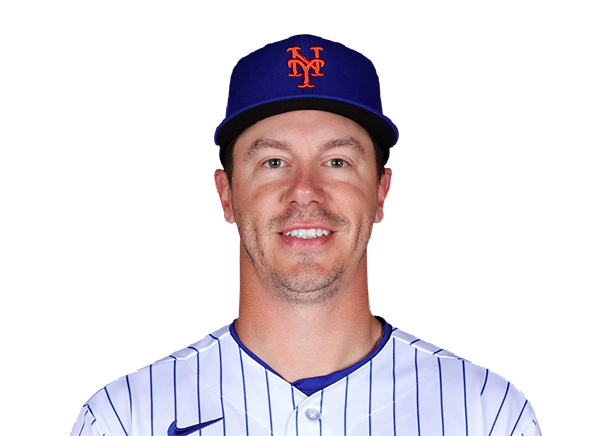 Jared Young | 1-3 | 3 | 1 | 1 | 0 | 0 | 1 | 0 | 16 | .268 | .332 | .431 |
 Marcus Semien | 1-4 | 4 | 0 | 1 | 1 | 0 | 0 | 0 | 13 | .220 | .285 | .345 |
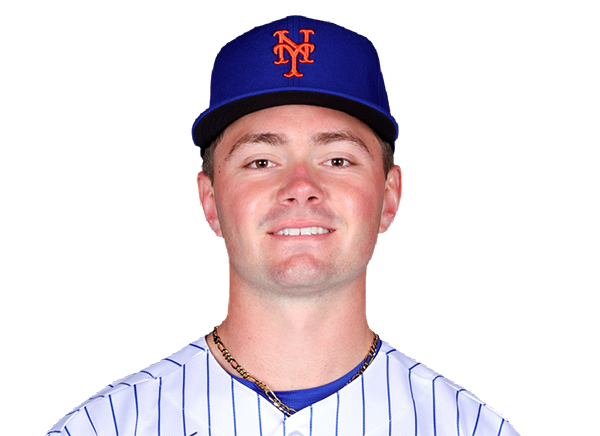 A.J. Ewing | 2-4 | 4 | 0 | 2 | 0 | 0 | 0 | 1 | 11 | .256 | .327 | .383 |
 Brett Baty | 1-4 | 4 | 0 | 1 | 0 | 0 | 0 | 1 | 17 | .229 | .300 | .363 |
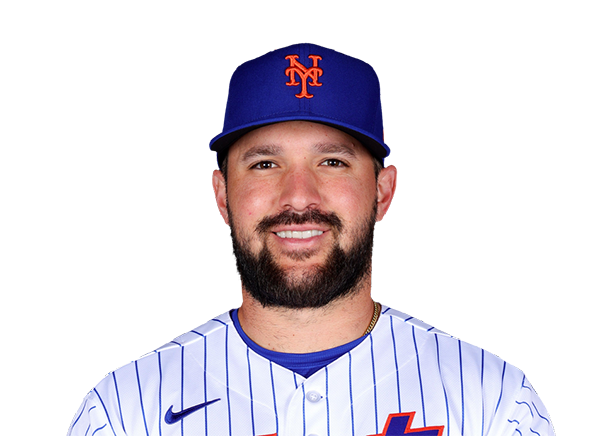 Luis Torrens | 0-3 | 3 | 0 | 0 | 0 | 0 | 0 | 2 | 12 | .242 | .303 | .413 |
Baltimore Orioles
| Player | IP | H | R | ER | BB | K | HR | PC-ST | ERA | PC |
|---|---|---|---|---|---|---|---|---|---|---|
 Chris Bassitt | 6.2 | 5 | 1 | 1 | 1 | 6 | 0 | 95-61 | 4.64 | 95 |
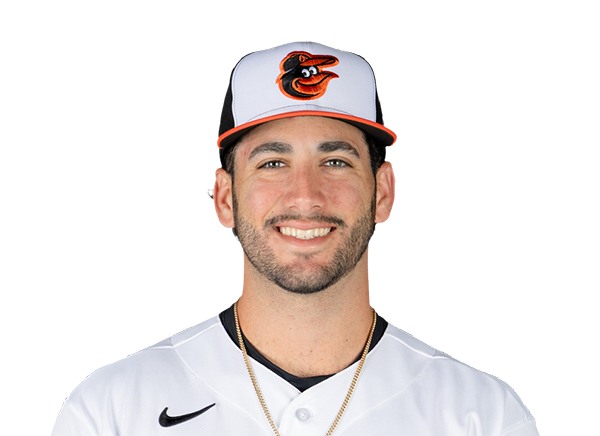 Anthony Nunez | 0.1 | 0 | 0 | 0 | 0 | 1 | 0 | 6-4 | 3.97 | 6 |
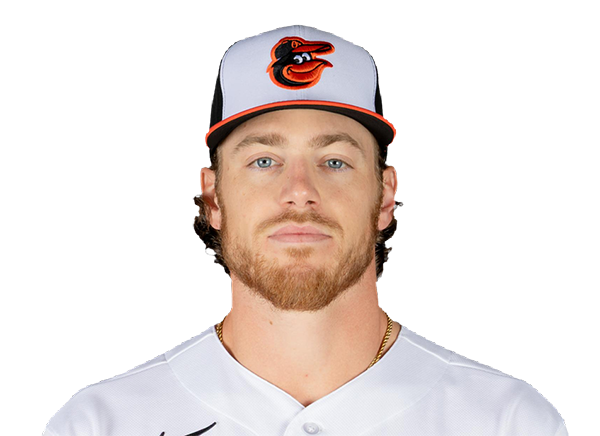 Josh Walker | 1.0 | 1 | 0 | 0 | 0 | 1 | 0 | 20-13 | 1.61 | 20 |
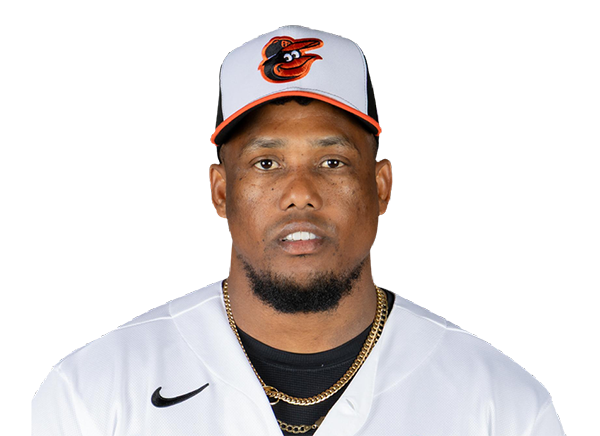 Yennier Cano | 1.0 | 1 | 0 | 0 | 0 | 0 | 0 | 13-7 | 3.06 | 13 |
New York Mets
| Player | IP | H | R | ER | BB | K | HR | PC-ST | ERA | PC |
|---|---|---|---|---|---|---|---|---|---|---|
 Xzavion Curry | 3.0 | 6 | 6 | 6 | 1 | 3 | 4 | 61-37 | 5.48 | 61 |
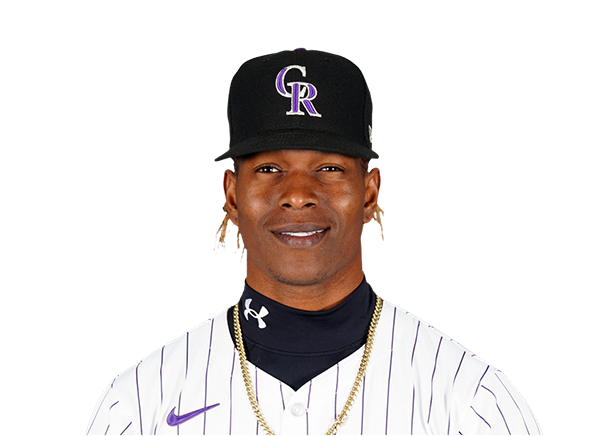 Jefry Yan | 3.0 | 0 | 0 | 0 | 0 | 3 | 0 | 32-21 | 4.60 | 32 |
 Jack Weisenburger | 3.0 | 3 | 1 | 1 | 1 | 5 | 0 | 52-35 | 2.61 | 52 |
H2H / Season Series
NYM1–7
BAL
NYM5–7
BAL
NYM1–2
BAL
Last 5 Games
| Date | Opponent | Result |
|---|---|---|
| Sep 16 | @ NYM | W7–1 |
| Sep 15 | @ NYM | W7–5 |
| Sep 14 | @ NYM | W2–1 |
| Sep 13 |  @ TOR | L1–8 |
| Sep 12 | @ TOR | L3–7 |
| Date | Opponent | Result |
|---|---|---|
| Sep 16 | vs BAL | L1–7 |
| Sep 15 | vs BAL | L5–7 |
| Sep 14 | vs BAL | L1–2 |
| Sep 13 |  @ NYY | L0–2 |
| Sep 12 | @ NYY | W12–2 |
Standings
American League
| Team | W | L | PCT | GB | DIFF | STRK |
|---|---|---|---|---|---|---|
1 Rays | 92 | 59 | .609 | - | +71 | W5 |
2 Guardians | 78 | 75 | .510 | 15 | -7 | W2 |
3 Astros | 76 | 76 | .500 | 16.5 | -54 | L1 |
| 4Yankees | 88 | 64 | .579 | 4.5 | +136 | L1 |
5 Red Sox | 82 | 70 | .539 | 10.5 | +82 | L2 |
6 White Sox | 77 | 75 | .507 | 15.5 | +34 | L2 |
7 Rangers | 76 | 76 | .500 | 16.5 | -38 | W4 |
| 8Blue Jays | 76 | 77 | .497 | 17 | -37 | W1 |
| 9Orioles | 75 | 78 | .490 | 18 | -26 | W3 |
10 Tigers | 72 | 80 | .474 | 20.5 | +76 | L1 |
11 Twins | 71 | 81 | .467 | 21.5 | -73 | W1 |
12 Mariners | 71 | 82 | .464 | 22 | -56 | W1 |
13 Royals | 67 | 85 | .441 | 25.5 | -93 | W1 |
14 Athletics | 61 | 91 | .401 | 31.5 | -205 | L2 |
15 Angels | 58 | 94 | .382 | 34.5 | -78 | L1 |
National League
| Team | W | L | PCT | GB | DIFF | STRK |
|---|---|---|---|---|---|---|
1 Brewers | 95 | 57 | .625 | - | +200 | W2 |
2 Dodgers | 92 | 60 | .605 | 3 | +173 | L1 |
3 Braves | 89 | 64 | .582 | 6.5 | +111 | L1 |
4 Cubs | 85 | 68 | .556 | 10.5 | +143 | W1 |
5 Phillies | 84 | 68 | .553 | 11 | +31 | W1 |
6 Padres | 83 | 69 | .546 | 12 | +23 | W1 |
7 Diamondbacks | 80 | 73 | .523 | 15.5 | 0 | L2 |
8 Marlins | 76 | 77 | .497 | 19.5 | +8 | W2 |
9 Pirates | 75 | 77 | .493 | 20 | +21 | L2 |
10 Cardinals | 75 | 78 | .490 | 20.5 | -14 | L2 |
11 Reds | 71 | 81 | .467 | 24 | -148 | W1 |
12 Nationals | 71 | 82 | .464 | 24.5 | +3 | L1 |
| 13Mets | 69 | 83 | .454 | 26 | -43 | L4 |
14 Giants | 64 | 89 | .418 | 31.5 | -70 | W2 |
15 Rockies | 56 | 96 | .368 | 39 | -170 | L1 |
BAL
VS
NYM
Pitchers
Chris Bassitt
Catchers
Samuel Basallo
Infielders
Pete Alonso
Gunnar Henderson
Christian Encarnacion-Strand
Jeremiah Jackson
Outfielders
Dylan Beavers
Rece Hinds
Colton Cowser
Designated Hitters
Coby Mayo
Pitchers
Xzavion Curry
Catchers
Luis Torrens
Infielders
Francisco Lindor
Bo Bichette
Jared Young
Marcus Semien
Outfielders
Juan Soto
Carson Benge
A.J. Ewing
Designated Hitters
Brett Baty
Orioles
VS
Mets
Batting
153
Team Games Played
152
5110
At Bats
5131
1198
Hits
1220
663
Runs Batted In
621
188
Home Runs
190
76
Stolen Bases
82
.234
Batting Average
.238
688
Runs
650
224
Doubles
195
19
Triples
18
2024
Total Bases
2021
560
Walks
490
1439
Strikeouts
1280
.315
On Base Percentage
.308
.396
Slugging Percentage
.394
.711
OBP Pct + SLG Pct
.702
153
Games Played
152
153
Games Started
152
58
Hit By Pitch
47
0.0
Wins Above Replacement
0.0
0.0
Offensive Wins Above Replacement
0.0
32
Caught Stealing
33
1
Is Qualified
1
647.3
Runs Created
628.0
4.3
Runs Created Per 27 Outs
4.1
.097
Walks Per Plate Appearance
.086
0.39
Walk To Strikeout Ratio
0.38
.162
Isolated Power
.156
.280
Secondary Average
.261
3.97
Pitches Per Plate Appearance
3.93
431
Extra Base Hits
403
5783
Plate Appearances
5725
27.2
At Bats Per Home Run
27.0
18
Sacrifice Hit
18
35
Sacrifice Flies
35
Pitching
153
Team Games Played
152
58
Quality Starts
44
75
Wins
69
78
Losses
83
44
Saves
29
80
Holds
70
1328
Hits
1240
628
Earned runs
629
166
Home Runs
177
509
Walks
518
1229
Strikeouts
1366
8.1
Strikeouts Per 9 Innings
9.1
146.5
Pitches Per Start
148.1
1.35
Walks Plus Hits Per Inning Pitched
1.30
4.14
Earned Run Average
4.18
78
Losses
83
1364.1
Innings pitched
1354.2
.490
Win Percentage
.454
66
Save Opportunities
48
.254
Opponent Batting Average
.241
.323
Opponent's On-base pct.
.318
.408
Opponent's Slugging pct.
.401
.731
Opponent's OPB Pct + SLG Pct
.718
5233
At Bats
5147
258
Doubles
246
26
Triples
23
49
Batters Hit
74
82
Stolen Bases
65
153
Games Played
152
1
Complete Games
0
2
Shutouts
5
44
Wild Pitches
35
685
Runs Batted In
665
4
Balks
3
1364.1
Innings pitched
1354.2
8.1
Strikeouts Per 9 Innings
9.1
35
Caught Stealing
30
153
Games Started
152
0.0
Wins Above Replacement
0.0
1
Is Qualified
1
714
Runs
693
628
Earned Runs
629
2136
Total Bases
2063
Fielding
153
Team Games Played
152
1364
Full Innings
1355
5489
Total Chances
5332
4093
Putouts
4064
1304
Assists
1178
92
Errors
90
224
Double Plays
195
0.983
Fielding Percentage
0.983
35.6
Range Factor
34.8
0.0
Zone Rating
0.0
153
Games Played
152
0
Games Started
0
0.0
Defensive Wins Above Replacement
0.0
1
Qualified
1