

Orioles vs Rangers Live Score (8 Aug, 2026)
Game Information
Stage
Standard
Season
2026
First Pitch
Fri, Aug 7, 8:15 pm
Venue
Globe Life Field
Location
Arlington, Texas
Attendance
27,804
Home Runs
Pete Alonso
23 HR
.249 AVG
71 RBI

Joc Pederson
20 HR
.252 AVG
42 RBI

Batting Average
Pete Alonso
.249 AVG
.343 OBP
.458 SLG
Josh Jung
.294 AVG
.361 OBP
.441 SLG

Runs Batted In
Pete Alonso
71 RBI
23 HR
.249 AVG
Jake Burger
66 RBI
19 HR
.238 AVG

Earned Run Average
Kyle Bradish
3.79 ERA
7 W
117 K

Nathan Eovaldi
4.31 ERA
10 W
135 K

Wins
Brandon Young
8 W
3.43 ERA
89 K

Nathan Eovaldi
10 W
4.31 ERA
135 K
Strikeouts
Kyle Bradish
117 K
7 W
3.79 ERA
MacKenzie Gore
140 K
6 W
4.55 ERA

Injury Report


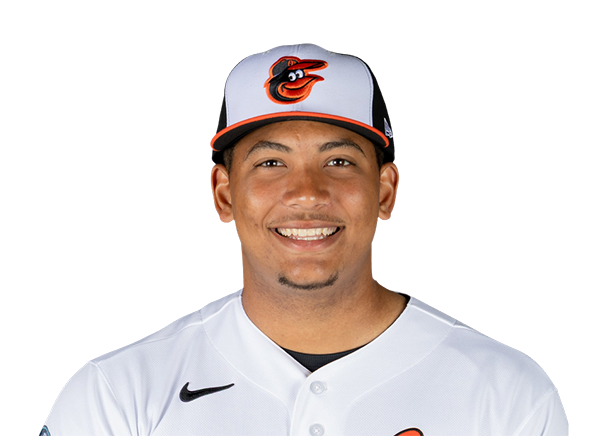

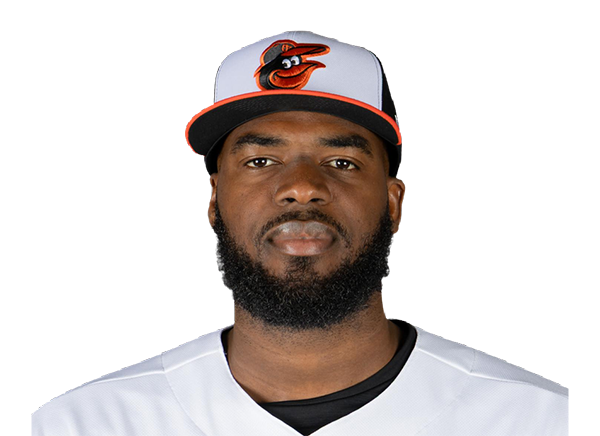
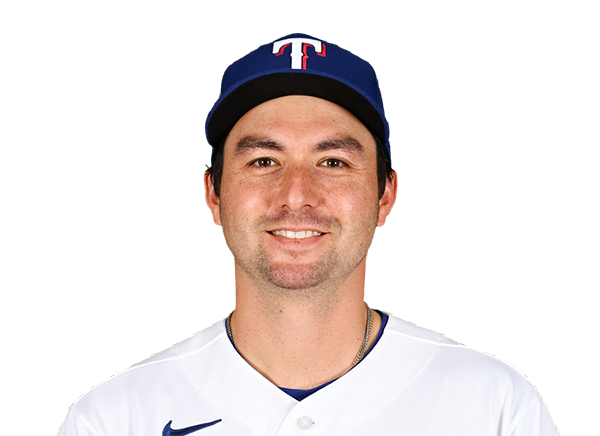
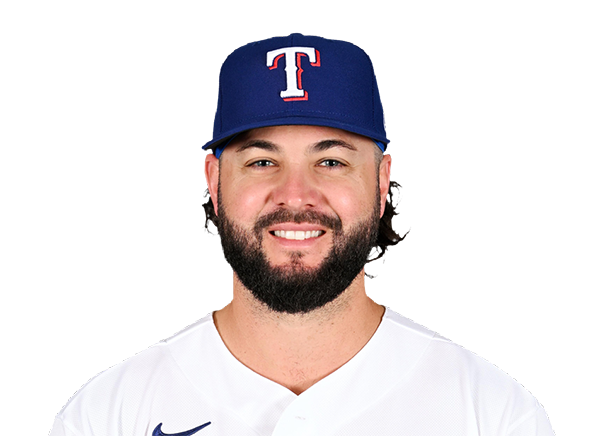


Team Stats
 BAL
TEX


Array
Runs
Array
7
Hits
3
0
Errors
0
—
Home Runs
—
—
Walks
—
—
Strikeouts
—
Standings
American League
| Team | W | L | PCT | GB | DIFF | STRK |
|---|---|---|---|---|---|---|
1 Rays | 76 | 53 | .589 | - | +42 | L3 |
2 White Sox | 67 | 62 | .519 | 9 | +42 | L1 |
3 Astros | 65 | 65 | .500 | 11.5 | -43 | L1 |
4 Yankees | 73 | 56 | .566 | 3 | +95 | L1 |
5 Red Sox | 70 | 59 | .543 | 6 | +98 | W2 |
| 6Rangers | 64 | 66 | .492 | 12.5 | -48 | L1 |
7 Guardians | 64 | 66 | .492 | 12.5 | -14 | W3 |
8 Blue Jays | 64 | 67 | .489 | 13 | -50 | W1 |
9 Twins | 63 | 67 | .485 | 13.5 | -47 | L2 |
| 10Orioles | 63 | 67 | .485 | 13.5 | -33 | W2 |
11 Mariners | 62 | 68 | .477 | 14.5 | -44 | W2 |
12 Tigers | 61 | 68 | .473 | 15 | +77 | L4 |
13 Royals | 57 | 74 | .435 | 20 | -95 | W7 |
14 Angels | 52 | 78 | .400 | 24.5 | -68 | W1 |
15 Athletics | 50 | 80 | .385 | 26.5 | -188 | W1 |
National League
| Team | W | L | PCT | GB | DIFF | STRK |
|---|---|---|---|---|---|---|
1 Brewers | 81 | 49 | .623 | - | +163 | W3 |
2 Dodgers | 79 | 51 | .608 | 2 | +147 | W5 |
3 Braves | 75 | 55 | .577 | 6 | +108 | L2 |
4 Cubs | 74 | 56 | .569 | 7 | +98 | L3 |
5 Phillies | 72 | 58 | .554 | 9 | +25 | W8 |
6 Padres | 70 | 60 | .538 | 11 | +9 | W2 |
7 Diamondbacks | 68 | 62 | .523 | 13 | +7 | L1 |
8 Marlins | 66 | 64 | .508 | 15 | +17 | W2 |
9 Cardinals | 66 | 65 | .504 | 15.5 | 0 | L2 |
10 Pirates | 63 | 68 | .481 | 18.5 | +29 | L2 |
11 Reds | 62 | 68 | .477 | 19 | -92 | W1 |
12 Nationals | 61 | 70 | .466 | 20.5 | +14 | L3 |
13 Mets | 59 | 71 | .454 | 22 | -39 | W1 |
14 Giants | 52 | 77 | .403 | 28.5 | -79 | L3 |
15 Rockies | 50 | 79 | .388 | 30.5 | -131 | L5 |
BAL
VS
TEX
Pitchers

Shane Baz
Catchers
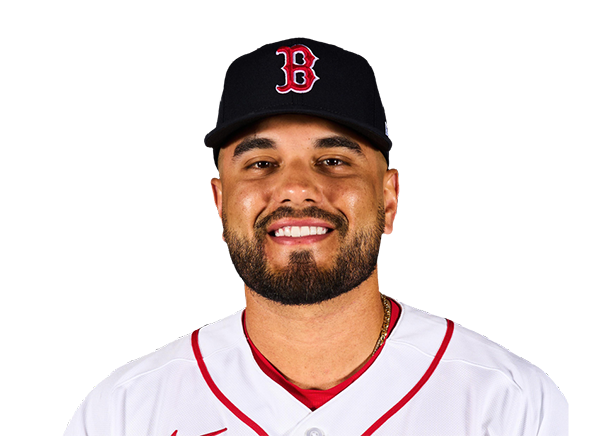
Carlos Narvaez
Infielders

Gunnar Henderson
Pete Alonso
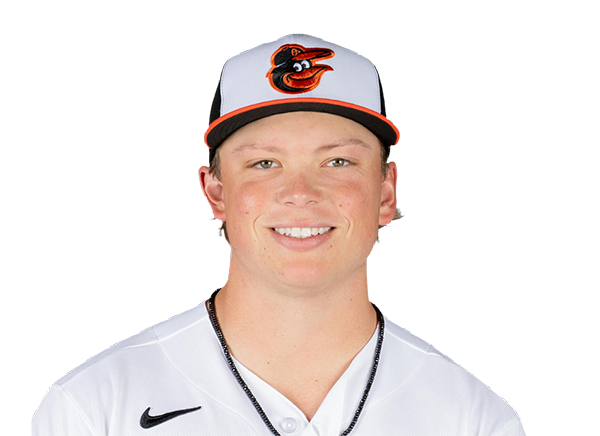
Jackson Holliday
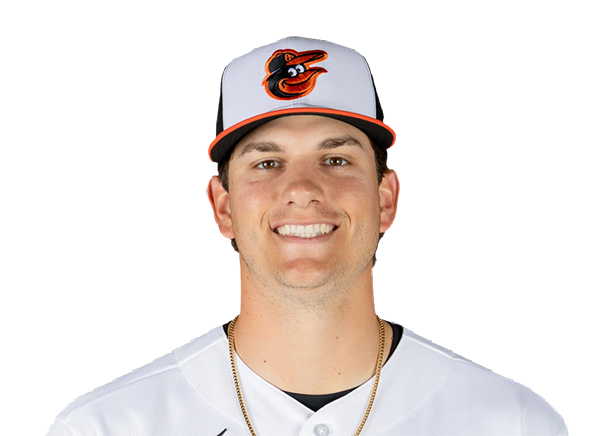
Coby Mayo
Outfielders

Dylan Beavers
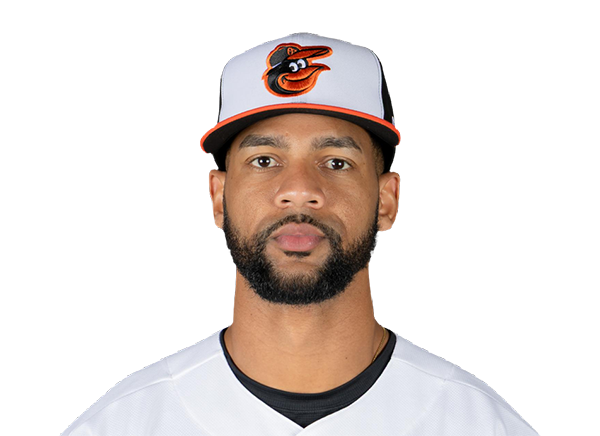
Leody Taveras

Colton Cowser
Designated Hitters
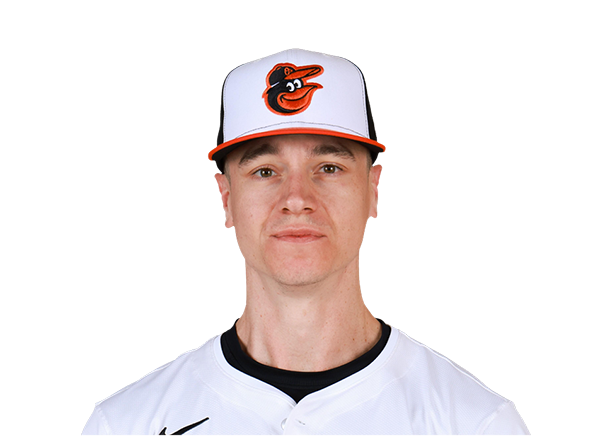
Tyler O'Neill
Pitchers
Nathan Eovaldi
Catchers
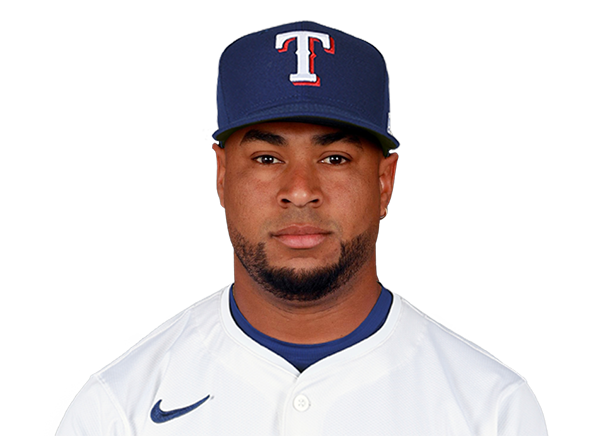
Elias Diaz
Infielders

Corey Seager
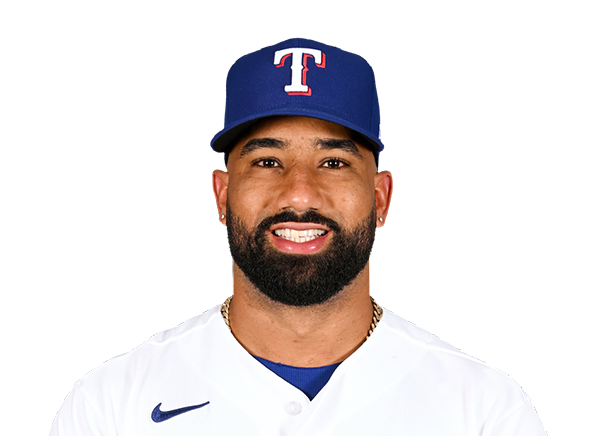
Ezequiel Duran
Jake Burger
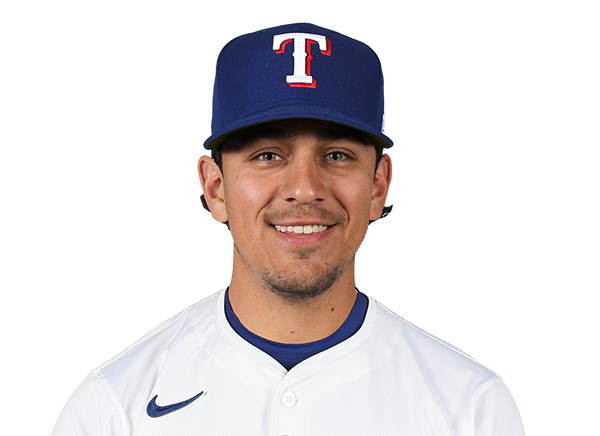
Nicky Lopez
Outfielders

Wyatt Langford

Brandon Nimmo

Evan Carter
Designated Hitters
Joc Pederson
Orioles
VS
Rangers
Batting
116
Team Games Played
116
3837
At Bats
3861
898
Hits
944
499
Runs Batted In
463
133
Home Runs
132
62
Stolen Bases
58
.234
Batting Average
.244
517
Runs
479
168
Doubles
172
16
Triples
18
1497
Total Bases
1548
450
Walks
371
1065
Strikeouts
987
.319
On Base Percentage
.317
.390
Slugging Percentage
.401
.709
OBP Pct + SLG Pct
.718
116
Games Played
116
116
Games Started
116
43
Hit By Pitch
53
0.0
Wins Above Replacement
0.0
0.0
Offensive Wins Above Replacement
0.0
26
Caught Stealing
15
1
Is Qualified
1
486.7
Runs Created
497.1
4.3
Runs Created Per 27 Outs
4.4
.103
Walks Per Plate Appearance
.086
0.42
Walk To Strikeout Ratio
0.38
.156
Isolated Power
.156
.283
Secondary Average
.264
3.99
Pitches Per Plate Appearance
3.85
317
Extra Base Hits
322
4377
Plate Appearances
4331
28.8
At Bats Per Home Run
29.3
15
Sacrifice Hit
21
30
Sacrifice Flies
24
Pitching
116
Team Games Played
116
45
Quality Starts
37
56
Wins
58
60
Losses
58
30
Saves
33
61
Holds
59
994
Hits
966
480
Earned runs
481
125
Home Runs
141
387
Walks
339
921
Strikeouts
971
8.0
Strikeouts Per 9 Innings
8.6
145.6
Pitches Per Start
143.7
1.34
Walks Plus Hits Per Inning Pitched
1.28
4.18
Earned Run Average
4.26
60
Losses
58
1032.2
Innings pitched
1016.1
.483
Win Percentage
.500
46
Save Opportunities
48
.252
Opponent Batting Average
.247
.319
Opponent's On-base pct.
.313
.410
Opponent's Slugging pct.
.409
.729
Opponent's OPB Pct + SLG Pct
.722
3949
At Bats
3917
209
Doubles
177
20
Triples
19
28
Batters Hit
48
60
Stolen Bases
68
116
Games Played
116
1
Complete Games
0
2
Shutouts
10
37
Wild Pitches
38
527
Runs Batted In
494
2
Balks
1
1032.2
Innings pitched
1016.1
8.0
Strikeouts Per 9 Innings
8.6
27
Caught Stealing
19
116
Games Started
116
0.0
Wins Above Replacement
0.0
1
Is Qualified
1
551
Runs
511
480
Earned Runs
481
1618
Total Bases
1604
Fielding
116
Team Games Played
116
1033
Full Innings
1016
4177
Total Chances
3986
3098
Putouts
3049
1004
Assists
887
75
Errors
50
168
Double Plays
172
0.982
Fielding Percentage
0.987
35.8
Range Factor
34.9
0.0
Zone Rating
0.0
116
Games Played
116
0
Games Started
0
0.0
Defensive Wins Above Replacement
0.0
1
Qualified
1