

Orioles vs Rangers Live Score (8 Aug, 2026)
Game Information
Stage
Standard
Season
2026
First Pitch
Sat, Aug 8, 7:15 pm
Venue
Globe Life Field
Location
Arlington, Texas
Attendance
38,626
Home Runs
Pete Alonso
23 HR
.247 AVG
71 RBI

Joc Pederson
21 HR
.252 AVG
44 RBI

Batting Average
Pete Alonso
.247 AVG
.341 OBP
.454 SLG
Josh Jung
.294 AVG
.361 OBP
.441 SLG

Runs Batted In
Pete Alonso
71 RBI
23 HR
.247 AVG
Jake Burger
66 RBI
19 HR
.236 AVG

Earned Run Average
Shane Baz
3.76 ERA
4 W
120 K

Nathan Eovaldi
4.21 ERA
10 W
137 K

Wins
Brandon Young
8 W
3.43 ERA
89 K

Nathan Eovaldi
10 W
4.21 ERA
137 K
Strikeouts
Shane Baz
120 K
4 W
3.76 ERA
MacKenzie Gore
140 K
6 W
4.55 ERA

Injury Report





Team Stats
 BAL
TEX


Array
Runs
Array
6
Hits
6
2
Errors
0
—
Home Runs
—
—
Walks
—
—
Strikeouts
—
Standings
American League
| Team | W | L | PCT | GB | DIFF | STRK |
|---|---|---|---|---|---|---|
1 Rays | 76 | 52 | .594 | - | +43 | L2 |
2 White Sox | 67 | 61 | .523 | 9 | +47 | W1 |
3 Astros | 65 | 64 | .504 | 11.5 | -42 | W1 |
4 Yankees | 73 | 56 | .566 | 3.5 | +95 | L1 |
5 Red Sox | 69 | 59 | .539 | 7 | +97 | W1 |
| 6Rangers | 64 | 65 | .496 | 12.5 | -45 | W2 |
7 Blue Jays | 64 | 67 | .489 | 13.5 | -50 | W1 |
8 Twins | 63 | 66 | .488 | 13.5 | -45 | L1 |
9 Guardians | 63 | 66 | .488 | 13.5 | -15 | W2 |
| 10Orioles | 62 | 67 | .481 | 14.5 | -34 | W1 |
11 Tigers | 61 | 67 | .477 | 15 | +79 | L3 |
12 Mariners | 61 | 68 | .473 | 15.5 | -45 | W1 |
13 Royals | 56 | 74 | .431 | 21 | -97 | W6 |
14 Angels | 51 | 78 | .395 | 25.5 | -71 | L1 |
15 Athletics | 49 | 80 | .380 | 27.5 | -189 | L5 |
National League
| Team | W | L | PCT | GB | DIFF | STRK |
|---|---|---|---|---|---|---|
1 Brewers | 81 | 49 | .623 | - | +163 | W3 |
2 Dodgers | 78 | 51 | .605 | 2.5 | +146 | W4 |
3 Braves | 75 | 55 | .577 | 6 | +108 | L2 |
4 Cubs | 74 | 55 | .574 | 6.5 | +99 | L2 |
5 Phillies | 71 | 58 | .550 | 9.5 | +16 | W7 |
6 Padres | 69 | 60 | .535 | 11.5 | +7 | W1 |
7 Diamondbacks | 68 | 61 | .527 | 12.5 | +13 | W2 |
8 Marlins | 66 | 64 | .508 | 15 | +17 | W2 |
9 Cardinals | 66 | 64 | .508 | 15 | +9 | L1 |
10 Pirates | 63 | 67 | .485 | 18 | +30 | L1 |
11 Reds | 61 | 68 | .473 | 19.5 | -98 | L2 |
12 Nationals | 61 | 70 | .466 | 20.5 | +14 | L3 |
13 Mets | 58 | 71 | .450 | 22.5 | -44 | L1 |
14 Giants | 52 | 76 | .406 | 28 | -78 | L2 |
15 Rockies | 50 | 78 | .391 | 30 | -130 | L4 |
BAL
VS
TEX
Pitchers

Kyle Bradish
Catchers
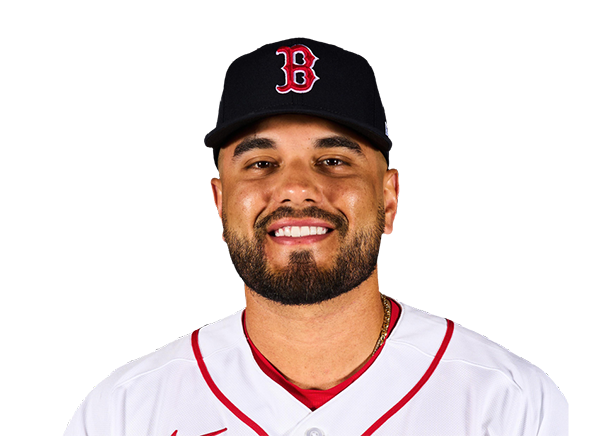
Carlos Narvaez
Infielders

Gunnar Henderson
Pete Alonso
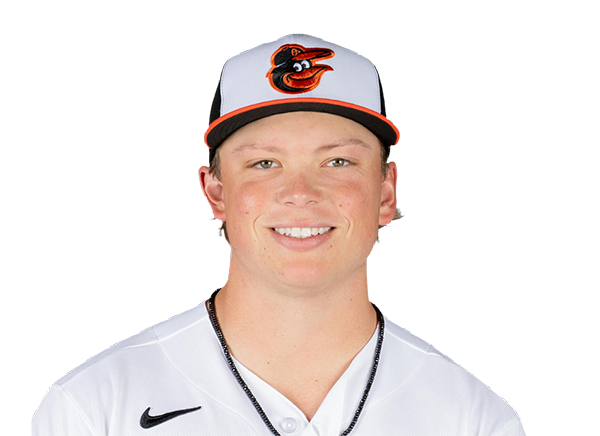
Jackson Holliday

Christian Encarnacion-Strand
Outfielders

Dylan Beavers
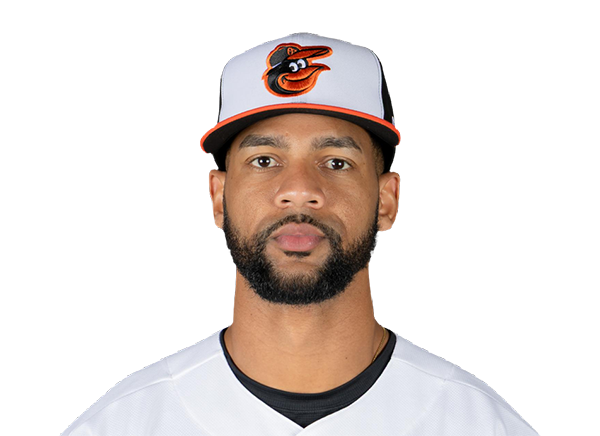
Leody Taveras

Colton Cowser
Designated Hitters
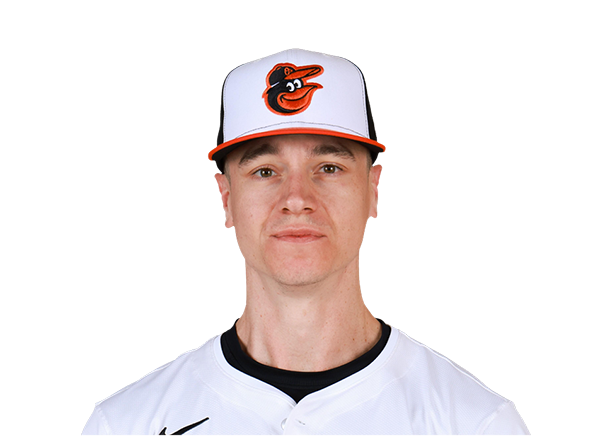
Tyler O'Neill
Pitchers

Jacob deGrom
Catchers
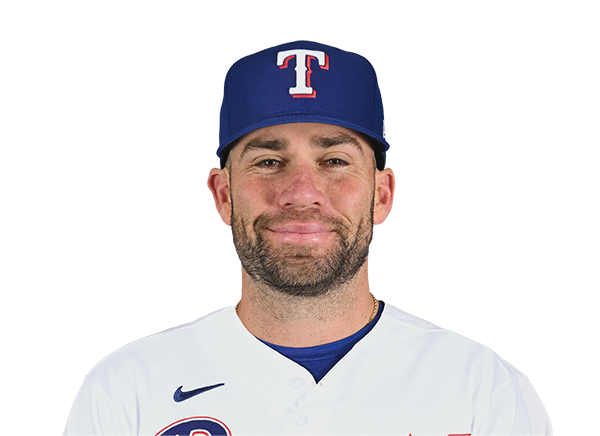
Austin Wynns
Infielders

Corey Seager
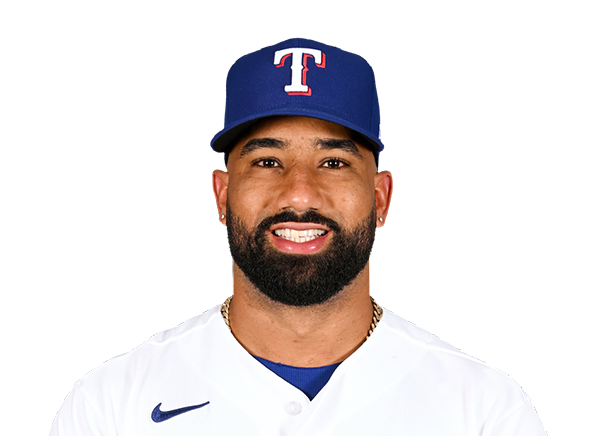
Ezequiel Duran
Jake Burger
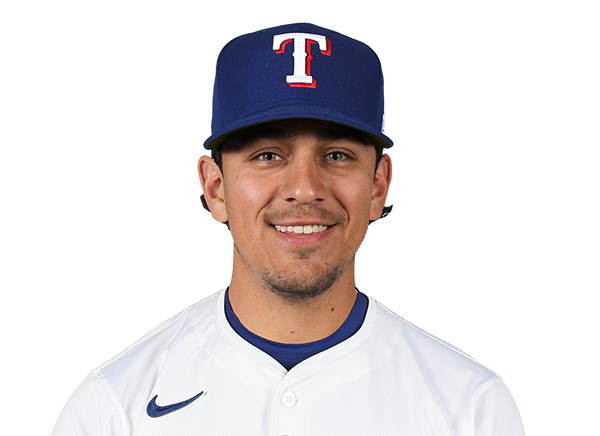
Nicky Lopez
Outfielders

Wyatt Langford

Brandon Nimmo

Evan Carter
Designated Hitters
Joc Pederson
Orioles
VS
Rangers
Batting
117
Team Games Played
117
3868
At Bats
3889
904
Hits
950
500
Runs Batted In
467
134
Home Runs
133
62
Stolen Bases
58
.234
Batting Average
.244
518
Runs
484
171
Doubles
172
16
Triples
18
1509
Total Bases
1557
453
Walks
373
1075
Strikeouts
996
.319
On Base Percentage
.317
.390
Slugging Percentage
.400
.709
OBP Pct + SLG Pct
.718
117
Games Played
117
117
Games Started
117
43
Hit By Pitch
54
0.0
Wins Above Replacement
0.0
0.0
Offensive Wins Above Replacement
0.0
26
Caught Stealing
15
1
Is Qualified
1
489.2
Runs Created
499.1
4.2
Runs Created Per 27 Outs
4.4
.103
Walks Per Plate Appearance
.086
0.42
Walk To Strikeout Ratio
0.37
.156
Isolated Power
.156
.283
Secondary Average
.263
3.99
Pitches Per Plate Appearance
3.86
321
Extra Base Hits
323
4411
Plate Appearances
4362
28.9
At Bats Per Home Run
29.2
15
Sacrifice Hit
21
30
Sacrifice Flies
24
Pitching
117
Team Games Played
117
46
Quality Starts
37
56
Wins
59
61
Losses
58
30
Saves
33
61
Holds
61
1000
Hits
972
484
Earned runs
482
126
Home Runs
142
389
Walks
342
930
Strikeouts
981
8.0
Strikeouts Per 9 Innings
8.6
145.5
Pitches Per Start
143.7
1.33
Walks Plus Hits Per Inning Pitched
1.28
4.19
Earned Run Average
4.23
61
Losses
58
1040.2
Innings pitched
1025.1
.479
Win Percentage
.504
46
Save Opportunities
48
.251
Opponent Batting Average
.246
.319
Opponent's On-base pct.
.312
.409
Opponent's Slugging pct.
.409
.728
Opponent's OPB Pct + SLG Pct
.722
3977
At Bats
3948
209
Doubles
180
20
Triples
19
29
Batters Hit
48
60
Stolen Bases
68
117
Games Played
117
1
Complete Games
0
2
Shutouts
10
38
Wild Pitches
38
531
Runs Batted In
495
2
Balks
1
1040.2
Innings pitched
1025.1
8.0
Strikeouts Per 9 Innings
8.6
27
Caught Stealing
19
117
Games Started
117
0.0
Wins Above Replacement
0.0
1
Is Qualified
1
556
Runs
512
484
Earned Runs
482
1627
Total Bases
1616
Fielding
117
Team Games Played
117
1041
Full Innings
1025
4211
Total Chances
4019
3122
Putouts
3076
1012
Assists
893
77
Errors
50
171
Double Plays
172
0.982
Fielding Percentage
0.988
35.8
Range Factor
34.8
0.0
Zone Rating
0.0
117
Games Played
117
0
Games Started
0
0.0
Defensive Wins Above Replacement
0.0
1
Qualified
1