

Orioles vs Twins Live Score (11 Aug, 2026)
Game Information
Stage
Standard
Season
2026
First Pitch
Tue, Aug 11, 7:40 pm
Venue
Target Field
Location
Minneapolis, Minnesota
Attendance
21,677
Home Runs
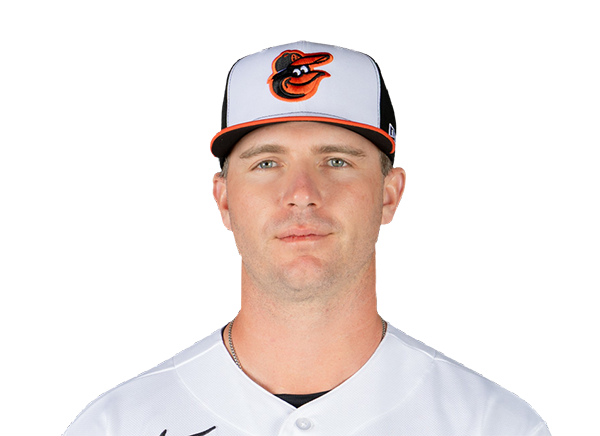
Pete Alonso
25 HR
.252 AVG
75 RBI
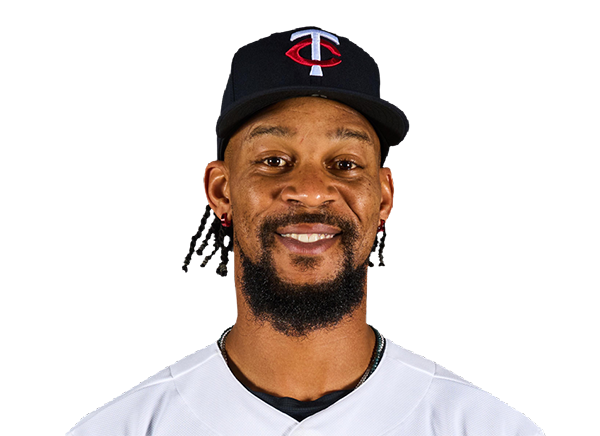
Byron Buxton
25 HR
.263 AVG
45 RBI
Batting Average
Pete Alonso
.252 AVG
.346 OBP
.470 SLG
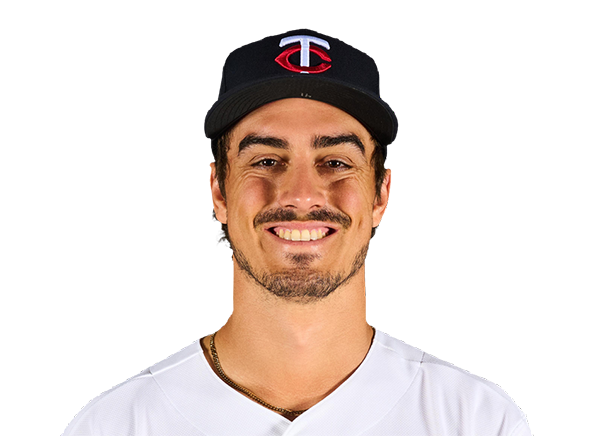
Luke Keaschall
.263 AVG
.356 OBP
.359 SLG

Runs Batted In
Pete Alonso
75 RBI
25 HR
.252 AVG
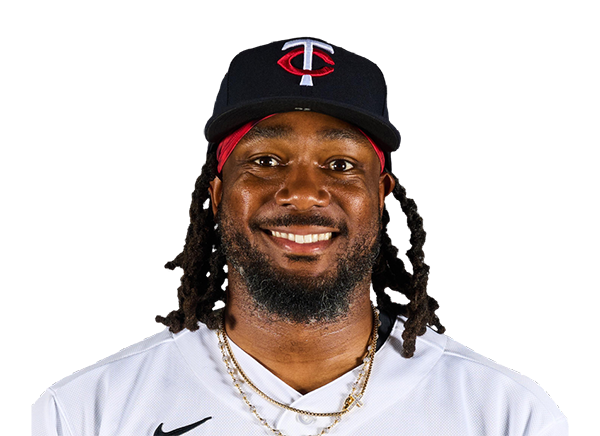
Josh Bell
71 RBI
16 HR
.252 AVG
Earned Run Average
Kyle Bradish
3.69 ERA
7 W
121 K

Joe Ryan
3.65 ERA
6 W
138 K
Wins
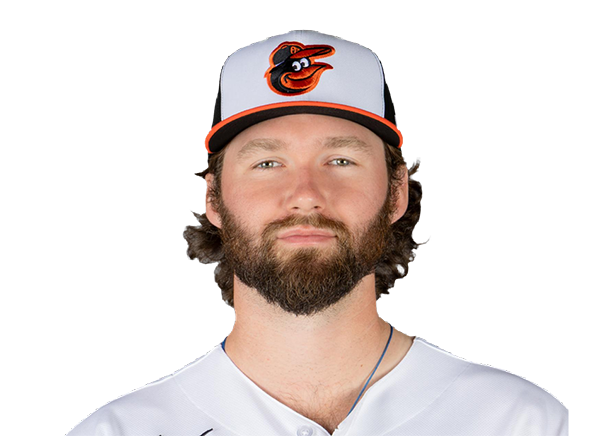
Brandon Young
8 W
3.43 ERA
89 K
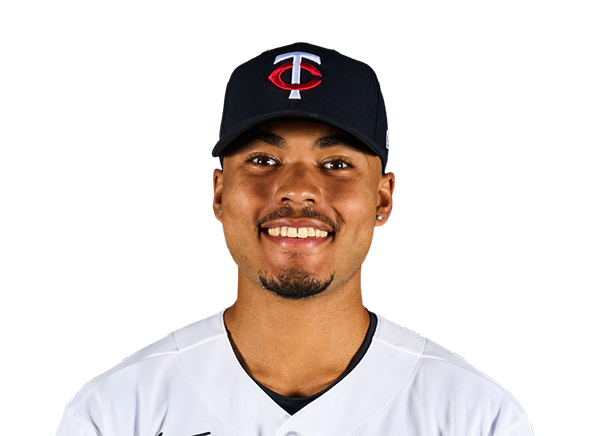
Taj Bradley
9 W
3.76 ERA
148 K
Strikeouts
Kyle Bradish
121 K
7 W
3.69 ERA
Taj Bradley
148 K
9 W
3.76 ERA
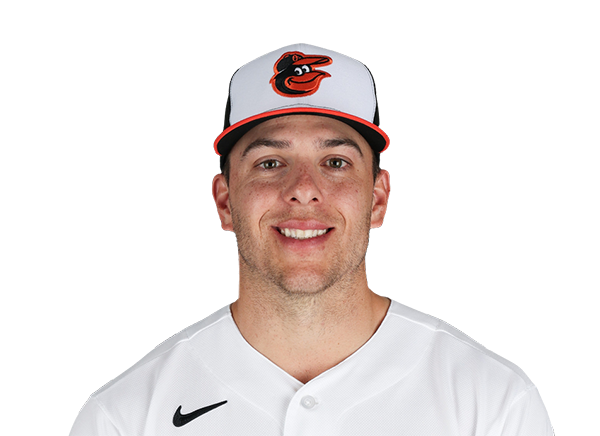
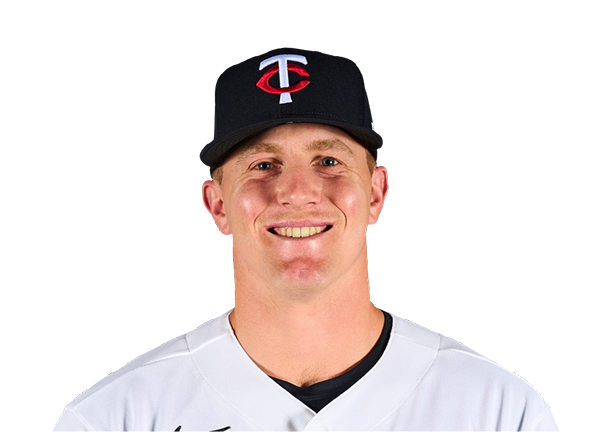
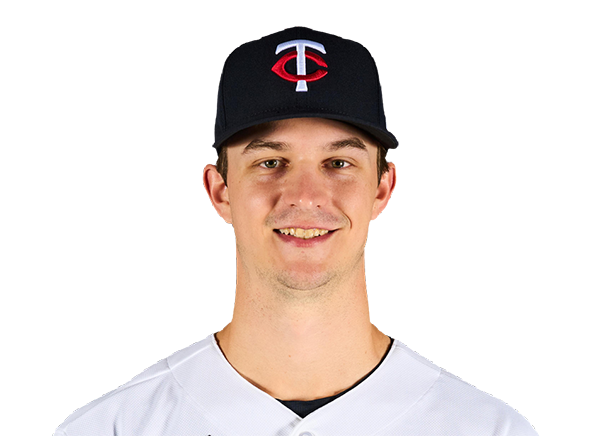
Injury Report


Team Stats
 BAL
MIN


Array
Runs
Array
11
Hits
7
1
Errors
0
—
Home Runs
—
—
Walks
—
—
Strikeouts
—
Standings
American League
| Team | W | L | PCT | GB | DIFF | STRK |
|---|---|---|---|---|---|---|
1 Rays | 76 | 53 | .589 | - | +42 | L3 |
2 White Sox | 67 | 62 | .519 | 9 | +42 | L1 |
3 Astros | 65 | 65 | .500 | 11.5 | -43 | L1 |
4 Yankees | 73 | 56 | .566 | 3 | +95 | L1 |
5 Red Sox | 70 | 59 | .543 | 6 | +98 | W2 |
6 Rangers | 64 | 66 | .492 | 12.5 | -48 | L1 |
7 Guardians | 64 | 66 | .492 | 12.5 | -14 | W3 |
8 Blue Jays | 64 | 67 | .489 | 13 | -50 | W1 |
| 9Twins | 63 | 67 | .485 | 13.5 | -47 | L2 |
| 10Orioles | 63 | 67 | .485 | 13.5 | -33 | W2 |
11 Mariners | 62 | 68 | .477 | 14.5 | -44 | W2 |
12 Tigers | 61 | 68 | .473 | 15 | +77 | L4 |
13 Royals | 57 | 74 | .435 | 20 | -95 | W7 |
14 Angels | 52 | 78 | .400 | 24.5 | -68 | W1 |
15 Athletics | 50 | 80 | .385 | 26.5 | -188 | W1 |
National League
| Team | W | L | PCT | GB | DIFF | STRK |
|---|---|---|---|---|---|---|
1 Brewers | 81 | 49 | .623 | - | +163 | W3 |
2 Dodgers | 79 | 51 | .608 | 2 | +147 | W5 |
3 Braves | 75 | 55 | .577 | 6 | +108 | L2 |
4 Cubs | 74 | 56 | .569 | 7 | +98 | L3 |
5 Phillies | 72 | 58 | .554 | 9 | +25 | W8 |
6 Padres | 70 | 60 | .538 | 11 | +9 | W2 |
7 Diamondbacks | 68 | 62 | .523 | 13 | +7 | L1 |
8 Marlins | 66 | 64 | .508 | 15 | +17 | W2 |
9 Cardinals | 66 | 65 | .504 | 15.5 | 0 | L2 |
10 Pirates | 63 | 68 | .481 | 18.5 | +29 | L2 |
11 Reds | 62 | 68 | .477 | 19 | -92 | W1 |
12 Nationals | 61 | 70 | .466 | 20.5 | +14 | L3 |
13 Mets | 59 | 71 | .454 | 22 | -39 | W1 |
14 Giants | 52 | 77 | .403 | 28.5 | -79 | L3 |
15 Rockies | 50 | 79 | .388 | 30.5 | -131 | L5 |
BAL
VS
MIN
Pitchers
Brandon Young
Catchers
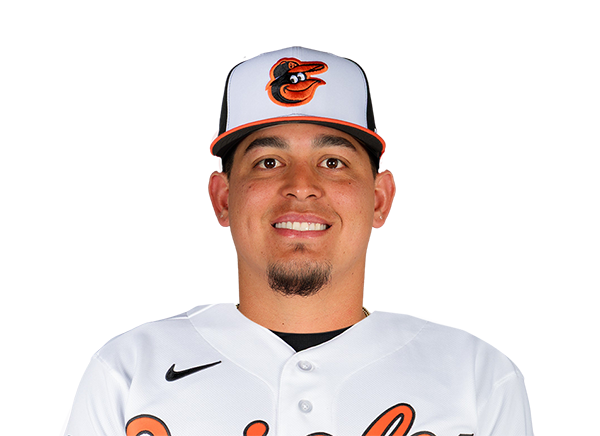
Yohel Pozo
Infielders

Gunnar Henderson
Pete Alonso
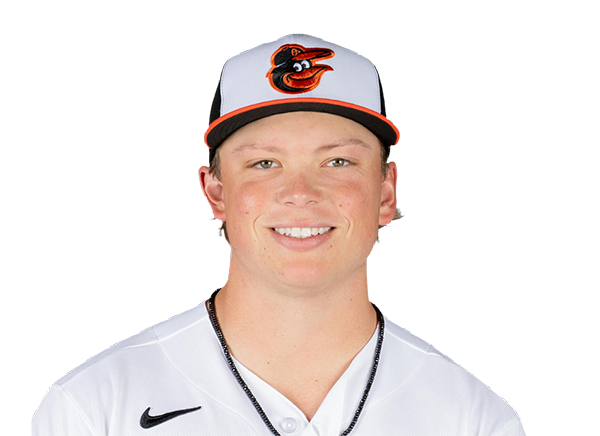
Jackson Holliday

Christian Encarnacion-Strand
Outfielders
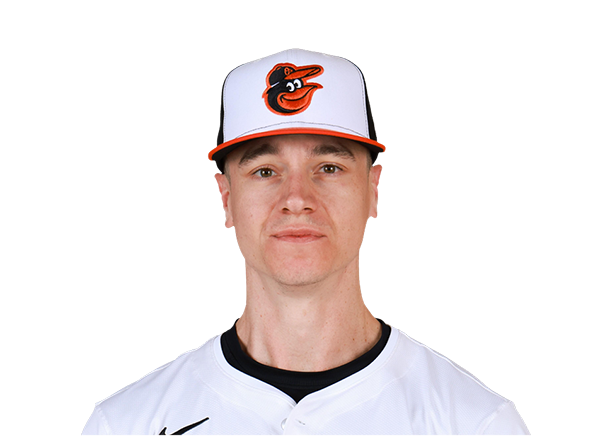
Tyler O'Neill
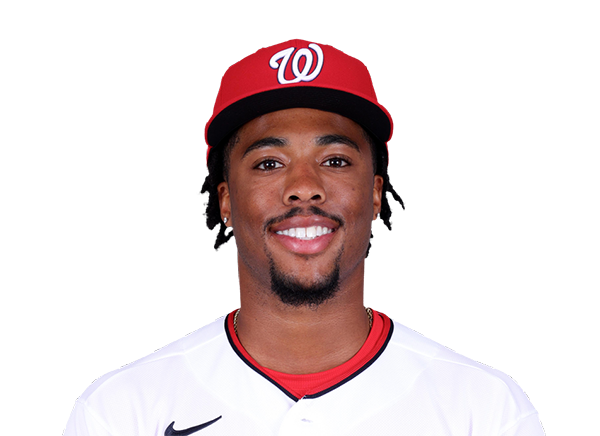
Christian Franklin
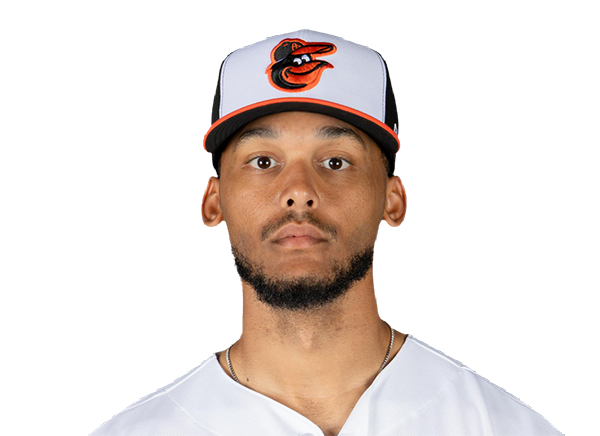
Jeremiah Jackson
Designated Hitters
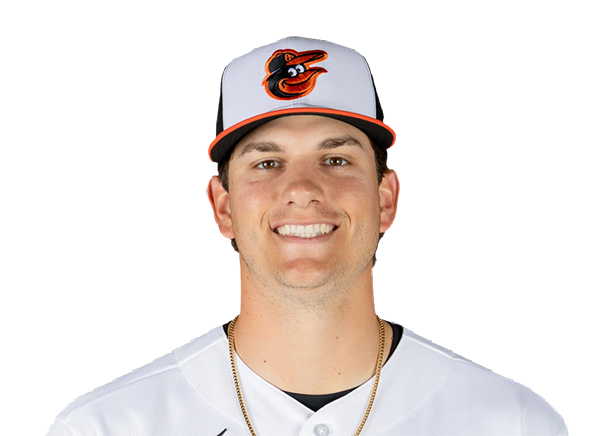
Coby Mayo
Pitchers

Bailey Ober
Catchers
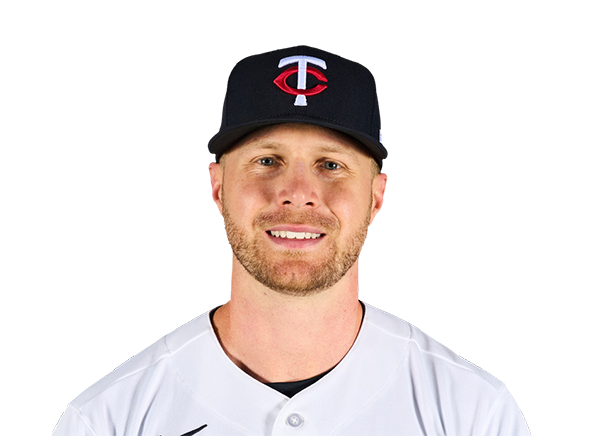
Ryan Jeffers
Infielders

Kody Clemens
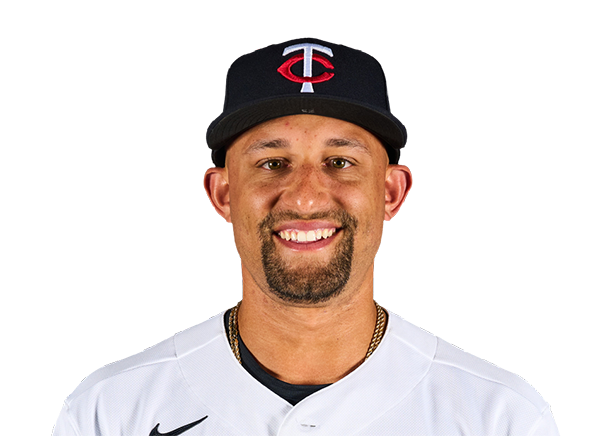
Royce Lewis
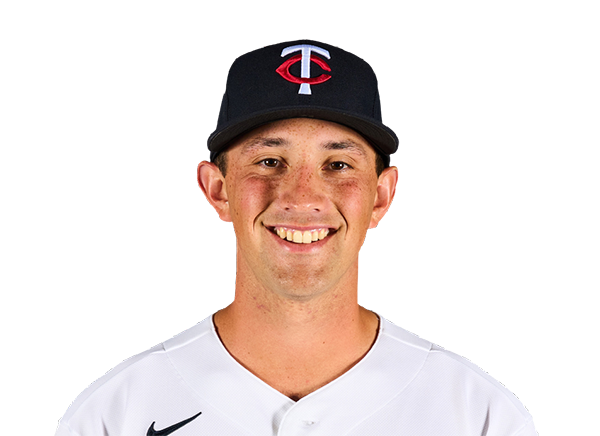
Brooks Lee
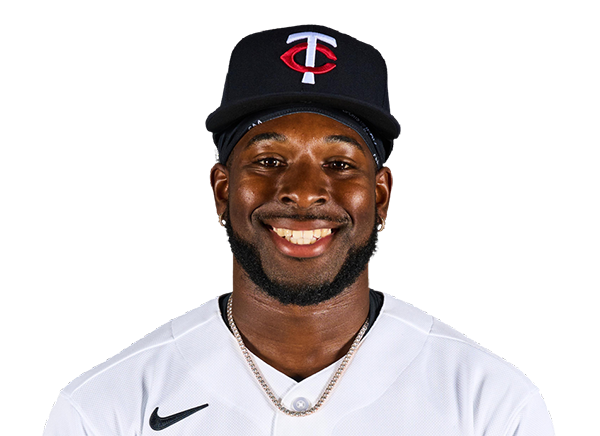
Kaelen Culpepper
Outfielders

Trevor Larnach
Luke Keaschall
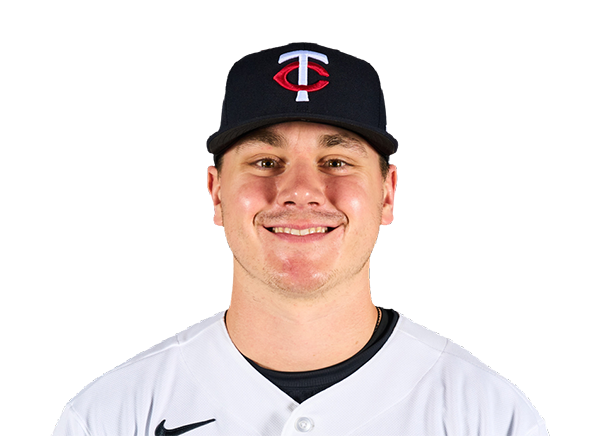
Alan Roden
Designated Hitters
Josh Bell
Orioles
VS
Twins
Batting
120
Team Games Played
121
3978
At Bats
4076
937
Hits
994
519
Runs Batted In
536
141
Home Runs
143
65
Stolen Bases
73
.236
Batting Average
.244
538
Runs
564
175
Doubles
193
18
Triples
18
1571
Total Bases
1652
463
Walks
398
1103
Strikeouts
979
.320
On Base Percentage
.319
.395
Slugging Percentage
.405
.715
OBP Pct + SLG Pct
.724
120
Games Played
121
120
Games Started
121
44
Hit By Pitch
66
0.0
Wins Above Replacement
0.0
0.0
Offensive Wins Above Replacement
0.0
27
Caught Stealing
30
1
Is Qualified
1
511.2
Runs Created
536.2
4.3
Runs Created Per 27 Outs
4.5
.102
Walks Per Plate Appearance
.087
0.42
Walk To Strikeout Ratio
0.41
.159
Isolated Power
.161
.285
Secondary Average
.270
3.99
Pitches Per Plate Appearance
3.87
334
Extra Base Hits
354
4532
Plate Appearances
4582
28.2
At Bats Per Home Run
28.5
15
Sacrifice Hit
6
30
Sacrifice Flies
35
Pitching
120
Team Games Played
121
47
Quality Starts
43
58
Wins
59
62
Losses
62
31
Saves
33
63
Holds
77
1029
Hits
1030
499
Earned runs
545
129
Home Runs
139
401
Walks
440
952
Strikeouts
998
8.0
Strikeouts Per 9 Innings
8.4
145.7
Pitches Per Start
149.8
1.34
Walks Plus Hits Per Inning Pitched
1.38
4.21
Earned Run Average
4.59
62
Losses
62
1066.2
Innings pitched
1067.2
.483
Win Percentage
.488
47
Save Opportunities
45
.252
Opponent Batting Average
.252
.321
Opponent's On-base pct.
.330
.409
Opponent's Slugging pct.
.412
.730
Opponent's OPB Pct + SLG Pct
.742
4081
At Bats
4094
213
Doubles
210
21
Triples
15
33
Batters Hit
55
61
Stolen Bases
107
120
Games Played
121
1
Complete Games
1
2
Shutouts
3
38
Wild Pitches
31
547
Runs Batted In
571
2
Balks
5
1066.2
Innings pitched
1067.2
8.0
Strikeouts Per 9 Innings
8.4
27
Caught Stealing
19
120
Games Started
121
0.0
Wins Above Replacement
0.0
1
Is Qualified
1
572
Runs
598
499
Earned Runs
545
1671
Total Bases
1687
Fielding
120
Team Games Played
121
1067
Full Innings
1068
4315
Total Chances
4182
3200
Putouts
3203
1036
Assists
921
79
Errors
58
175
Double Plays
193
0.982
Fielding Percentage
0.986
35.7
Range Factor
34.8
0.0
Zone Rating
0.0
120
Games Played
121
0
Games Started
0
0.0
Defensive Wins Above Replacement
0.0
1
Qualified
1