

Orioles vs Twins Live Score (12 Aug, 2026)
Game Information
Stage
Standard
Season
2026
First Pitch
Wed, Aug 12, 1:40 pm
Venue
Target Field
Location
Minneapolis, Minnesota
Attendance
20,160
Home Runs
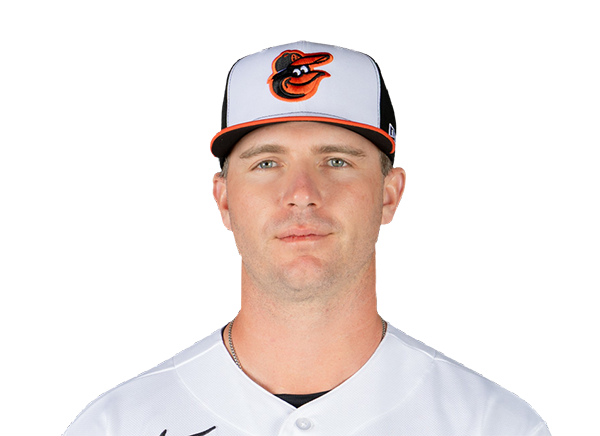
Pete Alonso
26 HR
.256 AVG
77 RBI
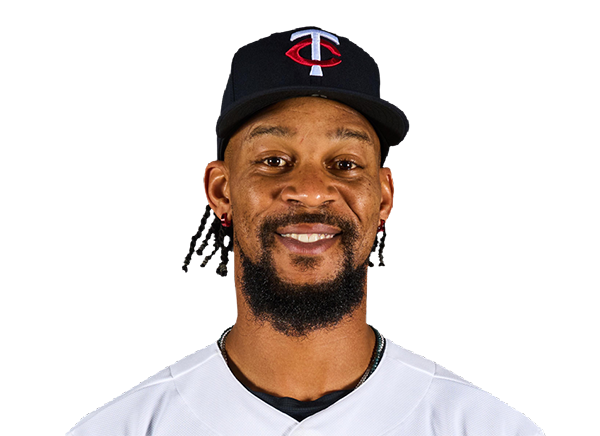
Byron Buxton
25 HR
.263 AVG
45 RBI
Batting Average
Pete Alonso
.256 AVG
.350 OBP
.479 SLG
Luke Keaschall
.265 AVG
.361 OBP
.361 SLG

Runs Batted In
Pete Alonso
77 RBI
26 HR
.256 AVG
Josh Bell
71 RBI
16 HR
.251 AVG
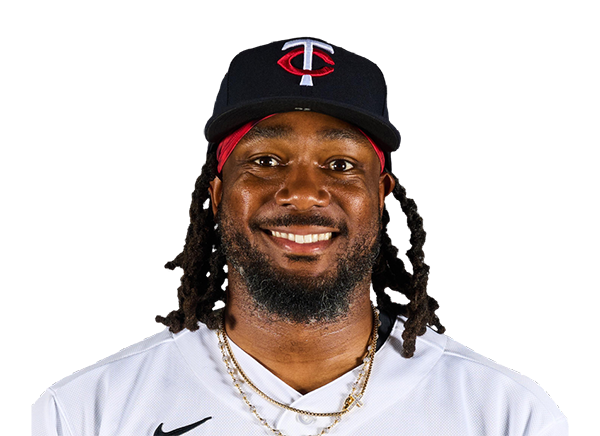
Earned Run Average
Kyle Bradish
3.69 ERA
7 W
121 K

Joe Ryan
3.65 ERA
6 W
138 K
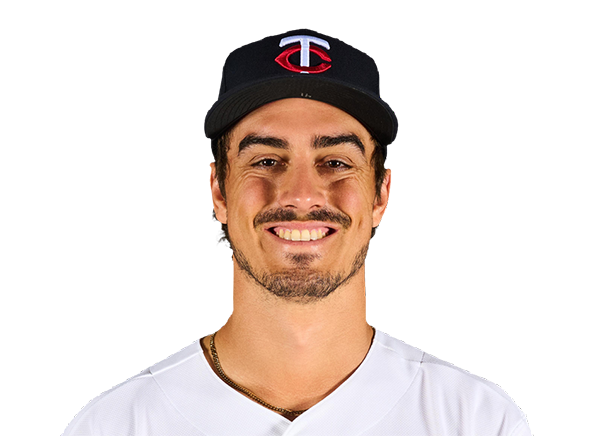
Wins
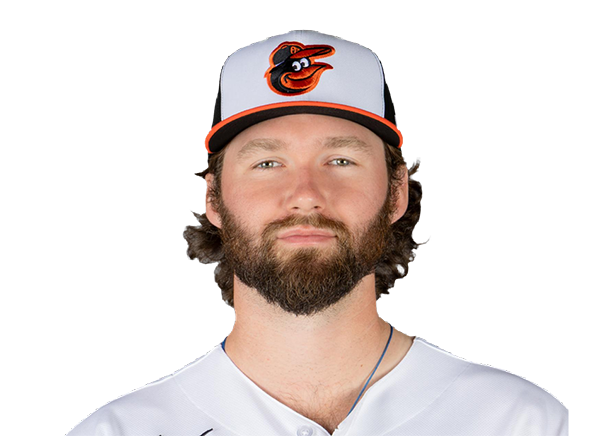
Brandon Young
9 W
3.33 ERA
93 K
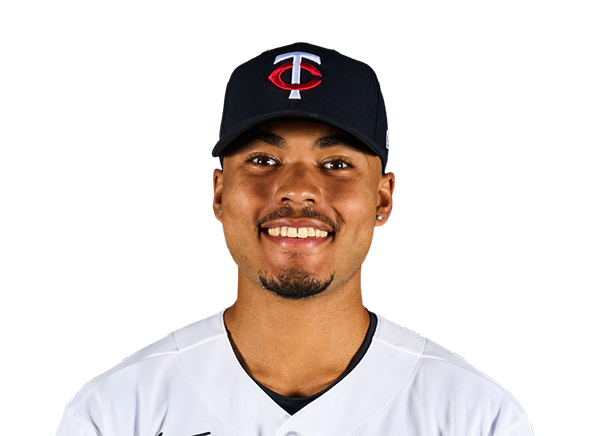
Taj Bradley
9 W
3.76 ERA
148 K
Strikeouts
Kyle Bradish
121 K
7 W
3.69 ERA
Taj Bradley
148 K
9 W
3.76 ERA
Injury Report

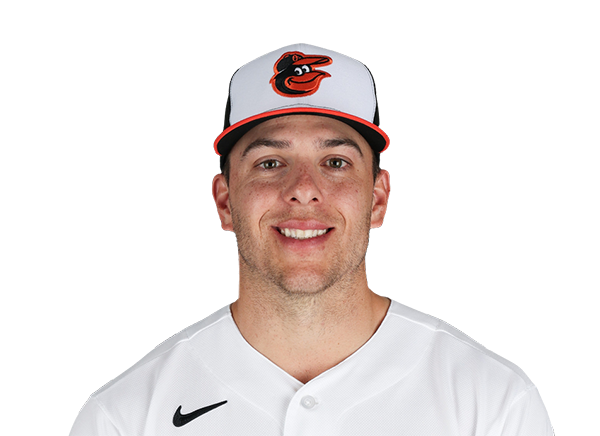
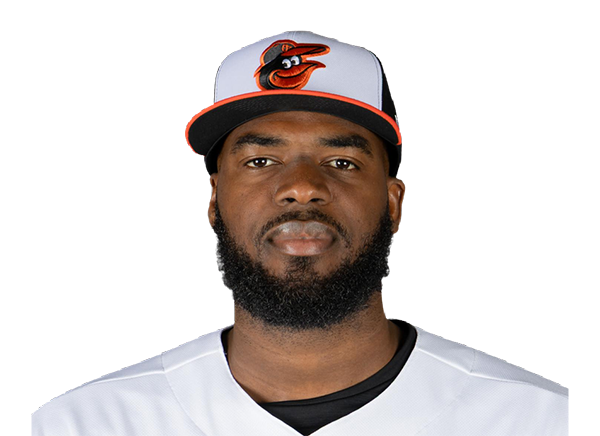

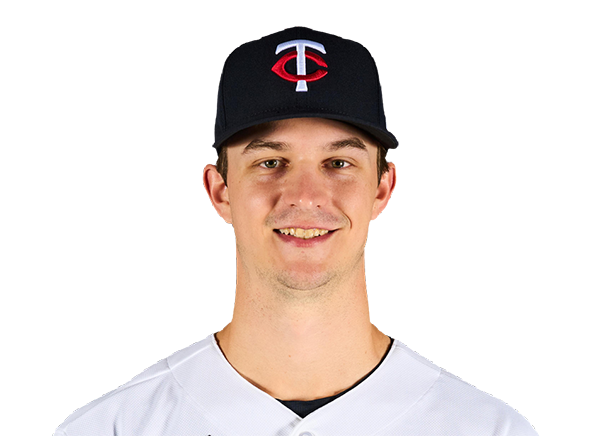
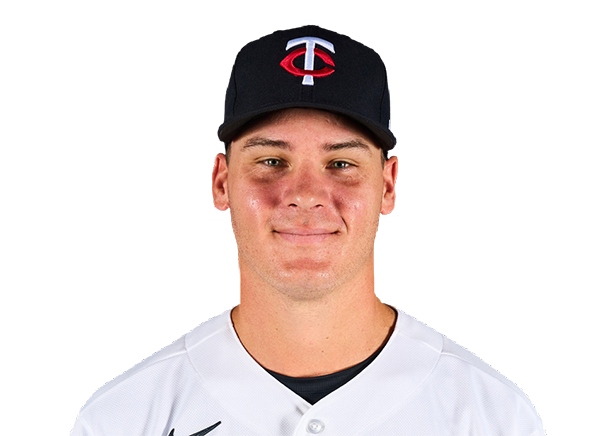
Team Stats
 BAL
MIN


Array
Runs
Array
7
Hits
14
0
Errors
0
—
Home Runs
—
—
Walks
—
—
Strikeouts
—
Standings
American League
| Team | W | L | PCT | GB | DIFF | STRK |
|---|---|---|---|---|---|---|
1 Rays | 76 | 53 | .589 | - | +42 | L3 |
2 White Sox | 67 | 62 | .519 | 9 | +42 | L1 |
3 Astros | 65 | 65 | .500 | 11.5 | -43 | L1 |
4 Yankees | 73 | 56 | .566 | 3 | +95 | L1 |
5 Red Sox | 70 | 59 | .543 | 6 | +98 | W2 |
6 Rangers | 64 | 66 | .492 | 12.5 | -48 | L1 |
7 Guardians | 64 | 66 | .492 | 12.5 | -14 | W3 |
8 Blue Jays | 64 | 67 | .489 | 13 | -50 | W1 |
| 9Twins | 63 | 67 | .485 | 13.5 | -47 | L2 |
| 10Orioles | 63 | 67 | .485 | 13.5 | -33 | W2 |
11 Mariners | 62 | 68 | .477 | 14.5 | -44 | W2 |
12 Tigers | 61 | 68 | .473 | 15 | +77 | L4 |
13 Royals | 57 | 74 | .435 | 20 | -95 | W7 |
14 Angels | 52 | 78 | .400 | 24.5 | -68 | W1 |
15 Athletics | 50 | 80 | .385 | 26.5 | -188 | W1 |
National League
| Team | W | L | PCT | GB | DIFF | STRK |
|---|---|---|---|---|---|---|
1 Brewers | 81 | 49 | .623 | - | +163 | W3 |
2 Dodgers | 79 | 51 | .608 | 2 | +147 | W5 |
3 Braves | 75 | 55 | .577 | 6 | +108 | L2 |
4 Cubs | 74 | 56 | .569 | 7 | +98 | L3 |
5 Phillies | 72 | 58 | .554 | 9 | +25 | W8 |
6 Padres | 70 | 60 | .538 | 11 | +9 | W2 |
7 Diamondbacks | 68 | 62 | .523 | 13 | +7 | L1 |
8 Marlins | 66 | 64 | .508 | 15 | +17 | W2 |
9 Cardinals | 66 | 65 | .504 | 15.5 | 0 | L2 |
10 Pirates | 63 | 68 | .481 | 18.5 | +29 | L2 |
11 Reds | 62 | 68 | .477 | 19 | -92 | W1 |
12 Nationals | 61 | 70 | .466 | 20.5 | +14 | L3 |
13 Mets | 59 | 71 | .454 | 22 | -39 | W1 |
14 Giants | 52 | 77 | .403 | 28.5 | -79 | L3 |
15 Rockies | 50 | 79 | .388 | 30.5 | -131 | L5 |
BAL
VS
MIN
Pitchers

Shane Baz
Catchers
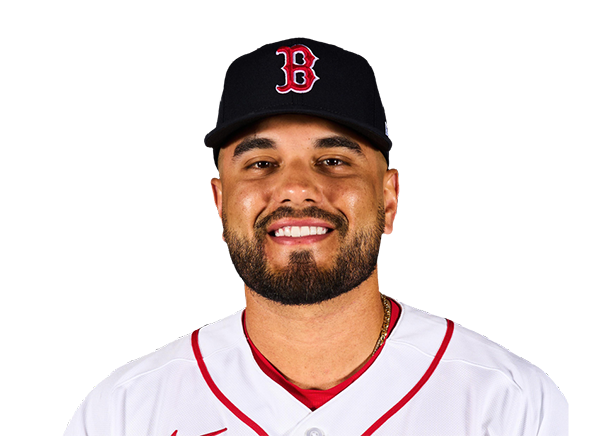
Carlos Narvaez
Infielders

Gunnar Henderson
Pete Alonso
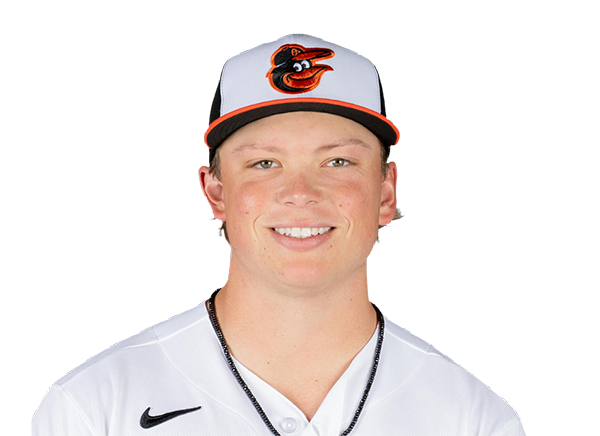
Jackson Holliday

Christian Encarnacion-Strand
Outfielders
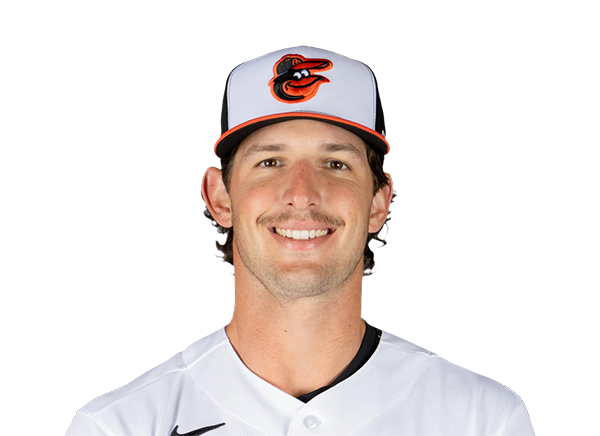
Dylan Beavers
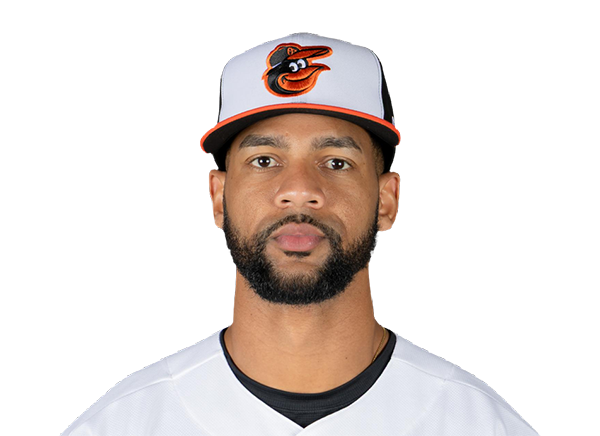
Leody Taveras
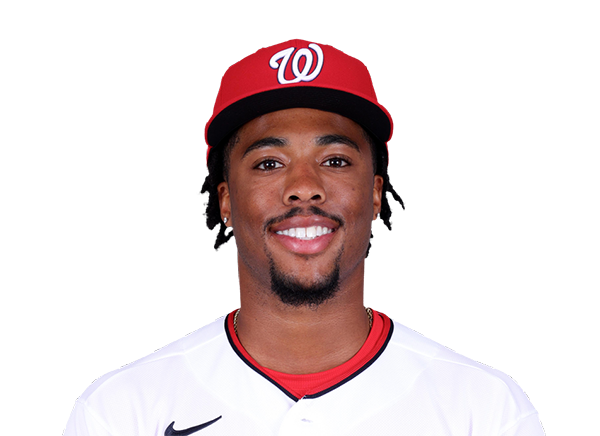
Christian Franklin
Designated Hitters
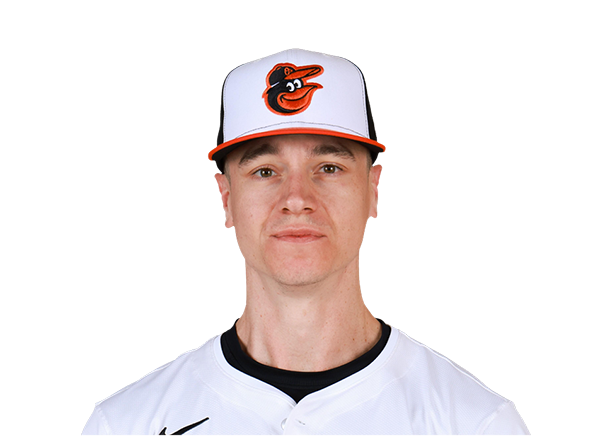
Tyler O'Neill
Pitchers
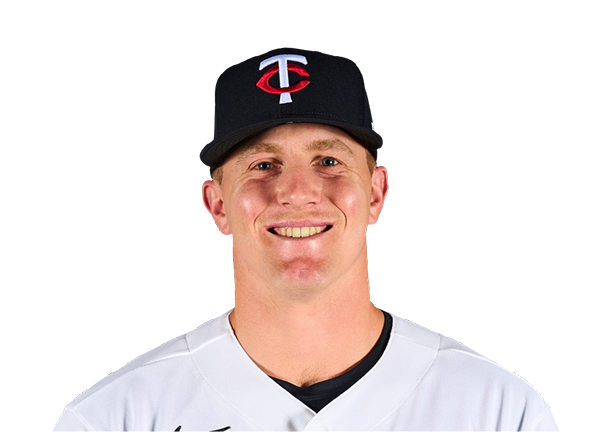
Zebby Matthews
Catchers
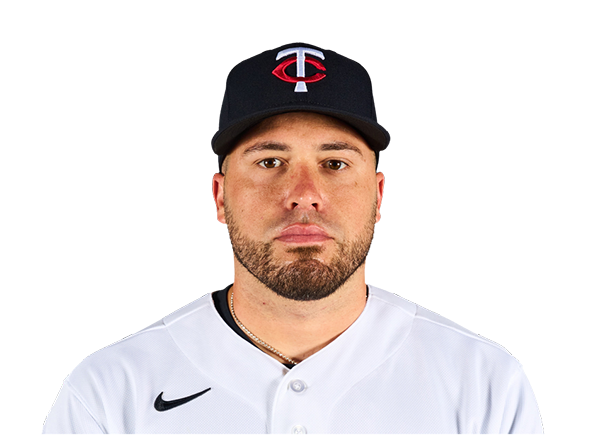
Victor Caratini
Infielders
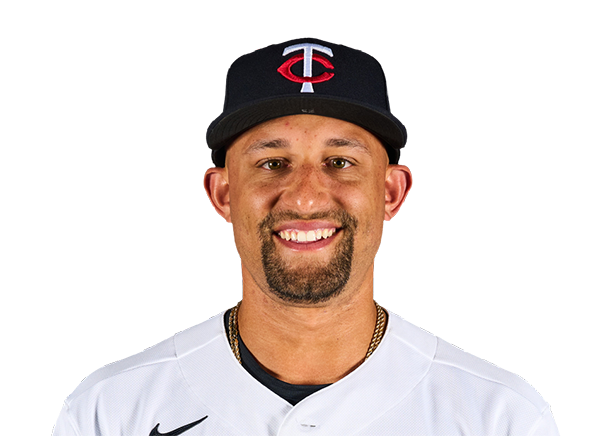
Royce Lewis

Kody Clemens
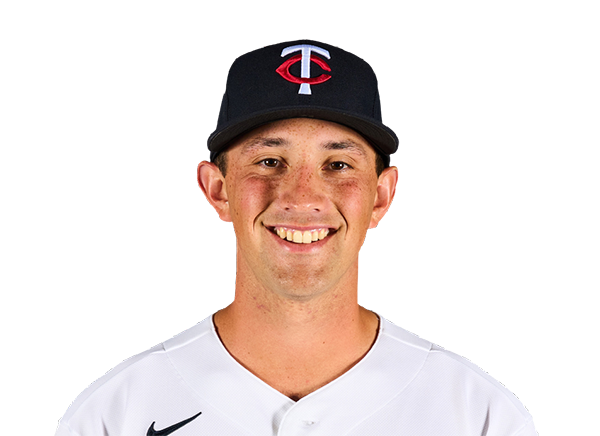
Brooks Lee
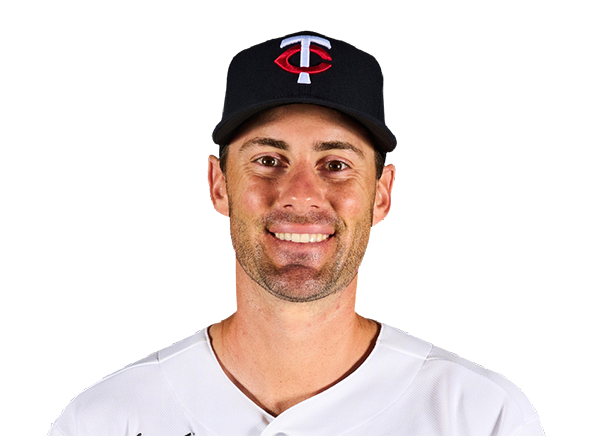
Ryan Kreidler
Outfielders

Trevor Larnach
Luke Keaschall
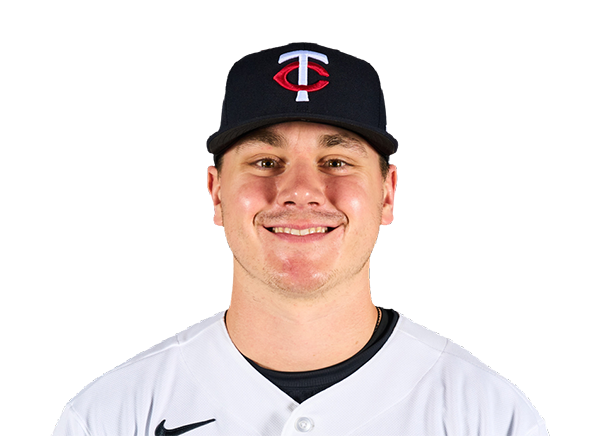
Alan Roden
Designated Hitters
Josh Bell
Orioles
VS
Twins
Batting
121
Team Games Played
122
4010
At Bats
4113
944
Hits
1008
524
Runs Batted In
543
143
Home Runs
143
65
Stolen Bases
73
.235
Batting Average
.245
543
Runs
571
175
Doubles
197
18
Triples
18
1584
Total Bases
1670
468
Walks
400
1112
Strikeouts
986
.320
On Base Percentage
.319
.395
Slugging Percentage
.406
.715
OBP Pct + SLG Pct
.725
121
Games Played
122
121
Games Started
122
44
Hit By Pitch
66
0.0
Wins Above Replacement
0.0
0.0
Offensive Wins Above Replacement
0.0
27
Caught Stealing
30
1
Is Qualified
1
515.3
Runs Created
543.4
4.3
Runs Created Per 27 Outs
4.5
.102
Walks Per Plate Appearance
.087
0.42
Walk To Strikeout Ratio
0.41
.160
Isolated Power
.161
.286
Secondary Average
.269
3.99
Pitches Per Plate Appearance
3.87
336
Extra Base Hits
358
4569
Plate Appearances
4622
28.0
At Bats Per Home Run
28.8
15
Sacrifice Hit
6
30
Sacrifice Flies
36
Pitching
121
Team Games Played
122
47
Quality Starts
43
58
Wins
60
63
Losses
62
31
Saves
34
63
Holds
80
1043
Hits
1037
506
Earned runs
550
129
Home Runs
141
403
Walks
445
959
Strikeouts
1007
8.0
Strikeouts Per 9 Innings
8.4
145.6
Pitches Per Start
149.9
1.35
Walks Plus Hits Per Inning Pitched
1.38
4.24
Earned Run Average
4.60
63
Losses
62
1074.2
Innings pitched
1076.2
.479
Win Percentage
.492
47
Save Opportunities
46
.253
Opponent Batting Average
.251
.321
Opponent's On-base pct.
.330
.410
Opponent's Slugging pct.
.412
.731
Opponent's OPB Pct + SLG Pct
.742
4118
At Bats
4126
217
Doubles
210
21
Triples
15
33
Batters Hit
55
61
Stolen Bases
107
121
Games Played
122
1
Complete Games
1
2
Shutouts
3
38
Wild Pitches
32
554
Runs Batted In
576
2
Balks
5
1074.2
Innings pitched
1076.2
8.0
Strikeouts Per 9 Innings
8.4
27
Caught Stealing
19
121
Games Started
122
0.0
Wins Above Replacement
0.0
1
Is Qualified
1
579
Runs
603
506
Earned Runs
550
1689
Total Bases
1700
Fielding
121
Team Games Played
122
1075
Full Innings
1077
4342
Total Chances
4219
3224
Putouts
3230
1039
Assists
931
79
Errors
58
175
Double Plays
197
0.982
Fielding Percentage
0.986
35.7
Range Factor
34.8
0.0
Zone Rating
0.0
121
Games Played
122
0
Games Started
0
0.0
Defensive Wins Above Replacement
0.0
1
Qualified
1