

Padres vs Brewers Live Score (4 Oct, 2026)
Game Information
Stage
QTR
Season
2026
First Pitch
Sat, Oct 3, 8:30 pm
Venue
American Family Field
Location
Milwaukee, Wisconsin
Venue Type
Indoor
Broadcast
FS1
Attendance
42,843
Live Situation
0Balls
1Strikes
0Outs
—Pitcher
—At Bat
Pitch Sequence
1
STRIKE LOOKING
Four-seam FB
98 MPH
2
BALL IN PLAY
Four-seam FB
99 MPH
Injury Report
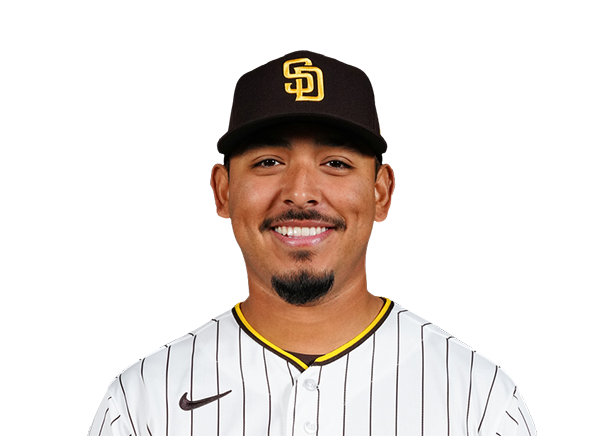

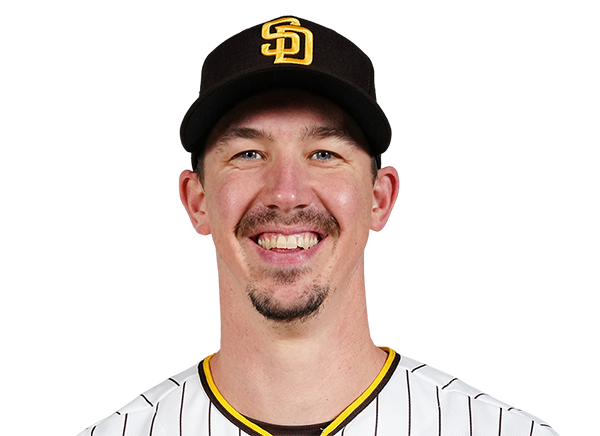

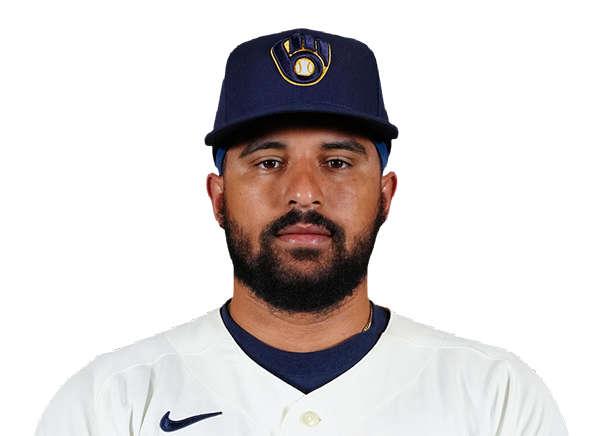
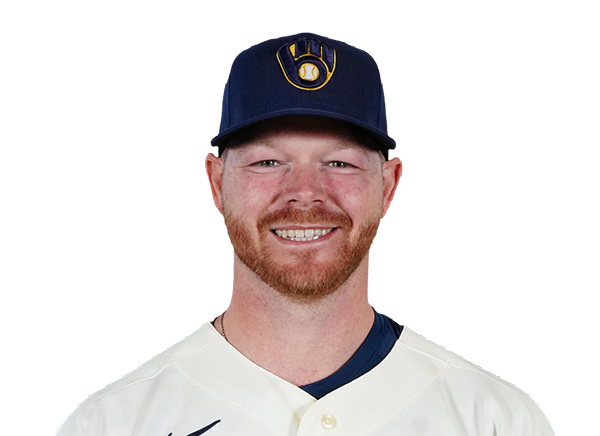


Team Stats
 SD
MIL


2
Runs
3
9
Hits
7
1
Errors
0
0
Home Runs
2
4
Walks
4
9
Strikeouts
6
Player Box Score
San Diego Padres
| Player | H-AB | AB | R | H | RBI | HR | BB | K | #P | AVG | OBP | SLG |
|---|---|---|---|---|---|---|---|---|---|---|---|---|
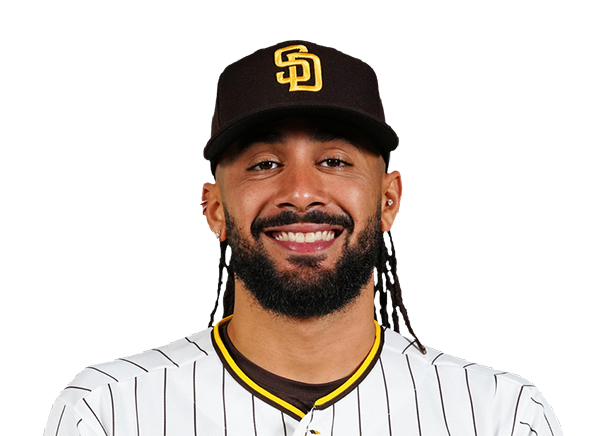 Fernando Tatis Jr. | 1-5 | 5 | 0 | 1 | 0 | 0 | 0 | 2 | 16 | .250 | .308 | .500 |
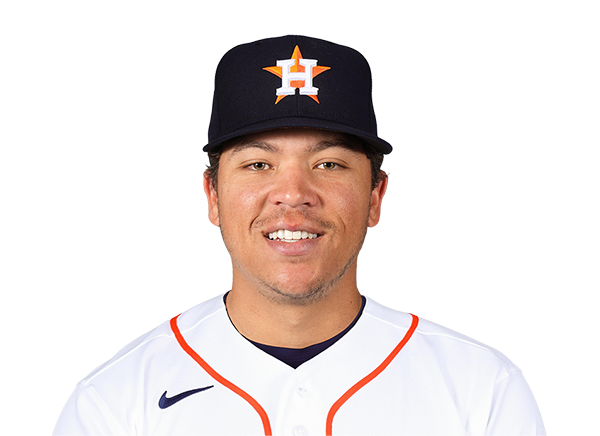 Dustin Harris | 2-4 | 4 | 0 | 2 | 0 | 0 | 1 | 0 | 32 | .300 | .364 | .300 |
 Manny Machado | 2-4 | 4 | 0 | 2 | 0 | 0 | 1 | 1 | 21 | .455 | .538 | .909 |
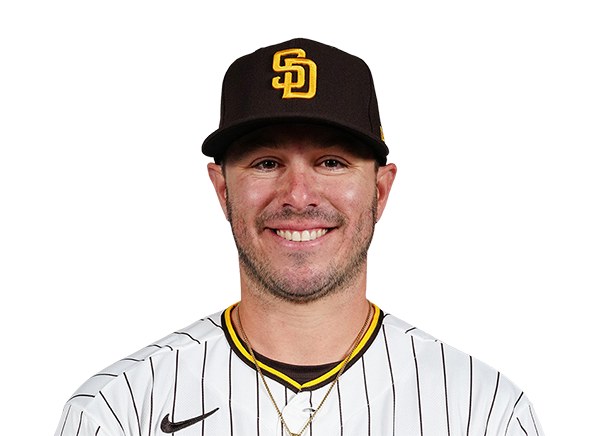 Ty France | 1-4 | 4 | 0 | 1 | 0 | 0 | 0 | 1 | 12 | .417 | .462 | .500 |
 Jackson Merrill | 0-5 | 5 | 0 | 0 | 0 | 0 | 0 | 2 | 19 | .333 | .385 | .333 |
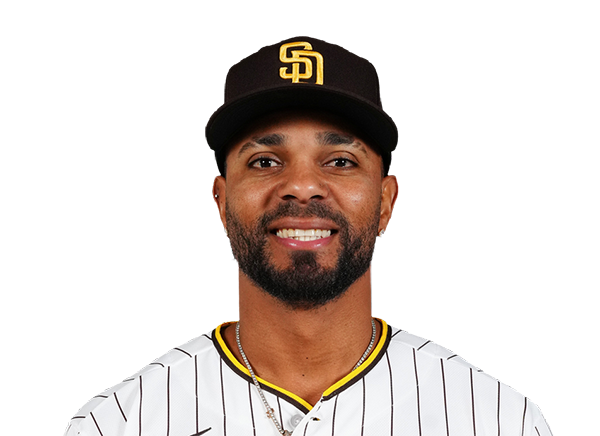 Xander Bogaerts | 1-3 | 3 | 1 | 1 | 0 | 0 | 1 | 0 | 18 | .455 | .500 | .818 |
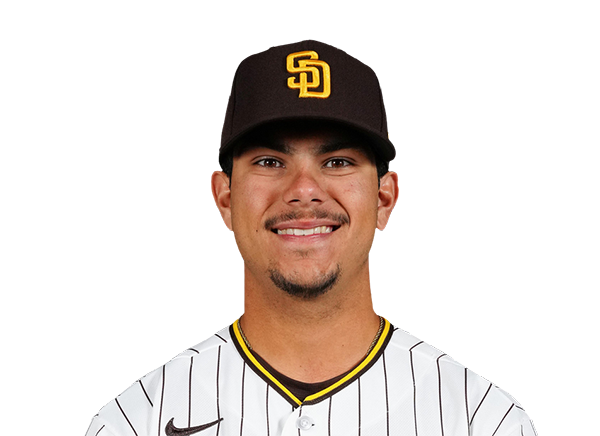 Ethan Salas | 1-3 | 3 | 1 | 1 | 0 | 0 | 0 | 1 | 13 | .250 | .200 | .250 |
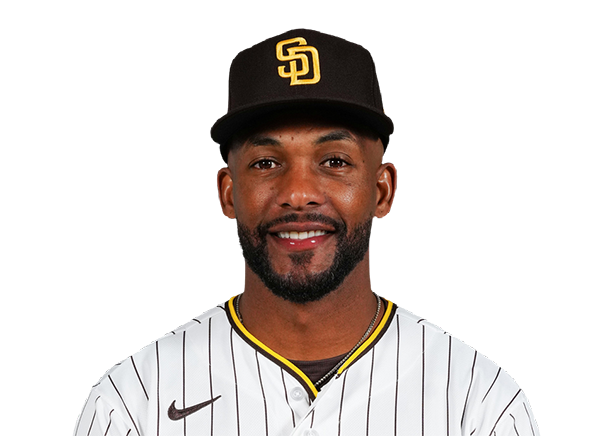 Miguel Andujar | 0-1 | 1 | 0 | 0 | 0 | 0 | 0 | 0 | 2 | .000 | .000 | .000 |
 Samad Taylor | 0-0 | 0 | 0 | 0 | 0 | 0 | 0 | 0 | 0 | .000 | .000 | .000 |
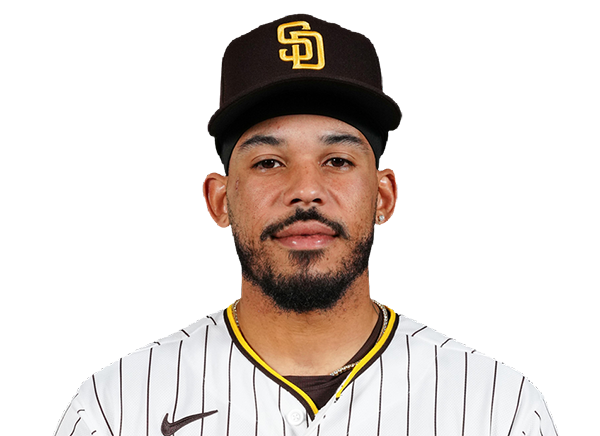 Luis Campusano | 1-3 | 3 | 0 | 1 | 1 | 0 | 1 | 0 | 16 | .286 | .375 | .286 |
 Jase Bowen | 0-0 | 0 | 0 | 0 | 0 | 0 | 0 | 0 | 0 | .000 | .000 | .000 |
 Jake Cronenworth | 0-3 | 3 | 0 | 0 | 1 | 0 | 0 | 2 | 21 | .111 | .200 | .111 |
 Austin Hays | 0-1 | 1 | 0 | 0 | 0 | 0 | 0 | 0 | 5 | .000 | .000 | .000 |
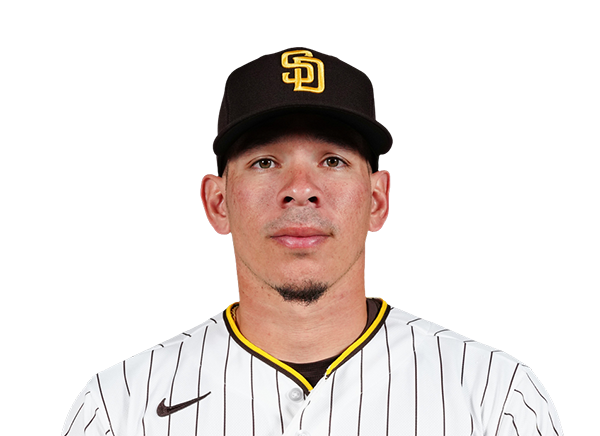 Freddy Fermin | 0-0 | 0 | 0 | 0 | 0 | 0 | 0 | 0 | 0 | .000 | .000 | .000 |
Milwaukee Brewers
| Player | H-AB | AB | R | H | RBI | HR | BB | K | #P | AVG | OBP | SLG |
|---|---|---|---|---|---|---|---|---|---|---|---|---|
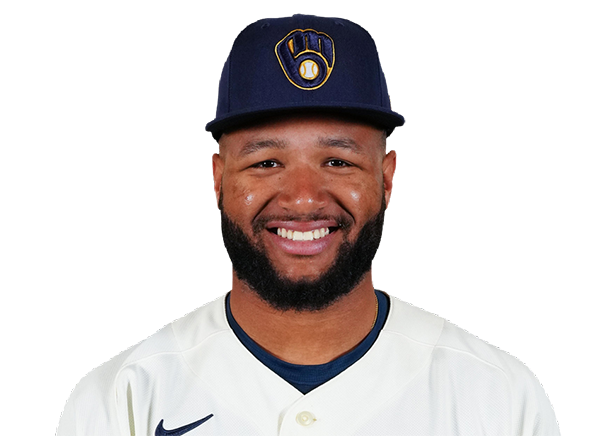 Jackson Chourio | 1-4 | 4 | 1 | 1 | 2 | 1 | 0 | 0 | 7 | .250 | .250 | 1.000 |
 Brice Turang | 0-3 | 3 | 0 | 0 | 0 | 0 | 1 | 1 | 14 | .000 | .250 | .000 |
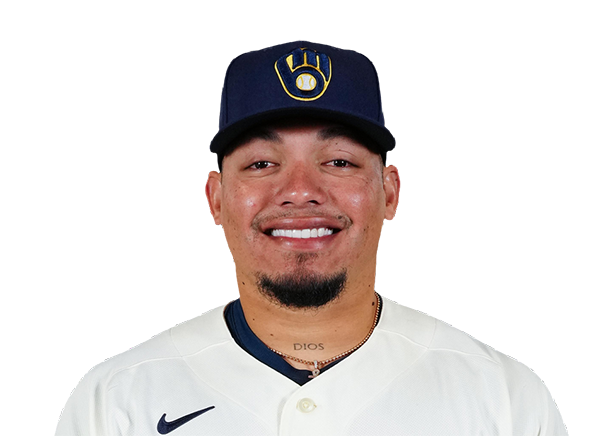 William Contreras | 1-3 | 3 | 1 | 1 | 1 | 1 | 1 | 0 | 15 | .333 | .500 | 1.333 |
 Jake Bauers | 2-3 | 3 | 0 | 2 | 0 | 0 | 0 | 0 | 10 | .667 | .750 | .667 |
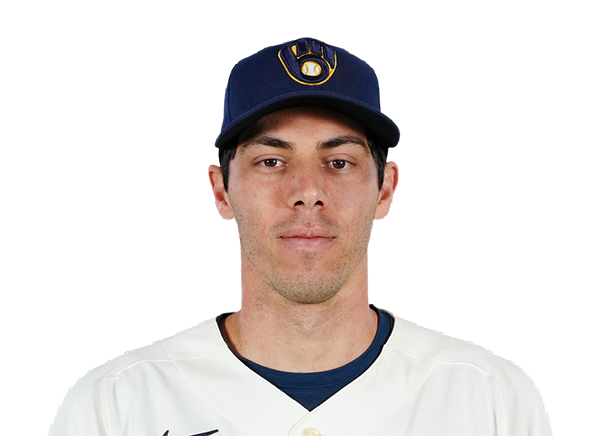 Christian Yelich | 1-3 | 3 | 0 | 1 | 0 | 0 | 0 | 0 | 12 | .333 | .333 | .333 |
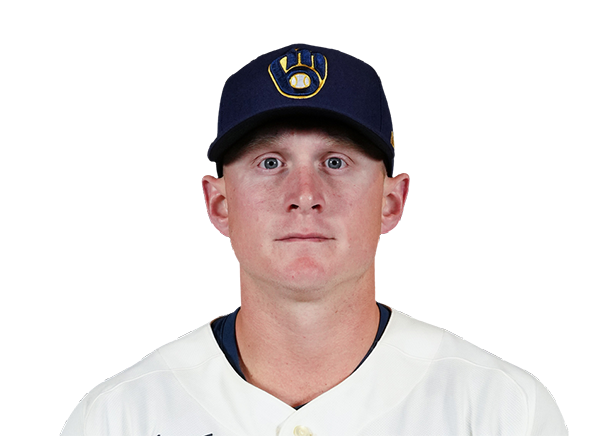 Andrew Vaughn | 1-1 | 1 | 0 | 1 | 0 | 0 | 0 | 0 | 6 | 1.000 | 1.000 | 1.000 |
 Cooper Pratt | 0-4 | 4 | 0 | 0 | 0 | 0 | 0 | 2 | 18 | .000 | .000 | .000 |
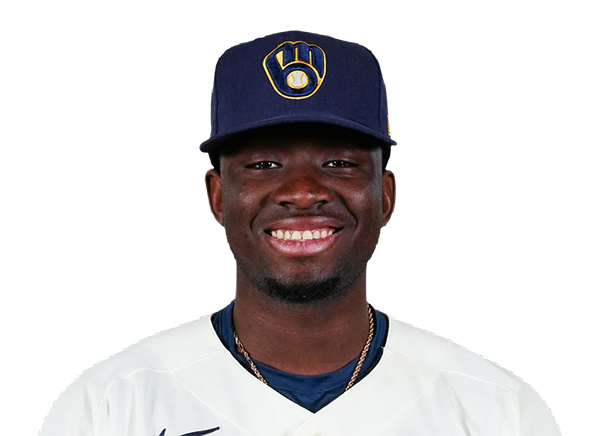 Luis Lara | 0-3 | 3 | 0 | 0 | 0 | 0 | 1 | 0 | 12 | .000 | .250 | .000 |
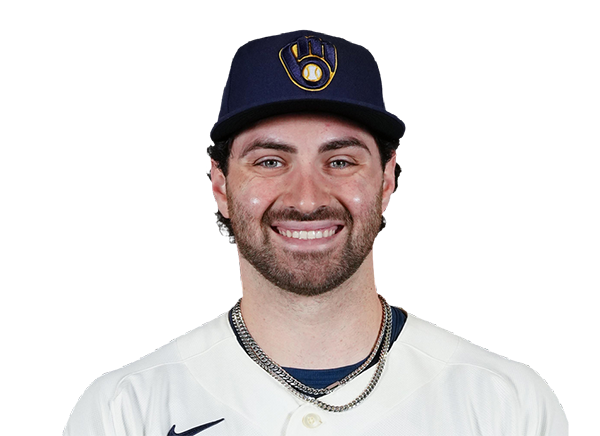 Garrett Mitchell | 1-3 | 3 | 1 | 1 | 0 | 0 | 1 | 1 | 17 | .333 | .500 | .333 |
 Joey Ortiz | 0-4 | 4 | 0 | 0 | 0 | 0 | 0 | 2 | 15 | .000 | .000 | .000 |
San Diego Padres
| Player | IP | H | R | ER | BB | K | HR | PC-ST | ERA | PC |
|---|---|---|---|---|---|---|---|---|---|---|
 Robbie Ray | 2.2 | 4 | 2 | 2 | 2 | 1 | 1 | 45-26 | 6.75 | 45 |
 Bradgley Rodriguez | 1.1 | 0 | 0 | 0 | 1 | 2 | 0 | 19-14 | 0.00 | 19 |
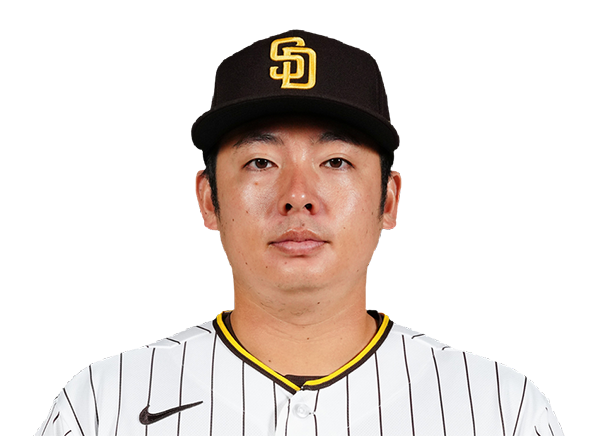 Yuki Matsui | 1.0 | 0 | 0 | 0 | 0 | 1 | 0 | 15-8 | 0.00 | 15 |
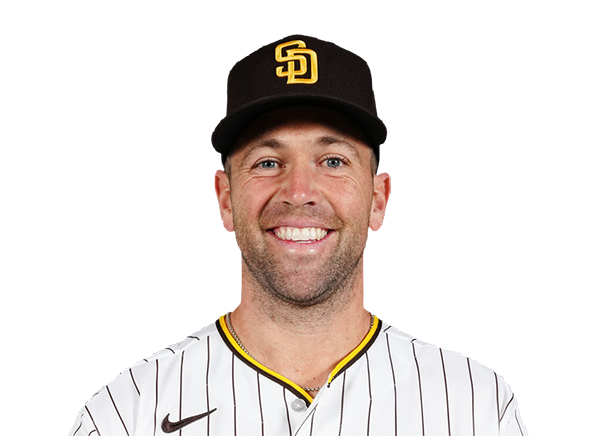 Jason Adam | 1.0 | 0 | 0 | 0 | 1 | 0 | 0 | 16-9 | 0.00 | 16 |
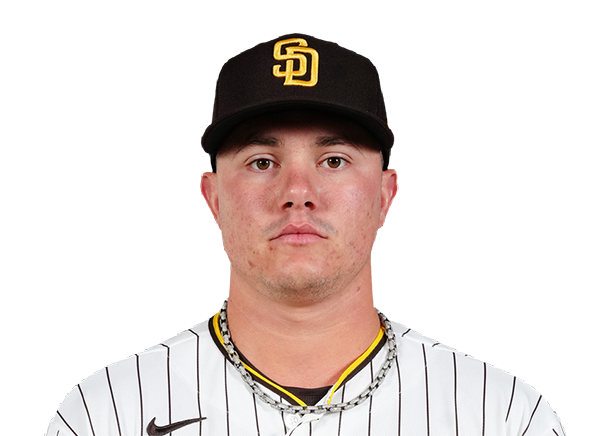 Adrian Morejon | 2.0 | 3 | 1 | 1 | 0 | 2 | 1 | 31-20 | 2.25 | 31 |
Milwaukee Brewers
| Player | IP | H | R | ER | BB | K | HR | PC-ST | ERA | PC |
|---|---|---|---|---|---|---|---|---|---|---|
 Jacob Misiorowski | 4.0 | 4 | 2 | 2 | 1 | 6 | 0 | 88-64 | 4.50 | 88 |
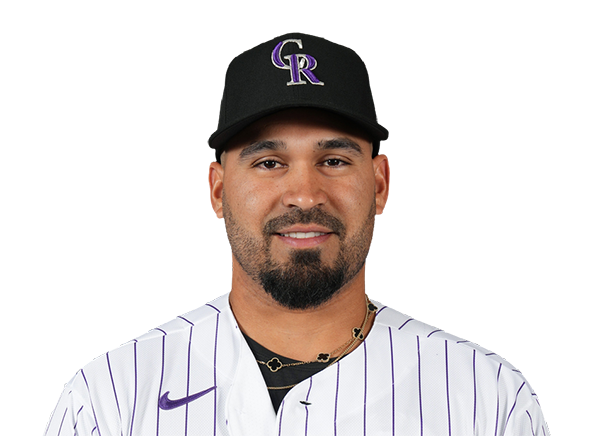 Antonio Senzatela | 0.2 | 2 | 0 | 0 | 1 | 0 | 0 | 11-6 | 0.00 | 11 |
 Aaron Ashby | 1.2 | 0 | 0 | 0 | 0 | 1 | 0 | 23-15 | 0.00 | 23 |
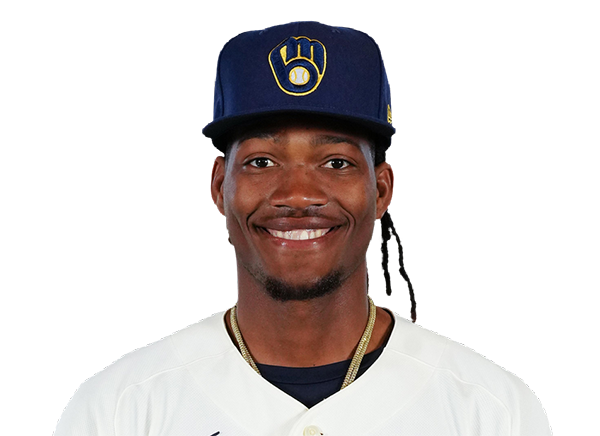 Abner Uribe | 0.1 | 2 | 0 | 0 | 0 | 0 | 0 | 16-8 | 0.00 | 16 |
 DL Hall | 1.0 | 0 | 0 | 0 | 2 | 0 | 0 | 20-9 | 0.00 | 20 |
 Trevor Megill | 1.1 | 1 | 0 | 0 | 0 | 2 | 0 | 17-13 | 0.00 | 17 |
H2H / Season Series
MIL3–2
SD
SD4–3
MIL
SD11–2
MIL
SD3–2
MIL
MIL7–1
SD
MIL1–3
SD
MIL6–4
SD
MIL6–1
SD
SD7–5
MIL
Last 5 Games
| Date | Opponent | Result |
|---|---|---|
| Oct 3 | @ MIL | L2–3 |
| Sep 30 |  vs CHC | W4–1 |
| Sep 29 | vs CHC | W8–0 |
| Date | Opponent | Result |
|---|---|---|
| Oct 3 | vs SD | W3–2 |
Standings
American League
| Team | W | L | PCT | GB | DIFF | STRK |
|---|---|---|---|---|---|---|
1 Rays | 98 | 64 | .605 | - | +86 | L1 |
2 Guardians | 85 | 77 | .525 | 13 | +11 | L1 |
3 Astros | 81 | 81 | .500 | 17 | -32 | W2 |
4 Yankees | 93 | 68 | .578 | 4.5 | +138 | W1 |
5 Red Sox | 87 | 75 | .537 | 11 | +78 | L1 |
6 White Sox | 84 | 78 | .519 | 14 | +56 | W1 |
7 Rangers | 80 | 82 | .494 | 18 | -46 | L1 |
8 Orioles | 79 | 82 | .491 | 18.5 | -21 | L1 |
9 Blue Jays | 79 | 83 | .488 | 19 | -46 | W1 |
10 Twins | 77 | 85 | .475 | 21 | -58 | W1 |
11 Tigers | 76 | 86 | .469 | 22 | +71 | L1 |
12 Mariners | 76 | 86 | .469 | 22 | -58 | W2 |
13 Royals | 69 | 93 | .426 | 29 | -120 | W1 |
14 Athletics | 64 | 98 | .395 | 34 | -238 | L2 |
15 Angels | 62 | 100 | .383 | 36 | -97 | L2 |
National League
| Team | W | L | PCT | GB | DIFF | STRK |
|---|---|---|---|---|---|---|
| 1Brewers | 103 | 59 | .636 | - | +214 | W5 |
2 Dodgers | 100 | 62 | .617 | 3 | +201 | W3 |
3 Braves | 94 | 68 | .580 | 9 | +116 | L1 |
| 4Padres | 91 | 71 | .562 | 12 | +41 | W2 |
| 5Cubs | 89 | 73 | .549 | 14 | +147 | W1 |
6 Phillies | 88 | 74 | .543 | 15 | +15 | W1 |
7 Diamondbacks | 86 | 76 | .531 | 17 | +9 | L2 |
8 Pirates | 82 | 80 | .506 | 21 | +28 | W1 |
9 Marlins | 80 | 82 | .494 | 23 | +3 | W1 |
10 Cardinals | 77 | 85 | .475 | 26 | -29 | L4 |
11 Nationals | 77 | 85 | .475 | 26 | +6 | W1 |
12 Reds | 75 | 87 | .463 | 28 | -160 | L1 |
13 Mets | 74 | 88 | .457 | 29 | -32 | L1 |
14 Giants | 65 | 97 | .401 | 38 | -91 | L5 |
15 Rockies | 58 | 104 | .358 | 45 | -192 | L1 |
SD
VS
MIL
Pitchers
Robbie Ray
Catchers
Ethan Salas
Infielders
Manny Machado
Ty France
Xander Bogaerts
Jake Cronenworth
Outfielders
Fernando Tatis Jr.
Dustin Harris
Jackson Merrill
Designated Hitters
Luis Campusano
Pitchers
Jacob Misiorowski
Catchers
William Contreras
Infielders
Brice Turang
Jake Bauers
Cooper Pratt
Joey Ortiz
Outfielders
Jackson Chourio
Luis Lara
Garrett Mitchell
Designated Hitters
Christian Yelich
Padres
VS
Brewers
Batting
3
Team Games Played
1
100
At Bats
31
30
Hits
7
12
Runs Batted In
3
4
Home Runs
2
2
Stolen Bases
2
.300
Batting Average
.226
14
Runs
3
4
Doubles
0
0
Triples
0
46
Total Bases
13
7
Walks
4
22
Strikeouts
6
.355
On Base Percentage
.333
.460
Slugging Percentage
.419
.815
OBP Pct + SLG Pct
.753
3
Games Played
1
3
Games Started
1
2
Hit By Pitch
1
0.0
Wins Above Replacement
0.0
0.0
Offensive Wins Above Replacement
0.0
2
Caught Stealing
0
1
Is Qualified
1
15.2
Runs Created
5.1
5.4
Runs Created Per 27 Outs
5.7
.064
Walks Per Plate Appearance
.111
0.32
Walk To Strikeout Ratio
0.67
.160
Isolated Power
.194
.230
Secondary Average
.387
4.06
Pitches Per Plate Appearance
3.50
8
Extra Base Hits
2
110
Plate Appearances
36
25.0
At Bats Per Home Run
15.5
0
Sacrifice Hit
0
1
Sacrifice Flies
0
Pitching
3
Team Games Played
1
1
Quality Starts
0
2
Wins
1
1
Losses
0
1
Saves
1
2
Holds
0
15
Hits
9
4
Earned runs
2
2
Home Runs
0
11
Walks
4
25
Strikeouts
9
8.7
Strikeouts Per 9 Innings
9.0
134.0
Pitches Per Start
175.0
1.00
Walks Plus Hits Per Inning Pitched
1.44
1.38
Earned Run Average
2.00
1
Losses
0
26.0
Innings pitched
9.0
.667
Win Percentage
1.000
1
Save Opportunities
1
.161
Opponent Batting Average
.250
.264
Opponent's On-base pct.
.341
.237
Opponent's Slugging pct.
.278
.501
Opponent's OPB Pct + SLG Pct
.619
93
At Bats
36
1
Doubles
1
0
Triples
0
2
Batters Hit
1
3
Stolen Bases
0
3
Games Played
1
0
Complete Games
0
1
Shutouts
0
0
Wild Pitches
2
4
Runs Batted In
2
0
Balks
0
26.0
Innings pitched
9.0
8.7
Strikeouts Per 9 Innings
9.0
0
Caught Stealing
1
3
Games Started
1
0.0
Wins Above Replacement
0.0
1
Is Qualified
1
4
Runs
2
4
Earned Runs
2
22
Total Bases
10
Fielding
3
Team Games Played
1
234
Full Innings
81
99
Total Chances
34
78
Putouts
27
19
Assists
7
2
Errors
0
3
Double Plays
3
0.980
Fielding Percentage
1.000
3.7
Range Factor
3.8
0.0
Zone Rating
0.0
3
Games Played
1
0
Games Started
0
0.0
Defensive Wins Above Replacement
0.0
1
Qualified
1