

Padres vs Giants Live Score (6 May, 2026)
Game Information
Stage
Standard
Season
2026
First Pitch
Wed, May 6, 3:45 pm
Venue
Oracle Park
Location
San Francisco, California
Attendance
34,181
Live Situation
1Balls
3Strikes
0Outs
—Pitcher
—At Bat
Pitch Sequence
1
STRIKE SWINGING
Four-seam FB
102 MPH
2
BALL
Slider
88 MPH
3
STRIKE LOOKING
Slider
88 MPH
4
STRIKE SWINGING
Slider
89 MPH
Injury Report



Team Stats
 SD
SF


5
Runs
1
6
Hits
3
0
Errors
1
2
Home Runs
1
4
Walks
0
4
Strikeouts
13
Player Box Score
San Diego Padres
| Player | H-AB | AB | R | H | RBI | HR | BB | K | #P | AVG | OBP | SLG |
|---|---|---|---|---|---|---|---|---|---|---|---|---|
 Jackson Merrill | 1-4 | 4 | 0 | 1 | 0 | 0 | 1 | 0 | 16 | .235 | .297 | .382 |
 Manny Machado | 0-3 | 3 | 1 | 0 | 0 | 0 | 1 | 1 | 17 | .207 | .315 | .364 |
 Miguel Andujar | 0-4 | 4 | 0 | 0 | 0 | 0 | 0 | 0 | 13 | .308 | .337 | .495 |
 Gavin Sheets | 1-3 | 3 | 1 | 1 | 1 | 1 | 0 | 0 | 13 | .228 | .271 | .465 |
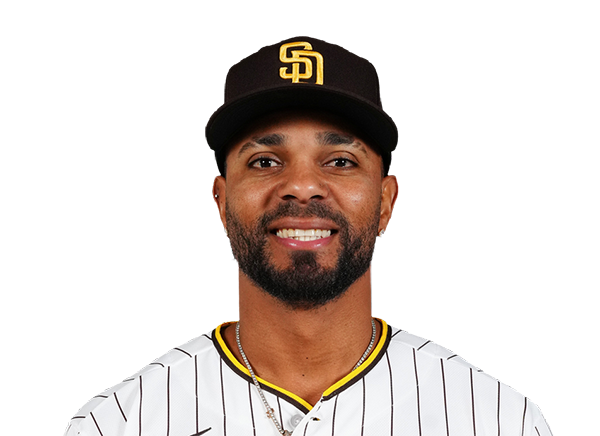 Xander Bogaerts | 1-1 | 1 | 1 | 1 | 2 | 1 | 0 | 0 | 1 | .276 | .357 | .457 |
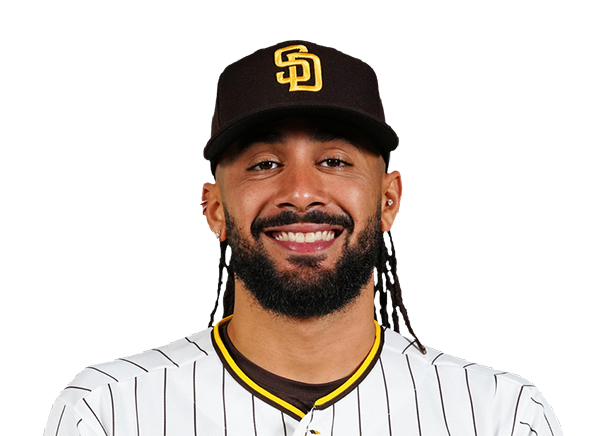 Fernando Tatis Jr. | 0-4 | 4 | 1 | 0 | 0 | 0 | 0 | 0 | 16 | .242 | .311 | .295 |
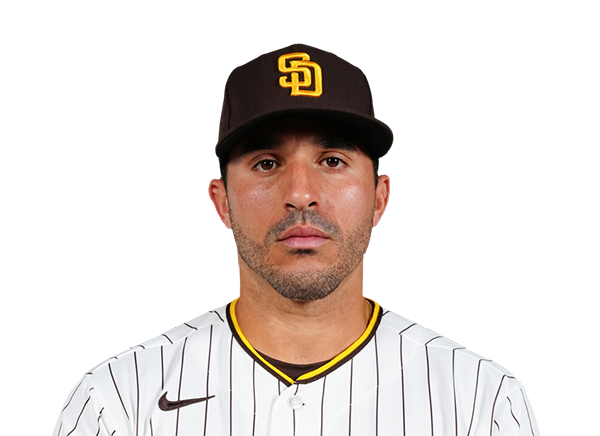 Ramon Laureano | 0-2 | 2 | 1 | 0 | 0 | 0 | 2 | 1 | 21 | .234 | .307 | .419 |
 Nick Castellanos | 2-4 | 4 | 0 | 2 | 0 | 0 | 0 | 1 | 15 | .191 | .233 | .294 |
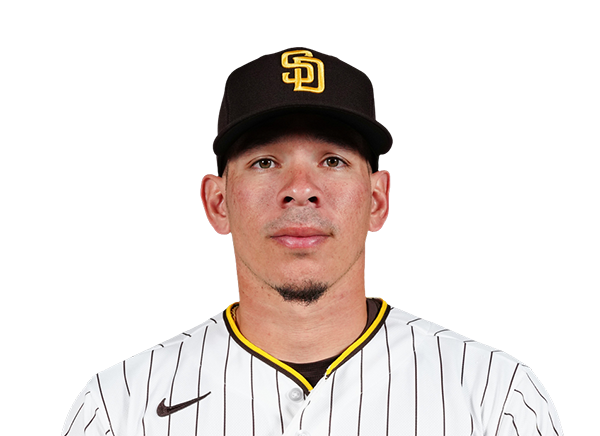 Freddy Fermin | 0-4 | 4 | 0 | 0 | 0 | 0 | 0 | 0 | 10 | .150 | .264 | .217 |
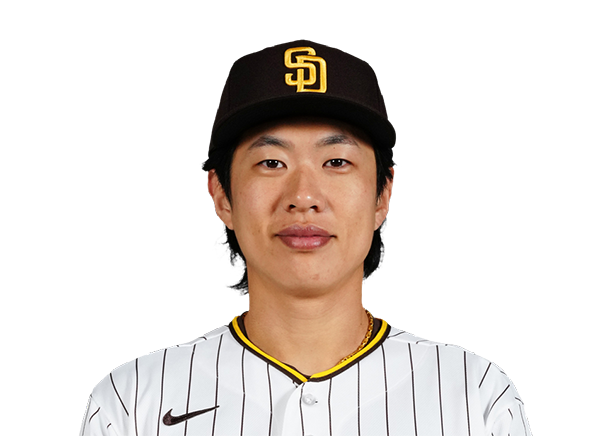 Sung-Mun Song | 0-2 | 2 | 0 | 0 | 0 | 0 | 0 | 1 | 6 | .333 | .333 | .500 |
 Ty France | 1-2 | 2 | 0 | 1 | 2 | 0 | 0 | 0 | 9 | .291 | .328 | .564 |
San Francisco Giants
| Player | H-AB | AB | R | H | RBI | HR | BB | K | #P | AVG | OBP | SLG |
|---|---|---|---|---|---|---|---|---|---|---|---|---|
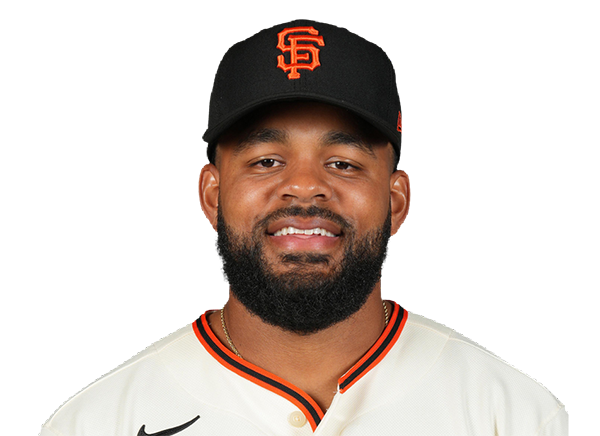 Heliot Ramos | 0-4 | 4 | 0 | 0 | 0 | 0 | 0 | 3 | 13 | .254 | .289 | .396 |
 Jung Hoo Lee | 0-4 | 4 | 0 | 0 | 0 | 0 | 0 | 0 | 15 | .263 | .310 | .383 |
 Casey Schmitt | 0-4 | 4 | 0 | 0 | 0 | 0 | 0 | 2 | 16 | .296 | .344 | .539 |
 Matt Chapman | 0-3 | 3 | 0 | 0 | 0 | 0 | 0 | 1 | 11 | .234 | .309 | .314 |
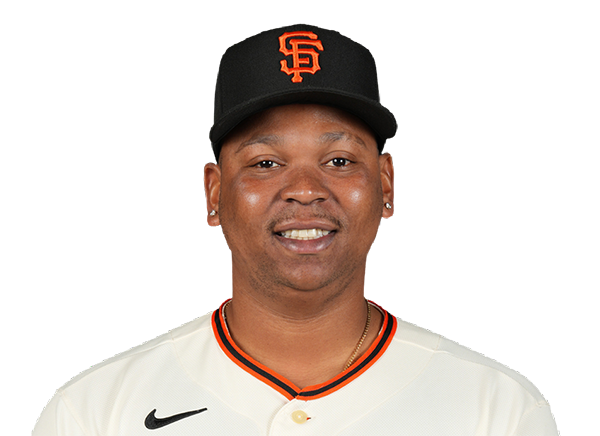 Rafael Devers | 1-3 | 3 | 1 | 1 | 1 | 1 | 0 | 1 | 12 | .221 | .265 | .329 |
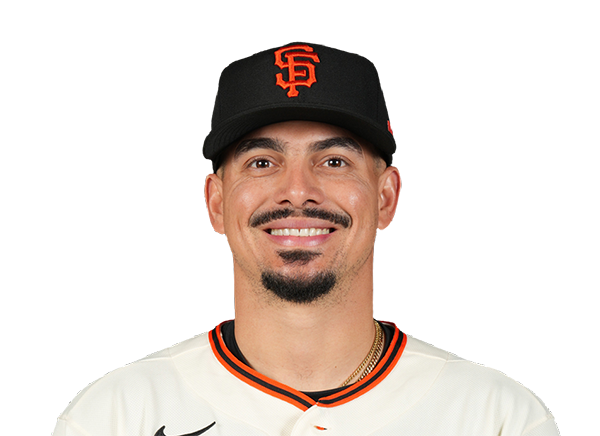 Willy Adames | 0-3 | 3 | 0 | 0 | 0 | 0 | 0 | 1 | 11 | .194 | .232 | .333 |
 Bryce Eldridge | 0-3 | 3 | 0 | 0 | 0 | 0 | 0 | 3 | 13 | .111 | .200 | .111 |
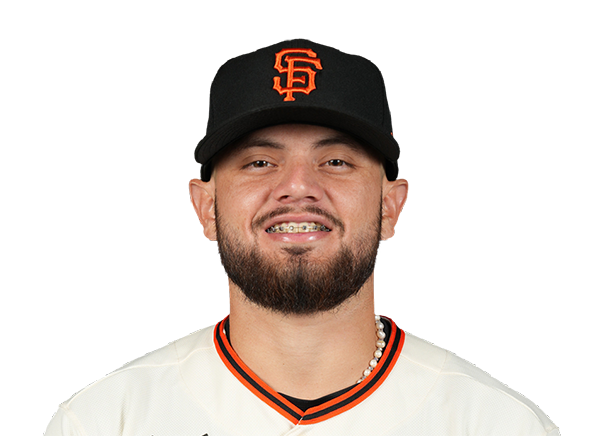 Jesus Rodriguez | 2-3 | 3 | 0 | 2 | 0 | 0 | 0 | 0 | 10 | .444 | .444 | .778 |
 Patrick Bailey | 0-3 | 3 | 0 | 0 | 0 | 0 | 0 | 2 | 12 | .146 | .213 | .183 |
San Diego Padres
| Player | IP | H | R | ER | BB | K | HR | PC-ST | ERA | PC |
|---|---|---|---|---|---|---|---|---|---|---|
 Bradgley Rodriguez | 1.0 | 0 | 0 | 0 | 0 | 0 | 0 | 7-4 | 1.53 | 7 |
 Matt Waldron | 5.0 | 2 | 1 | 1 | 0 | 7 | 1 | 67-48 | 7.71 | 67 |
 Adrian Morejon | 2.0 | 1 | 0 | 0 | 0 | 4 | 0 | 26-20 | 5.40 | 26 |
 Mason Miller | 1.0 | 0 | 0 | 0 | 0 | 2 | 0 | 13-9 | 1.04 | 13 |
San Francisco Giants
| Player | IP | H | R | ER | BB | K | HR | PC-ST | ERA | PC |
|---|---|---|---|---|---|---|---|---|---|---|
 Adrian Houser | 6.0 | 3 | 2 | 1 | 1 | 3 | 1 | 74-50 | 6.19 | 74 |
 Keaton Winn | 0.2 | 0 | 1 | 1 | 1 | 0 | 0 | 16-7 | 2.93 | 16 |
 Matt Gage | 0.1 | 1 | 0 | 0 | 0 | 0 | 0 | 10-7 | 1.26 | 10 |
 Ryan Walker | 1.0 | 2 | 2 | 2 | 2 | 0 | 1 | 29-15 | 5.52 | 29 |
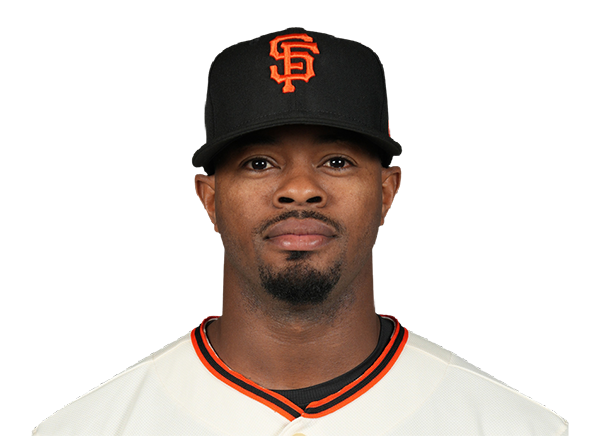 Joel Peguero | 1.0 | 0 | 0 | 0 | 0 | 1 | 0 | 8-6 | 0.00 | 8 |
H2H / Season Series
SD5–4
SF
SD6–5
SF
SD7–0
SF
SD1–4
SF
SF1–5
SD
SF5–10
SD
SF3–2
SD
SD7–1
SF
SD3–9
SF
SD2–3
SF
Last 5 Games
| Date | Opponent | Result |
|---|---|---|
| Aug 22 |  vs MIN | W7–5 |
| Aug 21 | vs MIN | W6–2 |
| Aug 19 |  @ NYM | L2–4 |
| Aug 18 | @ NYM | W5–2 |
| Aug 17 | @ NYM | L1–2 |
| Date | Opponent | Result |
|---|---|---|
| Aug 22 |  @ BOS | L2–3 |
| Aug 21 | @ BOS | L4–6 |
| Aug 20 |  @ CLE | L2–5 |
| Aug 19 | @ CLE | W1–0 |
| Aug 18 | @ CLE | L1–8 |
Standings
American League
| Team | W | L | PCT | GB | DIFF | STRK |
|---|---|---|---|---|---|---|
1 Rays | 76 | 53 | .589 | - | +42 | L3 |
2 White Sox | 67 | 62 | .519 | 9 | +42 | L1 |
3 Astros | 65 | 65 | .500 | 11.5 | -43 | L1 |
4 Yankees | 73 | 56 | .566 | 3 | +95 | L1 |
| 5Red Sox | 70 | 59 | .543 | 6 | +98 | W2 |
6 Rangers | 64 | 66 | .492 | 12.5 | -48 | L1 |
| 7Guardians | 64 | 66 | .492 | 12.5 | -14 | W3 |
8 Blue Jays | 64 | 67 | .489 | 13 | -50 | W1 |
| 9Twins | 63 | 67 | .485 | 13.5 | -47 | L2 |
10 Orioles | 63 | 67 | .485 | 13.5 | -33 | W2 |
11 Mariners | 62 | 68 | .477 | 14.5 | -44 | W2 |
12 Tigers | 61 | 68 | .473 | 15 | +77 | L4 |
13 Royals | 57 | 74 | .435 | 20 | -95 | W7 |
14 Angels | 52 | 78 | .400 | 24.5 | -68 | W1 |
15 Athletics | 50 | 80 | .385 | 26.5 | -188 | W1 |
National League
| Team | W | L | PCT | GB | DIFF | STRK |
|---|---|---|---|---|---|---|
1 Brewers | 81 | 49 | .623 | - | +163 | W3 |
2 Dodgers | 79 | 51 | .608 | 2 | +147 | W5 |
3 Braves | 75 | 55 | .577 | 6 | +108 | L2 |
4 Cubs | 74 | 56 | .569 | 7 | +98 | L3 |
5 Phillies | 72 | 58 | .554 | 9 | +25 | W8 |
| 6Padres | 70 | 60 | .538 | 11 | +9 | W2 |
7 Diamondbacks | 68 | 62 | .523 | 13 | +7 | L1 |
8 Marlins | 66 | 64 | .508 | 15 | +17 | W2 |
9 Cardinals | 66 | 65 | .504 | 15.5 | 0 | L2 |
10 Pirates | 63 | 68 | .481 | 18.5 | +29 | L2 |
11 Reds | 62 | 68 | .477 | 19 | -92 | W1 |
12 Nationals | 61 | 70 | .466 | 20.5 | +14 | L3 |
| 13Mets | 59 | 71 | .454 | 22 | -39 | W1 |
| 14Giants | 52 | 77 | .403 | 28.5 | -79 | L3 |
15 Rockies | 50 | 79 | .388 | 30.5 | -131 | L5 |
SD
VS
SF
Pitchers
Bradgley Rodriguez
Matt Waldron
Adrian Morejon
Mason Miller
Catchers
Freddy Fermin
Infielders
Manny Machado
Gavin Sheets
Xander Bogaerts
Fernando Tatis Jr.
Sung-Mun Song
Ty France
Outfielders
Jackson Merrill
Ramon Laureano
Nick Castellanos
Designated Hitters
Miguel Andujar
Pitchers
Adrian Houser
Keaton Winn
Matt Gage
Ryan Walker
Joel Peguero
Catchers
Patrick Bailey
Infielders
Casey Schmitt
Matt Chapman
Rafael Devers
Willy Adames
Outfielders
Heliot Ramos
Jung Hoo Lee
Jesus Rodriguez
Designated Hitters
Bryce Eldridge
Padres
VS
Giants
Batting
130
Team Games Played
129
4278
At Bats
4381
1020
Hits
1082
536
Runs Batted In
499
145
Home Runs
143
124
Stolen Bases
57
.238
Batting Average
.247
556
Runs
519
189
Doubles
214
11
Triples
24
1666
Total Bases
1773
446
Walks
343
1056
Strikeouts
1029
.315
On Base Percentage
.305
.389
Slugging Percentage
.405
.705
OBP Pct + SLG Pct
.710
130
Games Played
129
130
Games Started
129
51
Hit By Pitch
41
0.0
Wins Above Replacement
0.0
0.0
Offensive Wins Above Replacement
0.0
33
Caught Stealing
18
1
Is Qualified
1
535.6
Runs Created
545.3
4.2
Runs Created Per 27 Outs
4.3
.092
Walks Per Plate Appearance
.071
0.42
Walk To Strikeout Ratio
0.33
.151
Isolated Power
.158
.277
Secondary Average
.245
3.92
Pitches Per Plate Appearance
3.86
345
Extra Base Hits
381
4831
Plate Appearances
4823
29.5
At Bats Per Home Run
30.6
19
Sacrifice Hit
22
35
Sacrifice Flies
36
Pitching
130
Team Games Played
129
28
Quality Starts
45
70
Wins
52
60
Losses
77
39
Saves
24
81
Holds
63
1047
Hits
1061
515
Earned runs
549
143
Home Runs
118
444
Walks
486
1046
Strikeouts
971
8.2
Strikeouts Per 9 Innings
7.7
146.6
Pitches Per Start
147.7
1.30
Walks Plus Hits Per Inning Pitched
1.36
4.04
Earned Run Average
4.35
60
Losses
77
1148.0
Innings pitched
1136.1
.538
Win Percentage
.403
54
Save Opportunities
44
.243
Opponent Batting Average
.247
.319
Opponent's On-base pct.
.329
.393
Opponent's Slugging pct.
.387
.712
Opponent's OPB Pct + SLG Pct
.716
4317
At Bats
4289
189
Doubles
188
16
Triples
28
52
Batters Hit
57
81
Stolen Bases
104
130
Games Played
129
0
Complete Games
1
9
Shutouts
9
34
Wild Pitches
47
529
Runs Batted In
562
3
Balks
4
1148.0
Innings pitched
1136.1
8.2
Strikeouts Per 9 Innings
7.7
40
Caught Stealing
34
130
Games Started
129
0.0
Wins Above Replacement
0.0
1
Is Qualified
1
547
Runs
598
515
Earned Runs
549
1697
Total Bases
1659
Fielding
130
Team Games Played
129
1148
Full Innings
1136
4640
Total Chances
4707
3444
Putouts
3409
1141
Assists
1214
55
Errors
84
189
Double Plays
214
0.988
Fielding Percentage
0.982
35.9
Range Factor
36.6
0.0
Zone Rating
0.0
130
Games Played
129
0
Games Started
0
0.0
Defensive Wins Above Replacement
0.0
1
Qualified
1