

Padres vs Guardians Live Score (15 Aug, 2026)
Game Information
Stage
Standard
Season
2026
First Pitch
Sat, Aug 15, 7:10 pm
Venue
Progressive Field
Location
Cleveland, Ohio
Attendance
35,153
Live Situation
0Balls
3Strikes
0Outs
—Pitcher
—At Bat
Pitch Sequence
1
STRIKE FOUL
Curve
82 MPH
2
STRIKE SWINGING
Four-seam FB
94 MPH
3
STRIKE SWINGING
Four-seam FB
95 MPH
Injury Report



Team Stats
 SD
CLE

1
Runs
6
1
Hits
11
2
Errors
0
0
Home Runs
0
3
Walks
2
11
Strikeouts
9
Player Box Score
San Diego Padres
| Player | H-AB | AB | R | H | RBI | HR | BB | K | #P | AVG | OBP | SLG |
|---|---|---|---|---|---|---|---|---|---|---|---|---|
 Fernando Tatis Jr. |
0-2 | 2 | 1 | 0 | 0 | 0 | 2 | 1 | 19 | .279 | .354 | .423 |
 Jake Cronenworth |
1-4 | 4 | 0 | 1 | 0 | 0 | 0 | 1 | 23 | .222 | .308 | .288 |
 Manny Machado |
0-4 | 4 | 0 | 0 | 0 | 0 | 0 | 1 | 13 | .213 | .294 | .410 |
 Ty France |
0-2 | 2 | 0 | 0 | 0 | 0 | 0 | 1 | 11 | .296 | .353 | .524 |
 Jackson Merrill |
0-3 | 3 | 0 | 0 | 0 | 0 | 0 | 2 | 16 | .244 | .294 | .417 |
 Luis Campusano |
0-2 | 2 | 0 | 0 | 0 | 0 | 1 | 1 | 16 | .313 | .409 | .516 |
 Austin Hays |
0-2 | 2 | 0 | 0 | 0 | 0 | 0 | 1 | 9 | .273 | .273 | .545 |
 Gavin Sheets |
0-1 | 1 | 0 | 0 | 0 | 0 | 0 | 1 | 6 | .210 | .312 | .388 |
 Jase Bowen |
0-0 | 0 | 0 | 0 | 0 | 0 | 0 | 0 | 0 | .147 | .190 | .213 |
 Xander Bogaerts |
0-3 | 3 | 0 | 0 | 0 | 0 | 0 | 0 | 8 | .221 | .318 | .331 |
 Freddy Fermin |
0-3 | 3 | 0 | 0 | 0 | 0 | 0 | 2 | 7 | .191 | .268 | .311 |
Cleveland Guardians
| Player | H-AB | AB | R | H | RBI | HR | BB | K | #P | AVG | OBP | SLG |
|---|---|---|---|---|---|---|---|---|---|---|---|---|
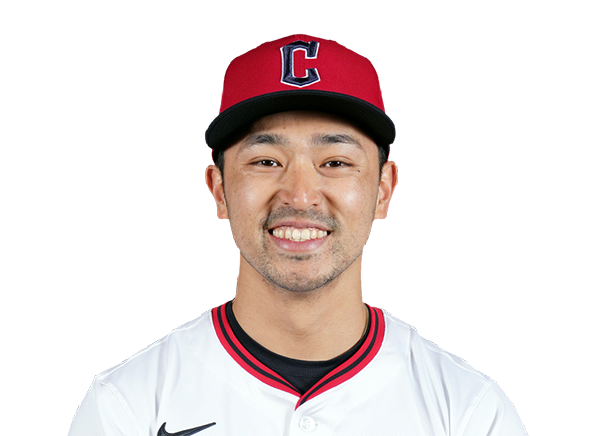 Steven Kwan |
2-4 | 4 | 2 | 2 | 1 | 0 | 0 | 0 | 14 | .268 | .369 | .332 |
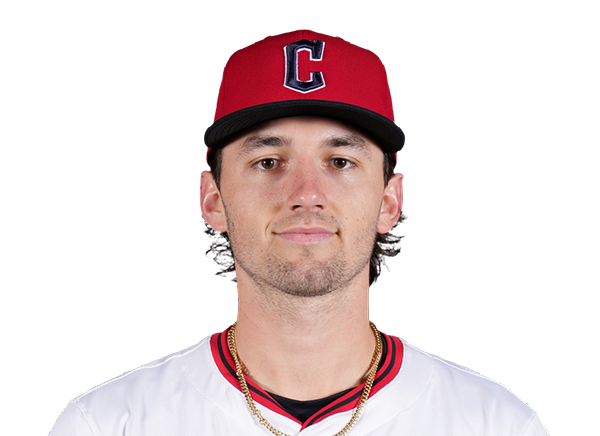 Chase DeLauter |
2-4 | 4 | 1 | 2 | 0 | 0 | 0 | 0 | 18 | .286 | .358 | .443 |
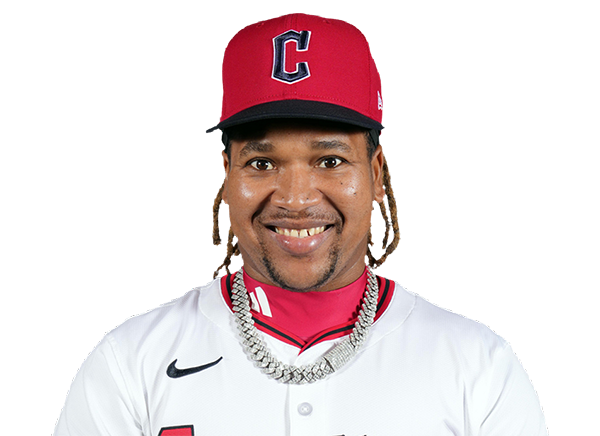 Jose Ramirez |
1-3 | 3 | 1 | 1 | 1 | 0 | 0 | 1 | 13 | .232 | .337 | .380 |
 Jo Adell |
2-4 | 4 | 0 | 2 | 1 | 0 | 0 | 2 | 14 | .184 | .304 | .447 |
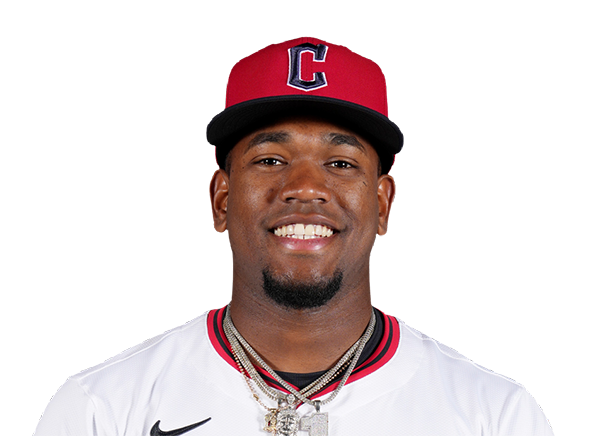 Angel Martinez |
0-0 | 0 | 0 | 0 | 0 | 0 | 0 | 0 | 0 | .240 | .273 | .431 |
 Nathaniel Lowe |
1-4 | 4 | 0 | 1 | 0 | 0 | 0 | 1 | 12 | .290 | .303 | .548 |
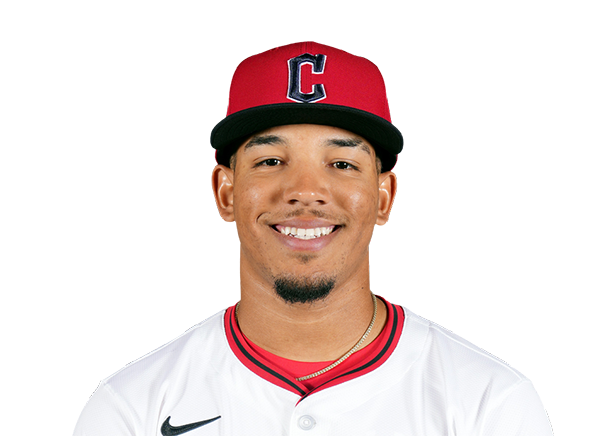 Angel Genao |
0-3 | 3 | 1 | 0 | 0 | 0 | 1 | 1 | 19 | .294 | .368 | .412 |
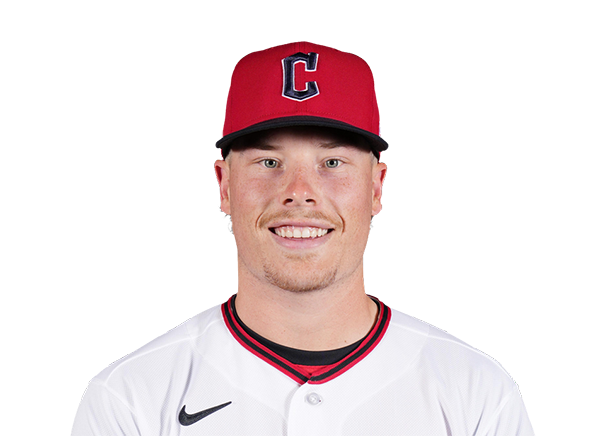 Travis Bazzana |
1-3 | 3 | 0 | 1 | 0 | 0 | 1 | 2 | 19 | .237 | .334 | .375 |
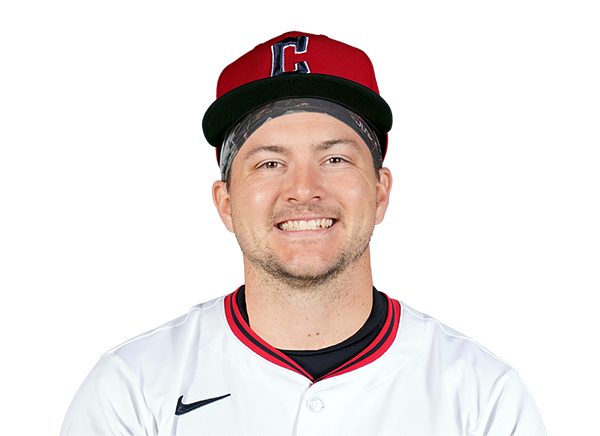 Patrick Bailey |
1-4 | 4 | 0 | 1 | 1 | 0 | 0 | 1 | 15 | .208 | .260 | .357 |
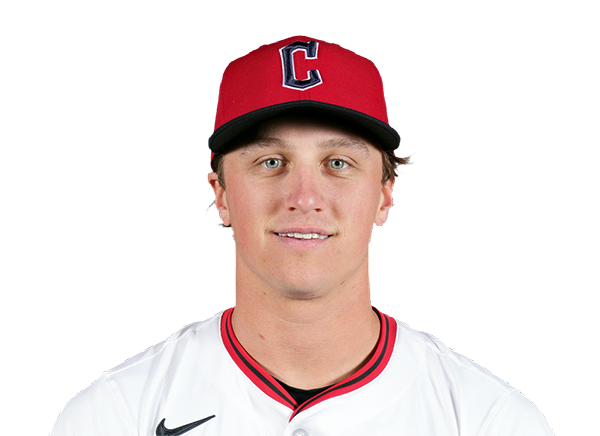 Petey Halpin |
1-4 | 4 | 1 | 1 | 0 | 0 | 0 | 1 | 11 | .223 | .252 | .322 |
San Diego Padres
| Player | IP | H | R | ER | BB | K | HR | PC-ST | ERA | PC |
|---|---|---|---|---|---|---|---|---|---|---|
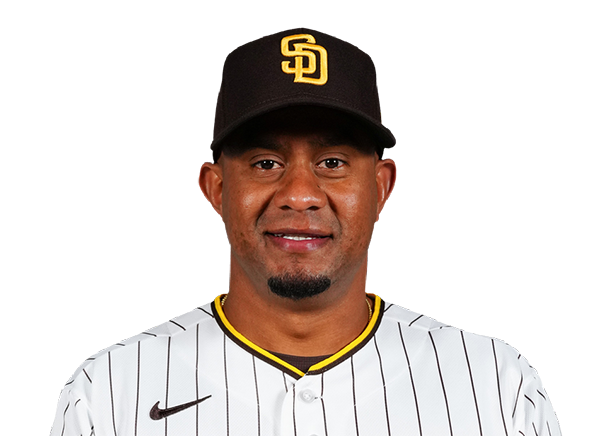 Wandy Peralta |
1.0 | 3 | 1 | 1 | 0 | 1 | 0 | 13-9 | 3.48 | 13 |
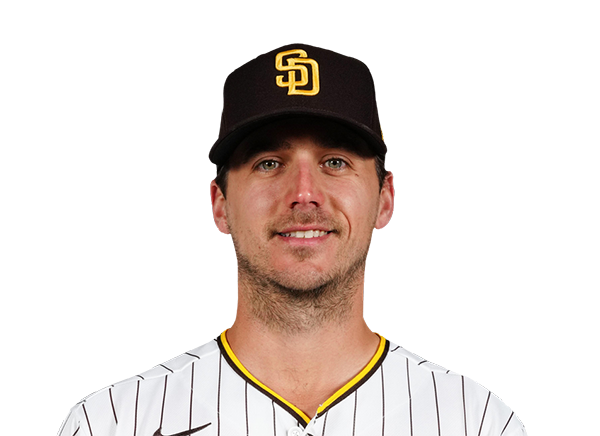 Kyle Hart |
1.0 | 1 | 1 | 1 | 1 | 2 | 0 | 22-13 | 4.20 | 22 |
 Randy Vasquez |
5.0 | 7 | 4 | 4 | 1 | 5 | 0 | 90-61 | 4.30 | 90 |
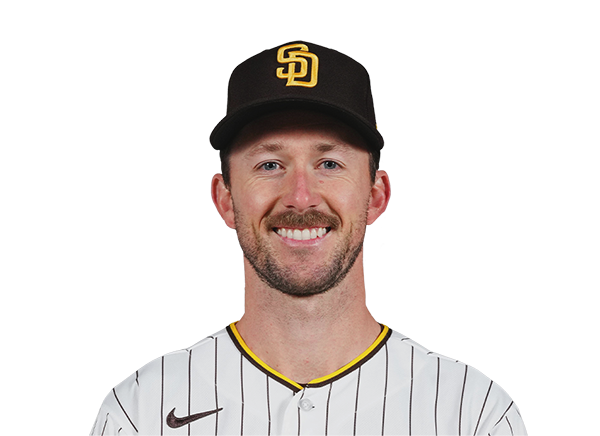 Griffin Canning |
1.0 | 0 | 0 | 0 | 0 | 1 | 0 | 10-6 | 6.50 | 10 |
Cleveland Guardians
| Player | IP | H | R | ER | BB | K | HR | PC-ST | ERA | PC |
|---|---|---|---|---|---|---|---|---|---|---|
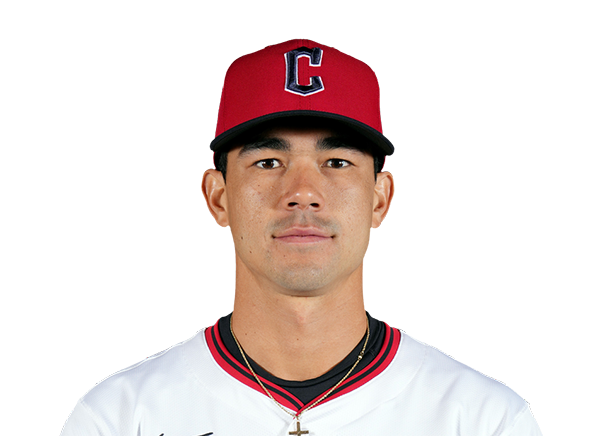 Joey Cantillo |
6.0 | 1 | 1 | 1 | 3 | 7 | 0 | 87-58 | 3.80 | 87 |
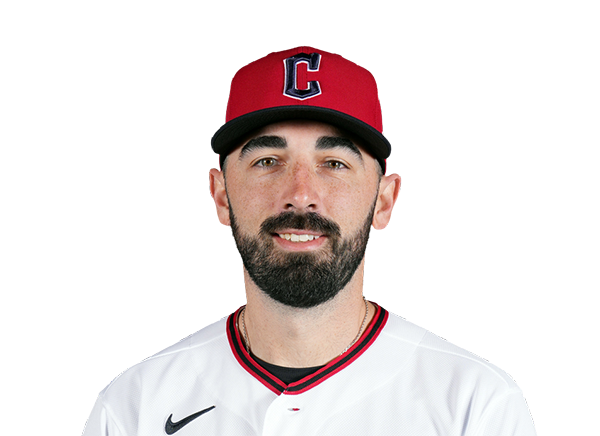 Colin Holderman |
0.2 | 0 | 0 | 0 | 0 | 0 | 0 | 16-8 | 2.39 | 16 |
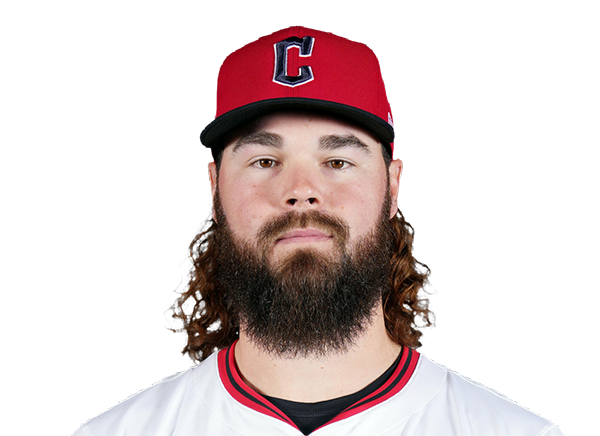 Hunter Gaddis |
1.1 | 0 | 0 | 0 | 0 | 2 | 0 | 15-10 | 3.48 | 15 |
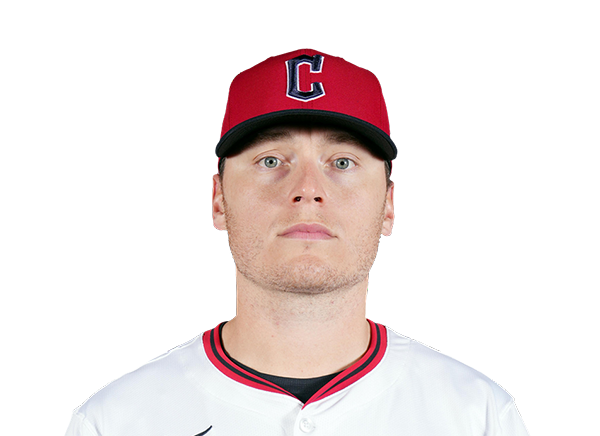 Erik Sabrowski |
1.0 | 0 | 0 | 0 | 0 | 2 | 0 | 10-8 | 3.44 | 10 |
H2H / Season Series
CLE0–5
SD
CLE6–1
SD
CLE5–7
SD
SD8–5
CLE
CLE7–1
SD
Last 5 Games
| Date | Opponent | Result |
|---|---|---|
| Aug 22 |  vs MIN | W7–5 |
| Aug 21 | vs MIN | W6–2 |
| Aug 19 |  @ NYM | L2–4 |
| Aug 18 | @ NYM | W5–2 |
| Aug 17 | @ NYM | L1–2 |
| Date | Opponent | Result |
|---|---|---|
| Aug 22 |  @ COL | W4–3 |
| Aug 21 | @ COL | W9–1 |
| Aug 20 |  vs SF | W5–2 |
| Aug 19 | vs SF | L0–1 |
| Aug 18 | vs SF | W8–1 |
Standings
American League
| Team | W | L | PCT | GB | DIFF | STRK |
|---|---|---|---|---|---|---|
1 Rays | 76 | 53 | .589 | - | +42 | L3 |
2 White Sox | 67 | 62 | .519 | 9 | +42 | L1 |
3 Astros | 65 | 65 | .500 | 11.5 | -43 | L1 |
4 Yankees | 73 | 56 | .566 | 3 | +95 | L1 |
5 Red Sox | 70 | 59 | .543 | 6 | +98 | W2 |
6 Rangers | 64 | 66 | .492 | 12.5 | -48 | L1 |
| 7Guardians | 64 | 66 | .492 | 12.5 | -14 | W3 |
8 Blue Jays | 64 | 67 | .489 | 13 | -50 | W1 |
| 9Twins | 63 | 67 | .485 | 13.5 | -47 | L2 |
10 Orioles | 63 | 67 | .485 | 13.5 | -33 | W2 |
11 Mariners | 62 | 68 | .477 | 14.5 | -44 | W2 |
12 Tigers | 61 | 68 | .473 | 15 | +77 | L4 |
13 Royals | 57 | 74 | .435 | 20 | -95 | W7 |
14 Angels | 52 | 78 | .400 | 24.5 | -68 | W1 |
15 Athletics | 50 | 80 | .385 | 26.5 | -188 | W1 |
National League
| Team | W | L | PCT | GB | DIFF | STRK |
|---|---|---|---|---|---|---|
1 Brewers | 81 | 49 | .623 | - | +163 | W3 |
2 Dodgers | 79 | 51 | .608 | 2 | +147 | W5 |
3 Braves | 75 | 55 | .577 | 6 | +108 | L2 |
4 Cubs | 74 | 56 | .569 | 7 | +98 | L3 |
5 Phillies | 72 | 58 | .554 | 9 | +25 | W8 |
| 6Padres | 70 | 60 | .538 | 11 | +9 | W2 |
7 Diamondbacks | 68 | 62 | .523 | 13 | +7 | L1 |
8 Marlins | 66 | 64 | .508 | 15 | +17 | W2 |
9 Cardinals | 66 | 65 | .504 | 15.5 | 0 | L2 |
10 Pirates | 63 | 68 | .481 | 18.5 | +29 | L2 |
11 Reds | 62 | 68 | .477 | 19 | -92 | W1 |
12 Nationals | 61 | 70 | .466 | 20.5 | +14 | L3 |
| 13Mets | 59 | 71 | .454 | 22 | -39 | W1 |
| 14Giants | 52 | 77 | .403 | 28.5 | -79 | L3 |
| 15Rockies | 50 | 79 | .388 | 30.5 | -131 | L5 |
SD
VS
CLE
Pitchers
Wandy Peralta
Kyle Hart
Randy Vasquez
Griffin Canning
Catchers
Freddy Fermin
Infielders
Jake Cronenworth
Manny Machado
Ty France
Xander Bogaerts
Outfielders
Fernando Tatis Jr.
Jackson Merrill
Austin Hays
Jase Bowen
Designated Hitters
Luis Campusano
Other Players
Gavin Sheets
Pitchers
Joey Cantillo
Colin Holderman
Hunter Gaddis
Erik Sabrowski
Catchers
Patrick Bailey
Infielders
Jose Ramirez
Nathaniel Lowe
Angel Genao
Travis Bazzana
Outfielders
Steven Kwan
Jo Adell
Angel Martinez
Petey Halpin
Designated Hitters
Chase DeLauter
Padres
VS
Guardians
Batting
123
Team Games Played
123
4057
At Bats
4084
968
Hits
950
511
Runs Batted In
467
136
Home Runs
119
124
Stolen Bases
118
.239
Batting Average
.233
529
Runs
488
183
Doubles
181
11
Triples
11
1581
Total Bases
1510
419
Walks
450
995
Strikeouts
1008
.315
On Base Percentage
.313
.390
Slugging Percentage
.370
.704
OBP Pct + SLG Pct
.683
123
Games Played
123
123
Games Started
123
47
Hit By Pitch
42
0.0
Wins Above Replacement
0.0
0.0
Offensive Wins Above Replacement
0.0
32
Caught Stealing
23
1
Is Qualified
1
508.7
Runs Created
500.1
4.2
Runs Created Per 27 Outs
4.1
.092
Walks Per Plate Appearance
.097
0.42
Walk To Strikeout Ratio
0.45
.151
Isolated Power
.137
.277
Secondary Average
.271
3.92
Pitches Per Plate Appearance
3.96
330
Extra Base Hits
311
4576
Plate Appearances
4632
29.8
At Bats Per Home Run
34.3
19
Sacrifice Hit
23
33
Sacrifice Flies
31
Pitching
123
Team Games Played
123
23
Quality Starts
41
66
Wins
59
57
Losses
64
37
Saves
35
77
Holds
91
1003
Hits
984
495
Earned runs
467
137
Home Runs
141
428
Walks
406
1000
Strikeouts
1139
8.3
Strikeouts Per 9 Innings
9.4
147.5
Pitches Per Start
148.0
1.32
Walks Plus Hits Per Inning Pitched
1.28
4.09
Earned Run Average
3.86
57
Losses
64
1088.0
Innings pitched
1088.2
.537
Win Percentage
.480
52
Save Opportunities
49
.245
Opponent Batting Average
.239
.322
Opponent's On-base pct.
.312
.396
Opponent's Slugging pct.
.396
.718
Opponent's OPB Pct + SLG Pct
.708
4099
At Bats
4112
179
Doubles
191
15
Triples
15
50
Batters Hit
48
76
Stolen Bases
88
123
Games Played
123
0
Complete Games
0
8
Shutouts
4
34
Wild Pitches
46
510
Runs Batted In
496
3
Balks
2
1088.0
Innings pitched
1088.2
8.3
Strikeouts Per 9 Innings
9.4
38
Caught Stealing
16
123
Games Started
123
0.0
Wins Above Replacement
0.0
1
Is Qualified
1
526
Runs
520
495
Earned Runs
467
1623
Total Bases
1628
Fielding
123
Team Games Played
123
1088
Full Innings
1089
4402
Total Chances
4293
3264
Putouts
3266
1087
Assists
959
51
Errors
68
183
Double Plays
181
0.988
Fielding Percentage
0.984
36.0
Range Factor
34.9
0.0
Zone Rating
0.0
123
Games Played
123
0
Games Started
0
0.0
Defensive Wins Above Replacement
0.0
1
Qualified
1