

Padres vs Mariners Live Score (20 Feb, 2026)
Game Information
Stage
EXH
Season
2026
First Pitch
Fri, Feb 20, 3:10 pm
Venue
Peoria Stadium
Location
Peoria, Arizona
Venue Type
Outdoor
Broadcast
MLB.TV
Attendance
9,956
Live Situation
1Balls
3Strikes
0Outs
—Pitcher
—At Bat
Pitch Sequence
1
STRIKE LOOKING
Slider
86 MPH
2
STRIKE LOOKING
Slider
86 MPH
3
BALL
Slider
87 MPH
4
STRIKE SWINGING
Slider
83 MPH
Injury Report







Team Stats
 SD
SEA


4
Runs
7
8
Hits
13
0
Errors
0
2
Home Runs
2
5
Walks
2
6
Strikeouts
8
Player Box Score
San Diego Padres
| Player | H-AB | AB | R | H | RBI | HR | BB | K | #P | AVG | OBP | SLG |
|---|---|---|---|---|---|---|---|---|---|---|---|---|
 Xander Bogaerts | 1-2 | 2 | 0 | 1 | 0 | 0 | 0 | 0 | 0 | .500 | .500 | .500 |
 Francisco Acuna | 0-2 | 2 | 1 | 0 | 0 | 0 | 1 | 0 | 0 | .000 | .333 | .000 |
 Jackson Merrill | 0-1 | 1 | 0 | 0 | 0 | 0 | 1 | 1 | 0 | .000 | .500 | .000 |
 Jase Bowen | 1-3 | 3 | 0 | 1 | 1 | 0 | 0 | 0 | 0 | .333 | .333 | .333 |
 Manny Machado | 0-2 | 2 | 0 | 0 | 0 | 0 | 0 | 1 | 0 | .000 | .000 | .000 |
 Jose Miranda | 2-3 | 3 | 1 | 2 | 2 | 1 | 0 | 0 | 0 | .667 | .667 | 2.000 |
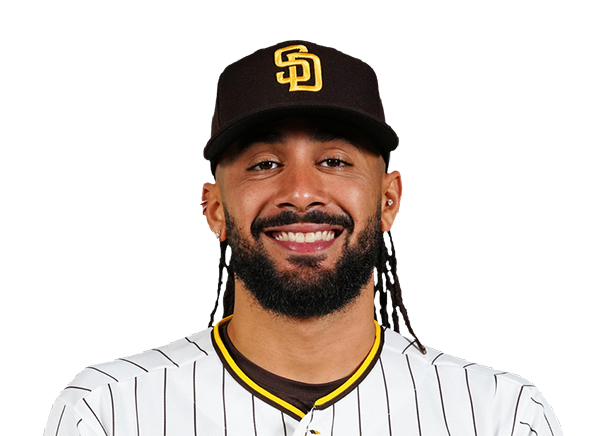 Fernando Tatis Jr. | 0-2 | 2 | 0 | 0 | 0 | 0 | 0 | 1 | 0 | .000 | .000 | .000 |
 Nick Solak | 0-2 | 2 | 0 | 0 | 0 | 0 | 1 | 1 | 0 | .000 | .333 | .000 |
 Jake Cronenworth | 1-2 | 2 | 0 | 1 | 0 | 0 | 0 | 0 | 0 | .500 | .500 | .500 |
 Clay Dungan | 0-2 | 2 | 0 | 0 | 0 | 0 | 0 | 0 | 0 | .000 | .000 | .000 |
 Nick Castellanos | 0-1 | 1 | 0 | 0 | 0 | 0 | 1 | 0 | 0 | .000 | .500 | .000 |
 Romeo Sanabria | 1-2 | 2 | 1 | 1 | 1 | 1 | 0 | 1 | 0 | .500 | .500 | 2.000 |
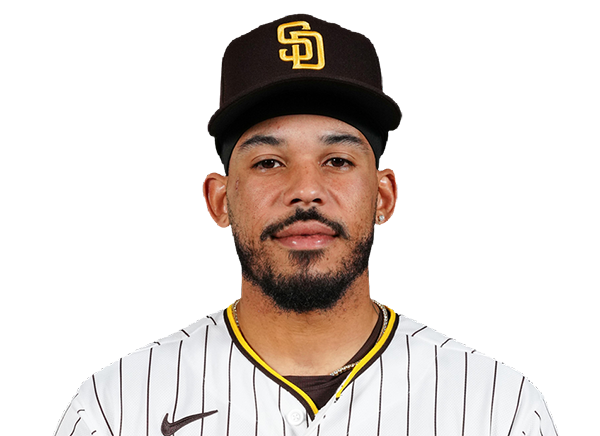 Luis Campusano | 0-2 | 2 | 0 | 0 | 0 | 0 | 0 | 1 | 0 | .000 | .000 | .000 |
 Rodolfo Duran | 0-1 | 1 | 0 | 0 | 0 | 0 | 1 | 0 | 0 | .000 | .500 | .000 |
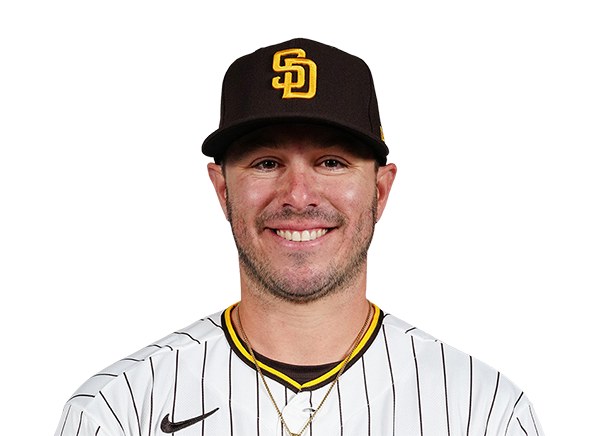 Ty France | 1-2 | 2 | 0 | 1 | 0 | 0 | 0 | 0 | 0 | .500 | .500 | .500 |
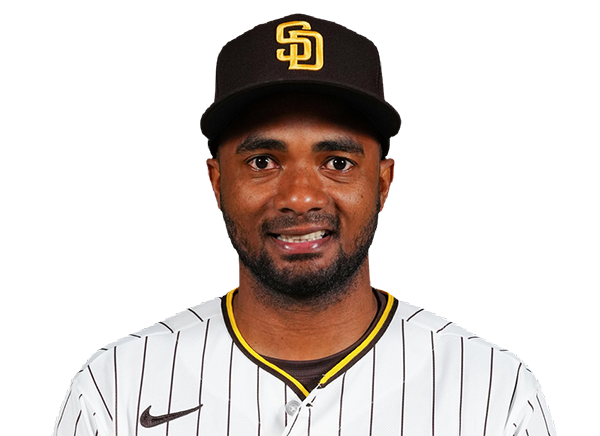 Pablo Reyes | 0-2 | 2 | 0 | 0 | 0 | 0 | 0 | 0 | 0 | .000 | .000 | .000 |
 Nick Schnell | 0-2 | 2 | 0 | 0 | 0 | 0 | 0 | 0 | 0 | .000 | .000 | .000 |
 Samad Taylor | 1-2 | 2 | 1 | 1 | 0 | 0 | 0 | 0 | 0 | .500 | .500 | .500 |
Seattle Mariners
| Player | H-AB | AB | R | H | RBI | HR | BB | K | #P | AVG | OBP | SLG |
|---|---|---|---|---|---|---|---|---|---|---|---|---|
 Luke Raley | 2-2 | 2 | 0 | 2 | 0 | 0 | 0 | 0 | 0 | 1.000 | 1.000 | 1.000 |
 Jonny Farmelo | 1-2 | 2 | 2 | 1 | 0 | 0 | 1 | 1 | 0 | .500 | .667 | .500 |
 Cal Raleigh | 0-3 | 3 | 0 | 0 | 0 | 0 | 0 | 1 | 0 | .000 | .000 | .000 |
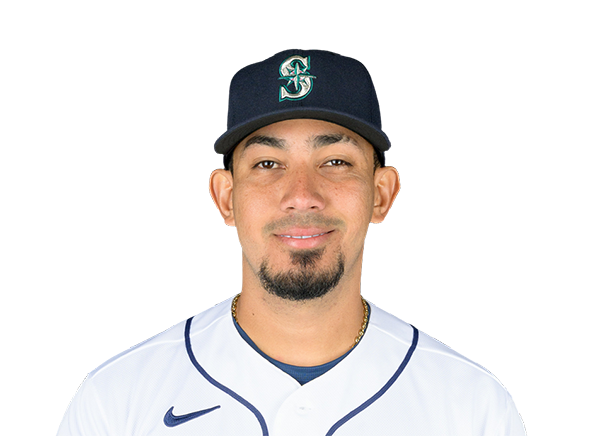 Jhonny Pereda | 0-2 | 2 | 0 | 0 | 0 | 0 | 0 | 2 | 0 | .000 | .000 | .000 |
 Julio Rodriguez | 1-2 | 2 | 0 | 1 | 0 | 0 | 0 | 1 | 0 | .500 | .500 | .500 |
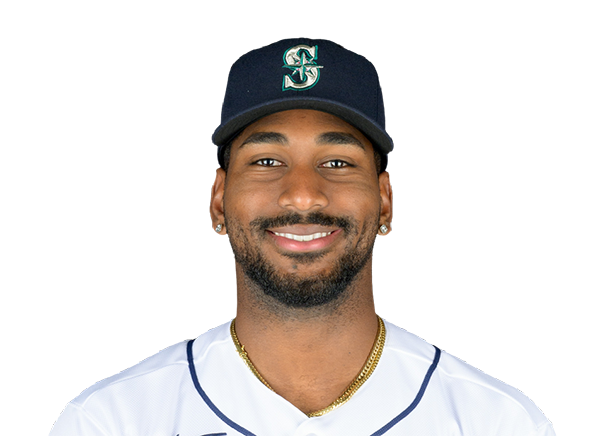 Lazaro Montes | 1-3 | 3 | 0 | 1 | 0 | 0 | 0 | 1 | 0 | .333 | .333 | .333 |
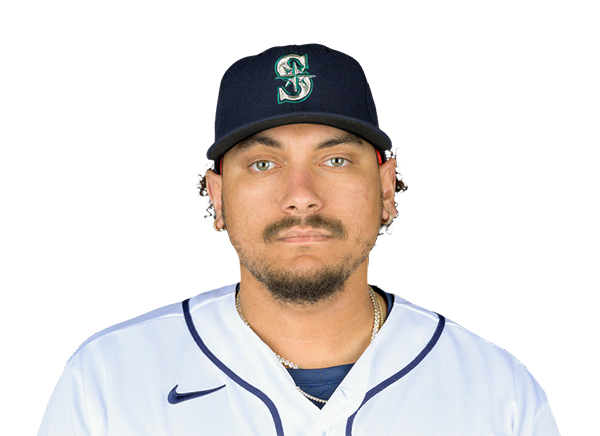 Josh Naylor | 1-2 | 2 | 0 | 1 | 1 | 0 | 0 | 0 | 0 | .500 | .500 | .500 |
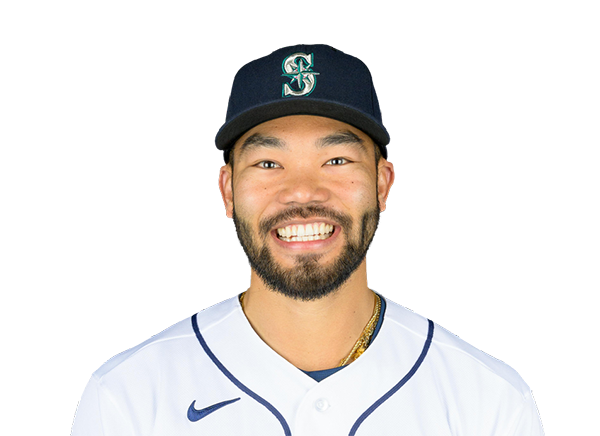 Connor Joe | 1-2 | 2 | 0 | 1 | 2 | 0 | 0 | 1 | 0 | .500 | .500 | .500 |
 Randy Arozarena | 0-2 | 2 | 0 | 0 | 0 | 0 | 0 | 0 | 0 | .000 | .000 | .000 |
 Rhylan Thomas | 1-2 | 2 | 0 | 1 | 0 | 0 | 0 | 0 | 0 | .500 | .500 | .500 |
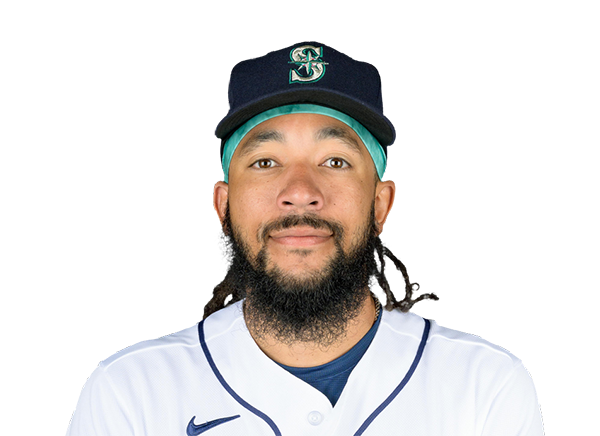 J.P. Crawford | 0-2 | 2 | 0 | 0 | 0 | 0 | 0 | 1 | 0 | .000 | .000 | .000 |
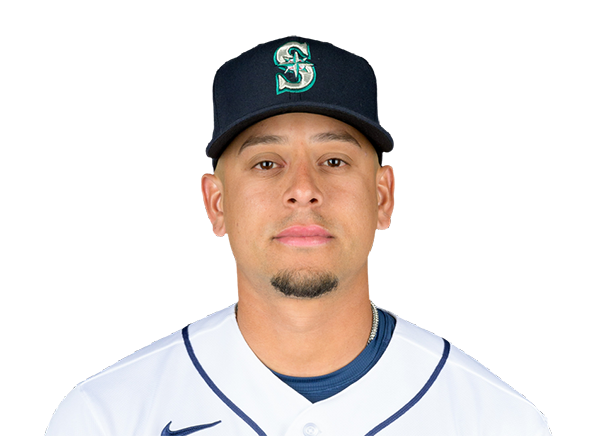 Leo Rivas | 1-2 | 2 | 1 | 1 | 1 | 1 | 0 | 0 | 0 | .500 | .500 | 2.000 |
 Dominic Canzone | 1-2 | 2 | 1 | 1 | 0 | 0 | 0 | 0 | 0 | .500 | .500 | .500 |
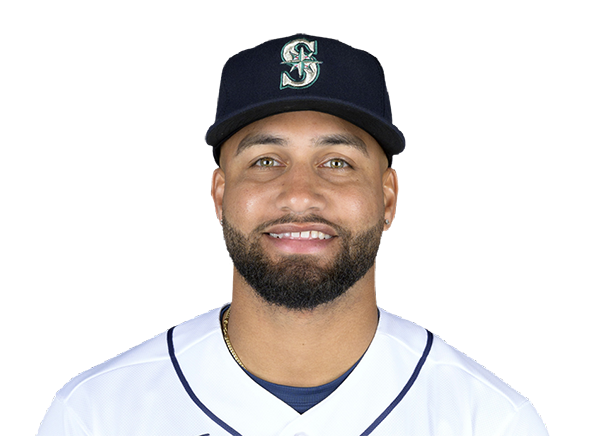 Victor Javier Labrada | 0-1 | 1 | 1 | 0 | 0 | 0 | 0 | 0 | 0 | .000 | .500 | .000 |
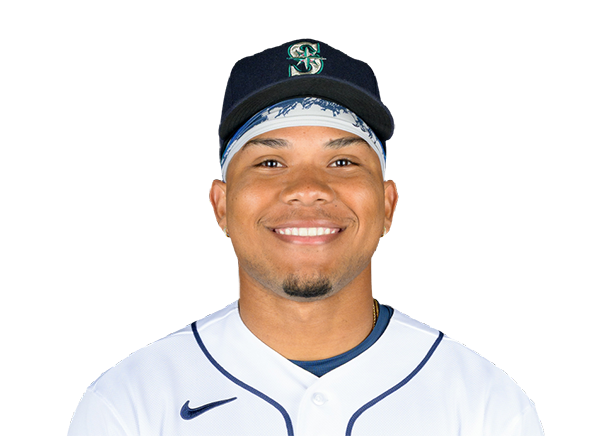 Michael Arroyo | 2-2 | 2 | 1 | 2 | 2 | 1 | 0 | 0 | 0 | 1.000 | 1.000 | 3.000 |
 Miles Mastrobuoni | 1-2 | 2 | 0 | 1 | 0 | 0 | 0 | 0 | 0 | .500 | .500 | 1.000 |
 Colt Emerson | 0-2 | 2 | 0 | 0 | 0 | 0 | 0 | 0 | 0 | .000 | .000 | .000 |
 Will Wilson | 0-1 | 1 | 1 | 0 | 0 | 0 | 1 | 0 | 0 | .000 | .500 | .000 |
San Diego Padres
| Player | IP | H | R | ER | BB | K | HR | PC-ST | ERA | PC |
|---|---|---|---|---|---|---|---|---|---|---|
 Jagger Haynes | 2.0 | 4 | 2 | 2 | 0 | 1 | 1 | ----- | 9.00 | -- |
 Justin Yeager | 1.0 | 2 | 1 | 1 | 0 | 2 | 0 | ----- | 9.00 | -- |
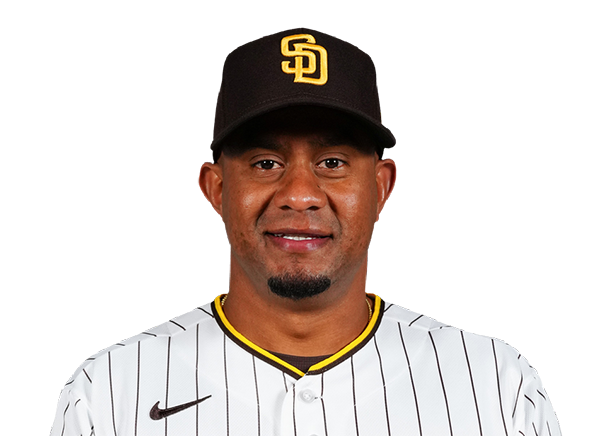 Wandy Peralta | 1.0 | 1 | 0 | 0 | 0 | 0 | 0 | ----- | 0.00 | -- |
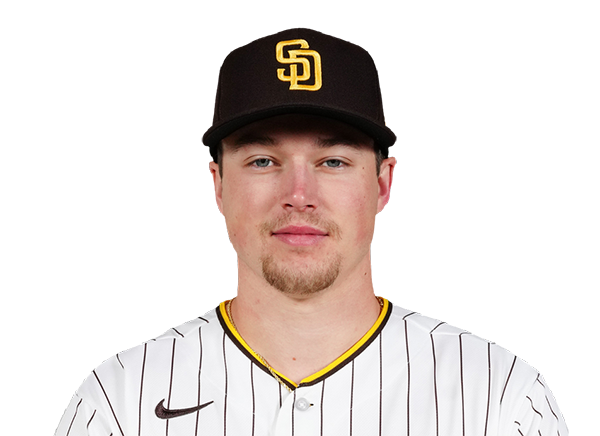 Mason Miller | 1.0 | 1 | 0 | 0 | 0 | 2 | 0 | ----- | 0.00 | -- |
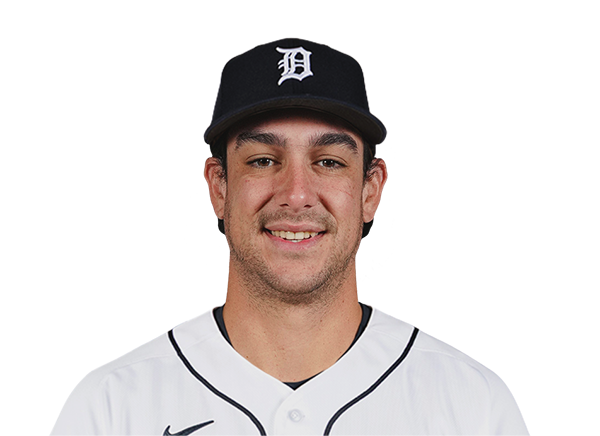 Jackson Wolf | 1.2 | 3 | 2 | 2 | 1 | 1 | 0 | ----- | 10.80 | -- |
 Manuel Castro | 0.2 | 2 | 2 | 2 | 1 | 0 | 1 | ----- | 27.00 | -- |
 Garrett Hawkins | 0.2 | 0 | 0 | 0 | 0 | 2 | 0 | ----- | 0.00 | -- |
Seattle Mariners
| Player | IP | H | R | ER | BB | K | HR | PC-ST | ERA | PC |
|---|---|---|---|---|---|---|---|---|---|---|
 Dane Dunning | 1.2 | 1 | 0 | 0 | 2 | 1 | 0 | ----- | 0.00 | -- |
 James Kingsbury | 0.1 | 0 | 0 | 0 | 0 | 0 | 0 | ----- | 0.00 | -- |
 Cooper Criswell | 2.0 | 1 | 0 | 0 | 0 | 3 | 0 | ----- | 0.00 | -- |
 Michael Rucker | 1.0 | 2 | 0 | 0 | 0 | 0 | 0 | ----- | 0.00 | -- |
 Troy Taylor | 1.0 | 1 | 1 | 1 | 1 | 0 | 1 | ----- | 9.00 | -- |
 Alex Hoppe | 0.2 | 1 | 2 | 2 | 2 | 0 | 1 | ----- | 27.00 | -- |
|
Jason Ruffcorn | 0.1 | 0 | 0 | 0 | 0 | 0 | 0 | ----- | 0.00 | -- |
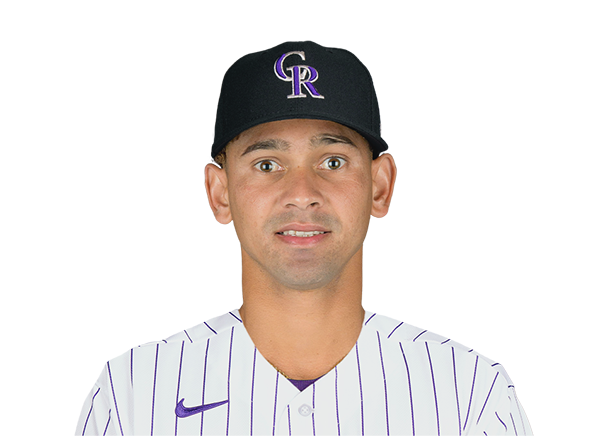 Blas Castano | 1.0 | 0 | 0 | 0 | 0 | 1 | 0 | ----- | 0.00 | -- |
 Nick Davila | 1.0 | 2 | 1 | 1 | 0 | 1 | 0 | ----- | 9.00 | -- |
H2H / Season Series
SD10–3
SEA
SEA6–9
SD
SEA6–27
SD
SD7–1
SEA
SEA7–4
SD
Last 5 Games
| Date | Opponent | Result |
|---|---|---|
| Sep 2 |  @ CIN | L3–7 |
| Sep 1 | @ CIN | L3–4 |
| Aug 31 | @ CIN | W5–0 |
| Aug 30 |  @ TB | L4–5 |
| Aug 29 | @ TB | L6–7 |
| Date | Opponent | Result |
|---|---|---|
| Sep 2 |  @ BOS | W8–3 |
| Sep 1 | @ BOS | W9–6 |
| Aug 31 | @ BOS | L8–9 |
| Aug 30 |  @ TOR | L0–7 |
| Aug 29 | @ TOR | L3–4 |
Standings
American League
| Team | W | L | PCT | GB | DIFF | STRK |
|---|---|---|---|---|---|---|
| 1Rays | 83 | 56 | .597 | - | +51 | L1 |
2 White Sox | 73 | 66 | .525 | 10 | +43 | L1 |
3 Astros | 71 | 69 | .507 | 12.5 | -42 | W1 |
4 Yankees | 80 | 60 | .571 | 3.5 | +115 | W2 |
| 5Red Sox | 75 | 65 | .536 | 8.5 | +77 | L2 |
6 Guardians | 70 | 69 | .504 | 13 | -8 | L1 |
7 Rangers | 69 | 71 | .493 | 14.5 | -48 | L1 |
| 8Blue Jays | 69 | 71 | .493 | 14.5 | -44 | W1 |
9 Orioles | 69 | 71 | .493 | 14.5 | -20 | L2 |
10 Twins | 67 | 73 | .479 | 16.5 | -38 | L1 |
| 11Mariners | 66 | 74 | .471 | 17.5 | -65 | W2 |
12 Tigers | 64 | 75 | .460 | 19 | +47 | W1 |
13 Royals | 62 | 78 | .443 | 21.5 | -89 | L3 |
14 Athletics | 54 | 86 | .386 | 29.5 | -194 | W1 |
15 Angels | 53 | 87 | .379 | 30.5 | -80 | L2 |
National League
| Team | W | L | PCT | GB | DIFF | STRK |
|---|---|---|---|---|---|---|
1 Brewers | 87 | 53 | .621 | - | +172 | W2 |
2 Braves | 83 | 57 | .593 | 4 | +118 | W1 |
3 Dodgers | 82 | 57 | .590 | 4.5 | +146 | L2 |
4 Phillies | 79 | 61 | .564 | 8 | +36 | L1 |
5 Cubs | 78 | 62 | .557 | 9 | +132 | L2 |
6 Diamondbacks | 74 | 67 | .525 | 13.5 | -1 | W1 |
| 7Padres | 73 | 67 | .521 | 14 | +10 | L2 |
8 Marlins | 71 | 69 | .507 | 16 | +18 | W2 |
9 Cardinals | 70 | 70 | .500 | 17 | -8 | W2 |
10 Pirates | 68 | 72 | .486 | 19 | +26 | L1 |
| 11Reds | 67 | 73 | .479 | 20 | -108 | W2 |
12 Nationals | 67 | 75 | .472 | 21 | +14 | L1 |
13 Mets | 63 | 77 | .450 | 24 | -50 | W1 |
14 Giants | 58 | 82 | .414 | 29 | -70 | W1 |
15 Rockies | 54 | 86 | .386 | 33 | -140 | W2 |
SD
VS
SEA
Pitchers
Jagger Haynes
Justin Yeager
Wandy Peralta
Mason Miller
Jackson Wolf
Manuel Castro
Garrett Hawkins
Catchers
Luis Campusano
Rodolfo Duran
Infielders
Xander Bogaerts
Francisco Acuna
Manny Machado
Jose Miranda
Jake Cronenworth
Clay Dungan
Nick Castellanos
Romeo Sanabria
Outfielders
Jackson Merrill
Jase Bowen
Fernando Tatis Jr.
Nick Solak
Nick Schnell
Samad Taylor
Designated Hitters
Ty France
Pablo Reyes
Pitchers
Dane Dunning
James Kingsbury
Cooper Criswell
Michael Rucker
Troy Taylor
Alex Hoppe
Jason Ruffcorn
Blas Castano
Nick Davila
Catchers
Cal Raleigh
Jhonny Pereda
Infielders
Josh Naylor
Connor Joe
J.P. Crawford
Leo Rivas
Michael Arroyo
Miles Mastrobuoni
Colt Emerson
Will Wilson
Outfielders
Luke Raley
Jonny Farmelo
Randy Arozarena
Rhylan Thomas
Dominic Canzone
Victor Javier Labrada
Designated Hitters
Julio Rodriguez
Lazaro Montes
Padres
VS
Mariners
Batting
140
Team Games Played
140
4617
At Bats
4635
1096
Hits
1061
572
Runs Batted In
534
153
Home Runs
162
138
Stolen Bases
94
.237
Batting Average
.229
594
Runs
555
202
Doubles
168
14
Triples
14
1785
Total Bases
1743
485
Walks
472
1139
Strikeouts
1217
.315
On Base Percentage
.309
.387
Slugging Percentage
.376
.701
OBP Pct + SLG Pct
.686
140
Games Played
140
140
Games Started
140
53
Hit By Pitch
83
0.0
Wins Above Replacement
0.0
0.0
Offensive Wins Above Replacement
0.0
39
Caught Stealing
35
1
Is Qualified
1
572.9
Runs Created
551.0
4.1
Runs Created Per 27 Outs
4.0
.093
Walks Per Plate Appearance
.090
0.43
Walk To Strikeout Ratio
0.39
.149
Isolated Power
.147
.276
Secondary Average
.262
3.92
Pitches Per Plate Appearance
3.91
369
Extra Base Hits
344
5217
Plate Appearances
5234
30.2
At Bats Per Home Run
28.6
21
Sacrifice Hit
11
38
Sacrifice Flies
32
Pitching
140
Team Games Played
140
32
Quality Starts
59
73
Wins
66
67
Losses
74
40
Saves
30
86
Holds
73
1125
Hits
1178
542
Earned runs
574
155
Home Runs
166
475
Walks
367
1131
Strikeouts
1178
8.2
Strikeouts Per 9 Innings
8.6
147.0
Pitches Per Start
142.5
1.29
Walks Plus Hits Per Inning Pitched
1.25
3.94
Earned Run Average
4.18
67
Losses
74
1238.1
Innings pitched
1235.1
.521
Win Percentage
.471
58
Save Opportunities
52
.242
Opponent Batting Average
.250
.318
Opponent's On-base pct.
.310
.391
Opponent's Slugging pct.
.410
.709
Opponent's OPB Pct + SLG Pct
.721
4654
At Bats
4706
198
Doubles
229
16
Triples
13
58
Batters Hit
60
92
Stolen Bases
100
140
Games Played
140
0
Complete Games
1
11
Shutouts
9
38
Wild Pitches
31
563
Runs Batted In
586
4
Balks
4
1238.1
Innings pitched
1235.1
8.2
Strikeouts Per 9 Innings
8.6
44
Caught Stealing
29
140
Games Started
140
0.0
Wins Above Replacement
0.0
1
Is Qualified
1
584
Runs
620
542
Earned Runs
574
1820
Total Bases
1931
Fielding
140
Team Games Played
140
1238
Full Innings
1235
5010
Total Chances
4928
3715
Putouts
3706
1236
Assists
1150
59
Errors
72
202
Double Plays
168
0.988
Fielding Percentage
0.985
36.0
Range Factor
35.4
0.0
Zone Rating
0.0
140
Games Played
140
0
Games Started
0
0.0
Defensive Wins Above Replacement
0.0
1
Qualified
1