

Padres vs Marlins Live Score (25 Jul, 2026)
Game Information
Stage
Standard
Season
2026
First Pitch
Sat, Jul 25, 4:10 pm
Venue
loanDepot park
Location
Miami, Florida
Attendance
22,319
Live Situation
0Balls
2Strikes
0Outs
—Pitcher
—At Bat
Pitch Sequence
1
STRIKE LOOKING
Sinker
92 MPH
2
STRIKE FOUL
Sinker
92 MPH
3
BALL IN PLAY
Knuckleball
84 MPH
Injury Report








Team Stats
 SD
MIA


7
Runs
2
11
Hits
5
0
Errors
0
0
Home Runs
0
4
Walks
3
3
Strikeouts
5
Player Box Score
San Diego Padres
| Player | H-AB | AB | R | H | RBI | HR | BB | K | #P | AVG | OBP | SLG |
|---|---|---|---|---|---|---|---|---|---|---|---|---|
 Fernando Tatis Jr. | 0-4 | 4 | 1 | 0 | 0 | 0 | 1 | 0 | 21 | .280 | .349 | .398 |
 Jake Cronenworth | 1-3 | 3 | 2 | 1 | 1 | 0 | 2 | 1 | 33 | .206 | .311 | .288 |
 Manny Machado | 1-5 | 5 | 1 | 1 | 0 | 0 | 0 | 1 | 13 | .207 | .295 | .428 |
 Ty France | 2-4 | 4 | 1 | 2 | 3 | 0 | 0 | 1 | 12 | .283 | .336 | .549 |
 Jackson Merrill | 3-4 | 4 | 2 | 3 | 0 | 0 | 0 | 0 | 11 | .228 | .282 | .382 |
 Luis Rengifo | 1-3 | 3 | 0 | 1 | 0 | 0 | 1 | 0 | 19 | .423 | .483 | .654 |
 Gavin Sheets | 0-2 | 2 | 0 | 0 | 1 | 0 | 0 | 0 | 14 | .213 | .311 | .400 |
 Jase Bowen | 1-1 | 1 | 0 | 1 | 2 | 0 | 0 | 0 | 1 | .148 | .193 | .185 |
 Xander Bogaerts | 1-4 | 4 | 0 | 1 | 0 | 0 | 0 | 0 | 15 | .218 | .314 | .322 |
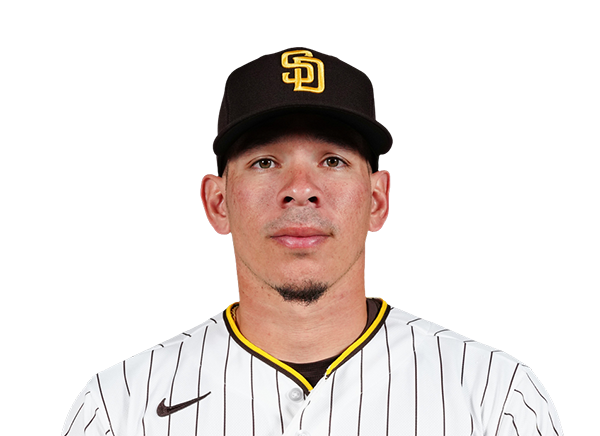 Freddy Fermin | 1-3 | 3 | 0 | 1 | 0 | 0 | 0 | 0 | 14 | .166 | .260 | .278 |
Miami Marlins
| Player | H-AB | AB | R | H | RBI | HR | BB | K | #P | AVG | OBP | SLG |
|---|---|---|---|---|---|---|---|---|---|---|---|---|
 Otto Lopez | 1-2 | 2 | 0 | 1 | 1 | 0 | 1 | 0 | 23 | .331 | .366 | .495 |
 Kyle Stowers | 1-3 | 3 | 0 | 1 | 1 | 0 | 1 | 1 | 14 | .230 | .313 | .427 |
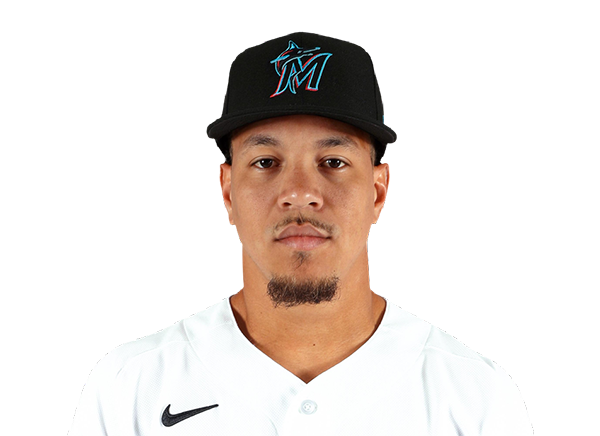 Heriberto Hernandez | 0-4 | 4 | 0 | 0 | 0 | 0 | 0 | 1 | 19 | .246 | .317 | .483 |
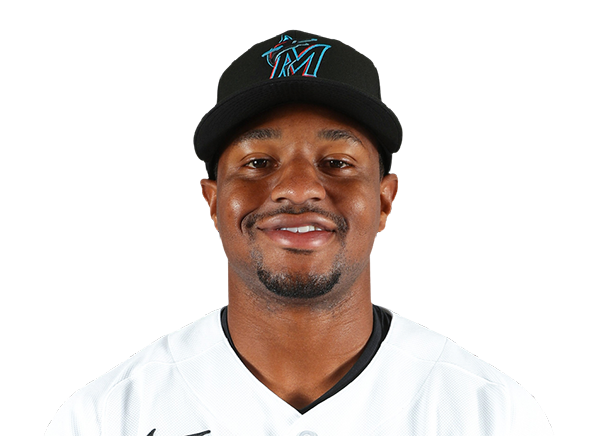 Xavier Edwards | 0-4 | 4 | 0 | 0 | 0 | 0 | 0 | 0 | 19 | .289 | .370 | .404 |
 Liam Hicks | 0-4 | 4 | 0 | 0 | 0 | 0 | 0 | 0 | 10 | .279 | .356 | .442 |
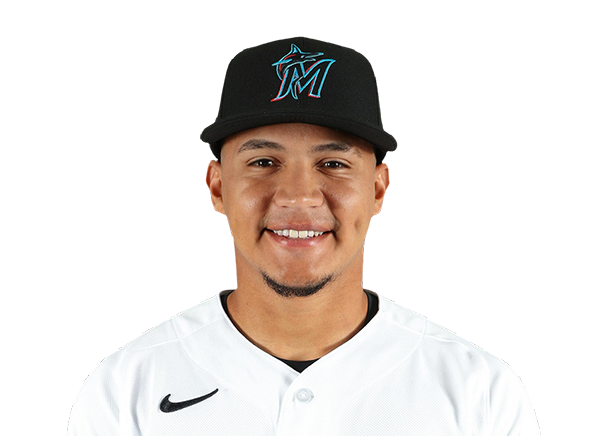 Javier Sanoja | 0-4 | 4 | 0 | 0 | 0 | 0 | 0 | 0 | 15 | .266 | .303 | .394 |
 Griffin Conine | 0-3 | 3 | 0 | 0 | 0 | 0 | 0 | 2 | 14 | .262 | .345 | .515 |
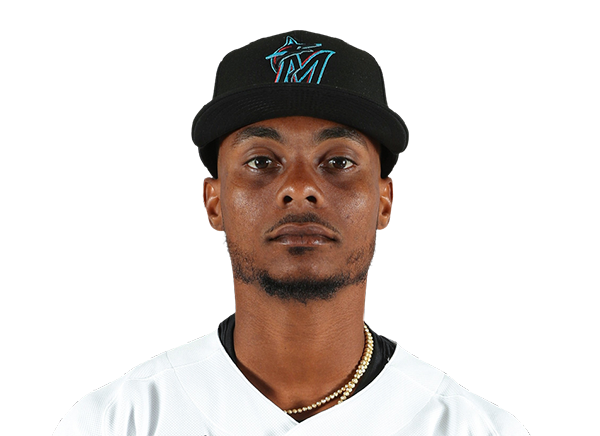 Esteury Ruiz | 2-2 | 2 | 2 | 2 | 0 | 0 | 0 | 0 | 10 | .255 | .371 | .482 |
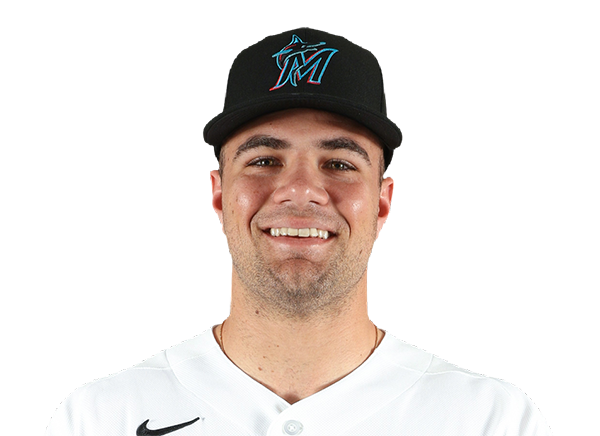 Jakob Marsee | 1-2 | 2 | 0 | 1 | 0 | 0 | 1 | 1 | 19 | .195 | .316 | .289 |
San Diego Padres
| Player | IP | H | R | ER | BB | K | HR | PC-ST | ERA | PC |
|---|---|---|---|---|---|---|---|---|---|---|
 Randy Vasquez | 2.2 | 1 | 1 | 1 | 2 | 0 | 0 | 37-19 | 4.68 | 37 |
 JP Sears | 3.1 | 1 | 0 | 0 | 1 | 3 | 0 | 55-34 | 3.86 | 55 |
 Yuki Matsui | 1.0 | 0 | 0 | 0 | 0 | 1 | 0 | 12-8 | 2.61 | 12 |
 Matt Waldron | 2.0 | 3 | 1 | 1 | 0 | 1 | 0 | 39-29 | 7.16 | 39 |
Miami Marlins
| Player | IP | H | R | ER | BB | K | HR | PC-ST | ERA | PC |
|---|---|---|---|---|---|---|---|---|---|---|
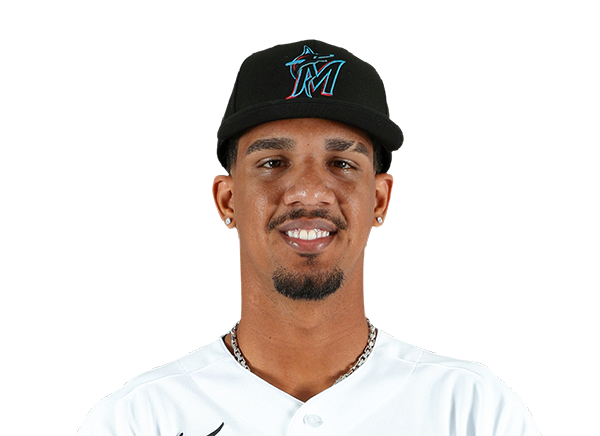 Eury Perez | 7.0 | 7 | 3 | 3 | 1 | 2 | 0 | 104-69 | 3.56 | 104 |
 Dax Fulton | 2.0 | 4 | 4 | 4 | 3 | 1 | 0 | 49-28 | 5.25 | 49 |
H2H / Season Series
MIA3–5
SD
MIA2–7
SD
MIA2–4
SD
Last 5 Games
| Date | Opponent | Result |
|---|---|---|
| Aug 22 |  vs MIN | W7–5 |
| Aug 21 | vs MIN | W6–2 |
| Aug 19 |  @ NYM | L2–4 |
| Aug 18 | @ NYM | W5–2 |
| Aug 17 | @ NYM | L1–2 |
| Date | Opponent | Result |
|---|---|---|
| Aug 22 |  vs WSH | W4–2 |
| Aug 21 | vs WSH | W3–2 |
| Aug 19 |  @ PHI | L1–4 |
| Aug 18 | @ PHI | L4–6 |
| Aug 17 | @ PHI | L5–6 |
Standings
American League
| Team | W | L | PCT | GB | DIFF | STRK |
|---|---|---|---|---|---|---|
1 Rays | 76 | 53 | .589 | - | +42 | L3 |
2 White Sox | 67 | 62 | .519 | 9 | +42 | L1 |
3 Astros | 65 | 65 | .500 | 11.5 | -43 | L1 |
4 Yankees | 73 | 56 | .566 | 3 | +95 | L1 |
5 Red Sox | 70 | 59 | .543 | 6 | +98 | W2 |
6 Rangers | 64 | 66 | .492 | 12.5 | -48 | L1 |
7 Guardians | 64 | 66 | .492 | 12.5 | -14 | W3 |
8 Blue Jays | 64 | 67 | .489 | 13 | -50 | W1 |
| 9Twins | 63 | 67 | .485 | 13.5 | -47 | L2 |
10 Orioles | 63 | 67 | .485 | 13.5 | -33 | W2 |
11 Mariners | 62 | 68 | .477 | 14.5 | -44 | W2 |
12 Tigers | 61 | 68 | .473 | 15 | +77 | L4 |
13 Royals | 57 | 74 | .435 | 20 | -95 | W7 |
14 Angels | 52 | 78 | .400 | 24.5 | -68 | W1 |
15 Athletics | 50 | 80 | .385 | 26.5 | -188 | W1 |
National League
| Team | W | L | PCT | GB | DIFF | STRK |
|---|---|---|---|---|---|---|
1 Brewers | 81 | 49 | .623 | - | +163 | W3 |
2 Dodgers | 79 | 51 | .608 | 2 | +147 | W5 |
3 Braves | 75 | 55 | .577 | 6 | +108 | L2 |
4 Cubs | 74 | 56 | .569 | 7 | +98 | L3 |
| 5Phillies | 72 | 58 | .554 | 9 | +25 | W8 |
| 6Padres | 70 | 60 | .538 | 11 | +9 | W2 |
7 Diamondbacks | 68 | 62 | .523 | 13 | +7 | L1 |
| 8Marlins | 66 | 64 | .508 | 15 | +17 | W2 |
9 Cardinals | 66 | 65 | .504 | 15.5 | 0 | L2 |
10 Pirates | 63 | 68 | .481 | 18.5 | +29 | L2 |
11 Reds | 62 | 68 | .477 | 19 | -92 | W1 |
| 12Nationals | 61 | 70 | .466 | 20.5 | +14 | L3 |
| 13Mets | 59 | 71 | .454 | 22 | -39 | W1 |
14 Giants | 52 | 77 | .403 | 28.5 | -79 | L3 |
15 Rockies | 50 | 79 | .388 | 30.5 | -131 | L5 |
SD
VS
MIA
Pitchers
Randy Vasquez
JP Sears
Yuki Matsui
Matt Waldron
Catchers
Freddy Fermin
Infielders
Jake Cronenworth
Manny Machado
Ty France
Xander Bogaerts
Outfielders
Jackson Merrill
Luis Rengifo
Gavin Sheets
Jase Bowen
Designated Hitters
Fernando Tatis Jr.
Pitchers
Eury Perez
Dax Fulton
Catchers
Liam Hicks
Infielders
Otto Lopez
Kyle Stowers
Xavier Edwards
Javier Sanoja
Outfielders
Heriberto Hernandez
Esteury Ruiz
Jakob Marsee
Designated Hitters
Griffin Conine
Padres
VS
Marlins
Batting
130
Team Games Played
130
4278
At Bats
4313
1020
Hits
1075
536
Runs Batted In
544
145
Home Runs
133
124
Stolen Bases
132
.238
Batting Average
.249
556
Runs
567
189
Doubles
203
11
Triples
28
1666
Total Bases
1733
446
Walks
440
1056
Strikeouts
1059
.315
On Base Percentage
.326
.389
Slugging Percentage
.402
.705
OBP Pct + SLG Pct
.728
130
Games Played
130
0
Games Started
0
51
Hit By Pitch
70
0.0
Wins Above Replacement
0.0
0.0
Offensive Wins Above Replacement
0.0
33
Caught Stealing
42
1
Is Qualified
1
535.6
Runs Created
585.0
4.2
Runs Created Per 27 Outs
4.6
.092
Walks Per Plate Appearance
.090
0.42
Walk To Strikeout Ratio
0.42
.151
Isolated Power
.153
.277
Secondary Average
.275
3.92
Pitches Per Plate Appearance
3.81
345
Extra Base Hits
364
4831
Plate Appearances
4882
29.5
At Bats Per Home Run
32.4
19
Sacrifice Hit
19
35
Sacrifice Flies
39
Pitching
130
Team Games Played
130
28
Quality Starts
45
70
Wins
66
60
Losses
64
39
Saves
30
81
Holds
72
1047
Hits
992
515
Earned runs
496
143
Home Runs
129
444
Walks
432
1046
Strikeouts
1068
8.2
Strikeouts Per 9 Innings
8.4
0.0
Pitches Per Start
0.0
1.30
Walks Plus Hits Per Inning Pitched
1.25
4.04
Earned Run Average
3.92
60
Losses
64
1148.0
Innings pitched
1139.0
.538
Win Percentage
.508
54
Save Opportunities
47
.243
Opponent Batting Average
.232
.319
Opponent's On-base pct.
.310
.393
Opponent's Slugging pct.
.374
.712
Opponent's OPB Pct + SLG Pct
.684
4317
At Bats
4279
189
Doubles
183
16
Triples
19
52
Batters Hit
64
81
Stolen Bases
109
130
Games Played
130
0
Complete Games
1
0
Shutouts
1
34
Wild Pitches
37
0
Runs Batted In
0
5
Balks
5
1148.0
Innings pitched
1139.0
8.2
Strikeouts Per 9 Innings
8.4
40
Caught Stealing
33
130
Games Started
130
0.0
Wins Above Replacement
0.0
1
Is Qualified
1
547
Runs
550
510
Earned Runs
495
1697
Total Bases
1600
Fielding
130
Team Games Played
130
1148
Full Innings
1139
4640
Total Chances
4574
3444
Putouts
3417
1141
Assists
1074
55
Errors
83
189
Double Plays
203
0.988
Fielding Percentage
0.982
35.9
Range Factor
35.5
0.0
Zone Rating
0.0
130
Games Played
130
0
Games Started
0
0.0
Defensive Wins Above Replacement
0.0
1
Qualified
1