

Padres vs Mets Live Score (17 Aug, 2026)
Game Information
Stage
Standard
Season
2026
First Pitch
Mon, Aug 17, 7:10 pm
Venue
Citi Field
Location
Queens, New York
Attendance
27,842
Home Runs
Manny Machado
23 HR
.211 AVG
70 RBI

Juan Soto
21 HR
.283 AVG
52 RBI
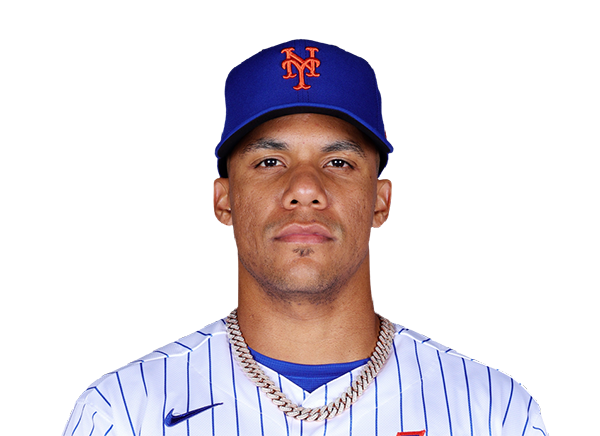
Batting Average
Fernando Tatis Jr.
.280 AVG
.355 OBP
.423 SLG
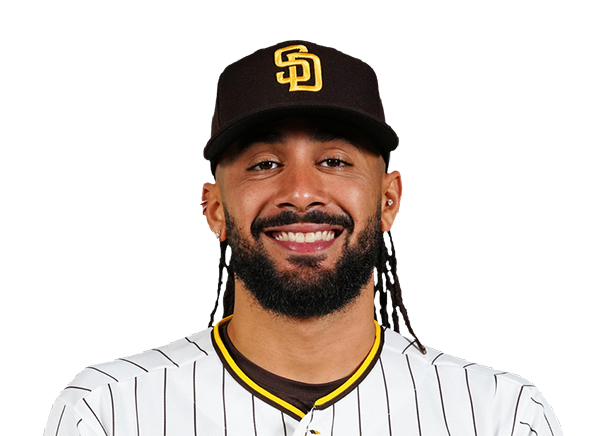
Carson Benge
.272 AVG
.335 OBP
.415 SLG

Runs Batted In
Manny Machado
70 RBI
23 HR
.211 AVG
Bo Bichette
62 RBI
12 HR
.266 AVG
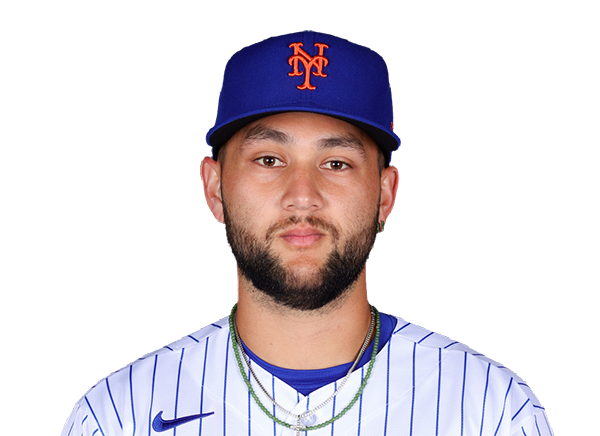
Earned Run Average
Michael King
3.41 ERA
8 W
124 K

Nolan McLean
3.42 ERA
8 W
159 K

Wins
Adrian Morejon
9 W
2.71 ERA
80 K
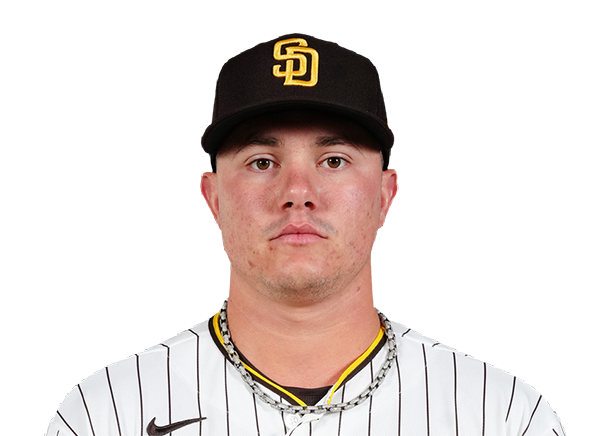
Nolan McLean
8 W
3.42 ERA
159 K
Strikeouts
Michael King
124 K
8 W
3.41 ERA
Nolan McLean
159 K
8 W
3.42 ERA
Injury Report
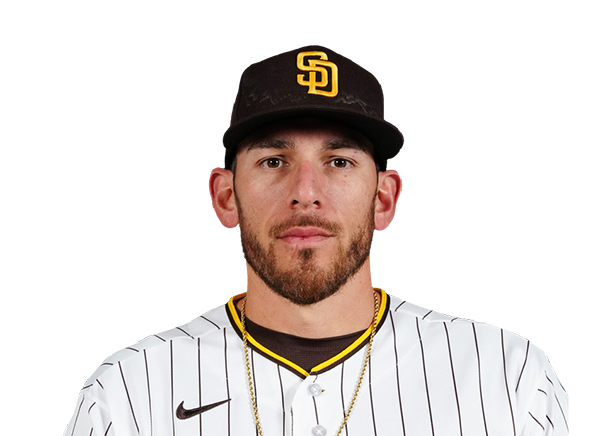


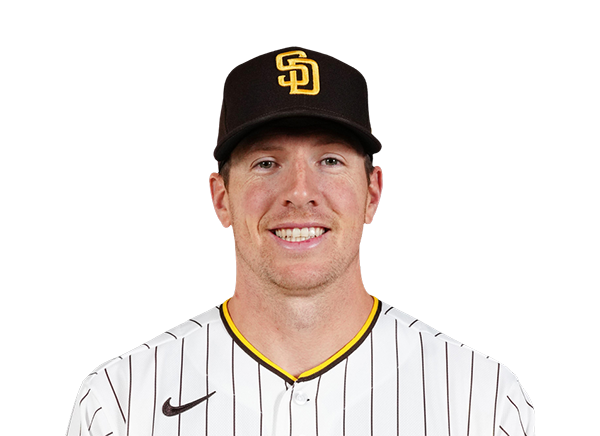
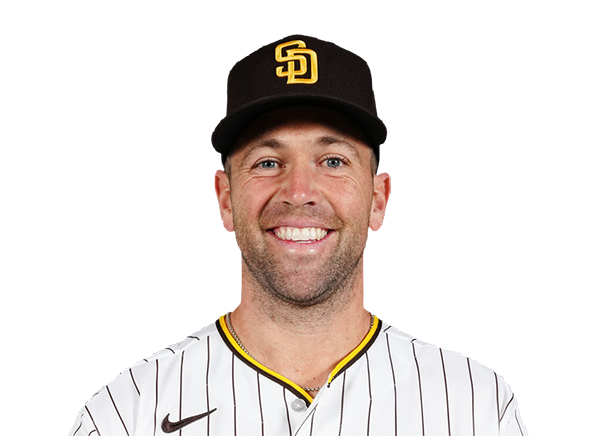


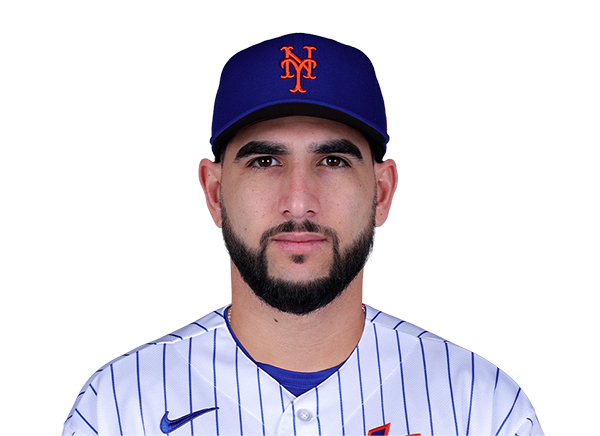
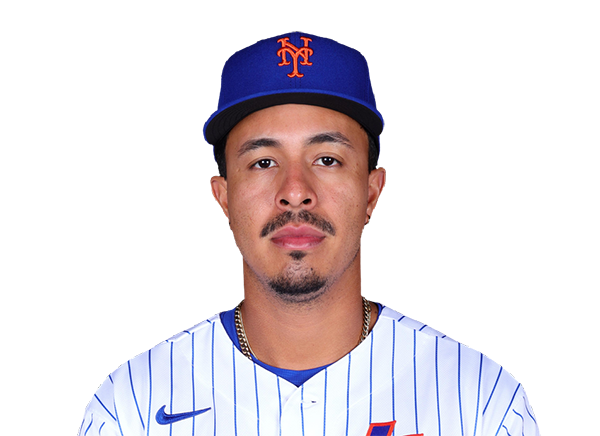
Team Stats
 SD
NYM


Array
Runs
Array
7
Hits
5
0
Errors
0
—
Home Runs
—
—
Walks
—
—
Strikeouts
—
Standings
American League
| Team | W | L | PCT | GB | DIFF | STRK |
|---|---|---|---|---|---|---|
1 Rays | 76 | 53 | .589 | - | +42 | L3 |
2 White Sox | 67 | 62 | .519 | 9 | +42 | L1 |
3 Astros | 65 | 65 | .500 | 11.5 | -43 | L1 |
4 Yankees | 73 | 56 | .566 | 3 | +95 | L1 |
5 Red Sox | 70 | 59 | .543 | 6 | +98 | W2 |
6 Rangers | 64 | 66 | .492 | 12.5 | -48 | L1 |
7 Guardians | 64 | 66 | .492 | 12.5 | -14 | W3 |
8 Blue Jays | 64 | 67 | .489 | 13 | -50 | W1 |
9 Twins | 63 | 67 | .485 | 13.5 | -47 | L2 |
10 Orioles | 63 | 67 | .485 | 13.5 | -33 | W2 |
11 Mariners | 62 | 68 | .477 | 14.5 | -44 | W2 |
12 Tigers | 61 | 68 | .473 | 15 | +77 | L4 |
13 Royals | 57 | 74 | .435 | 20 | -95 | W7 |
14 Angels | 52 | 78 | .400 | 24.5 | -68 | W1 |
15 Athletics | 50 | 80 | .385 | 26.5 | -188 | W1 |
National League
| Team | W | L | PCT | GB | DIFF | STRK |
|---|---|---|---|---|---|---|
1 Brewers | 81 | 49 | .623 | - | +163 | W3 |
2 Dodgers | 79 | 51 | .608 | 2 | +147 | W5 |
3 Braves | 75 | 55 | .577 | 6 | +108 | L2 |
4 Cubs | 74 | 56 | .569 | 7 | +98 | L3 |
5 Phillies | 72 | 58 | .554 | 9 | +25 | W8 |
| 6Padres | 70 | 60 | .538 | 11 | +9 | W2 |
7 Diamondbacks | 68 | 62 | .523 | 13 | +7 | L1 |
8 Marlins | 66 | 64 | .508 | 15 | +17 | W2 |
9 Cardinals | 66 | 65 | .504 | 15.5 | 0 | L2 |
10 Pirates | 63 | 68 | .481 | 18.5 | +29 | L2 |
11 Reds | 62 | 68 | .477 | 19 | -92 | W1 |
12 Nationals | 61 | 70 | .466 | 20.5 | +14 | L3 |
| 13Mets | 59 | 71 | .454 | 22 | -39 | W1 |
14 Giants | 52 | 77 | .403 | 28.5 | -79 | L3 |
15 Rockies | 50 | 79 | .388 | 30.5 | -131 | L5 |
SD
VS
NYM
Pitchers

Walker Buehler
Catchers
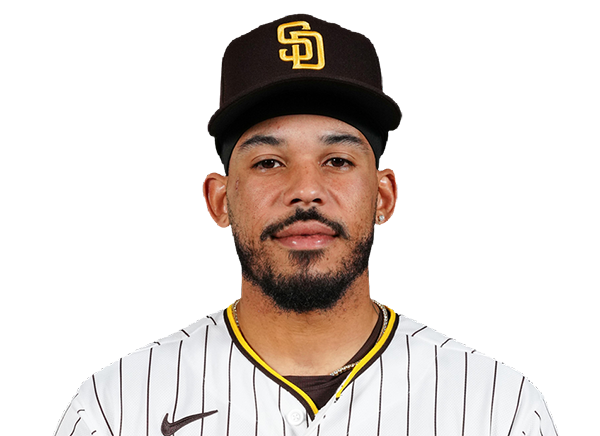
Luis Campusano
Infielders

Jake Cronenworth
Manny Machado
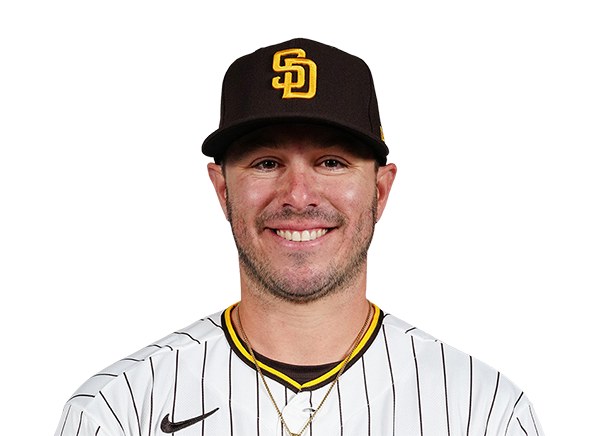
Ty France

Xander Bogaerts
Outfielders
Fernando Tatis Jr.

Jackson Merrill

Luis Rengifo
Designated Hitters

Gavin Sheets
Pitchers
Nolan McLean
Catchers
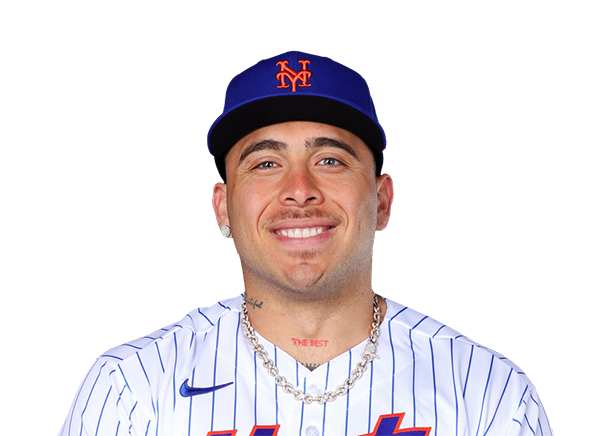
Francisco Alvarez
Infielders
Francisco Lindor
Bo Bichette

Jared Young

Marcus Semien
Outfielders

A.J. Ewing
Carson Benge

Luis Robert Jr.
Designated Hitters

Jorge Polanco
Padres
VS
Mets
Batting
126
Team Games Played
126
4147
At Bats
4228
986
Hits
996
517
Runs Batted In
502
140
Home Runs
152
124
Stolen Bases
64
.238
Batting Average
.236
536
Runs
525
183
Doubles
157
11
Triples
17
1611
Total Bases
1643
431
Walks
407
1016
Strikeouts
1073
.315
On Base Percentage
.307
.388
Slugging Percentage
.389
.703
OBP Pct + SLG Pct
.696
126
Games Played
126
126
Games Started
126
50
Hit By Pitch
42
0.0
Wins Above Replacement
0.0
0.0
Offensive Wins Above Replacement
0.0
33
Caught Stealing
27
1
Is Qualified
1
517.8
Runs Created
507.2
4.2
Runs Created Per 27 Outs
4.0
.092
Walks Per Plate Appearance
.086
0.42
Walk To Strikeout Ratio
0.38
.151
Isolated Power
.153
.277
Secondary Average
.258
3.92
Pitches Per Plate Appearance
3.93
334
Extra Base Hits
326
4682
Plate Appearances
4728
29.6
At Bats Per Home Run
27.8
19
Sacrifice Hit
16
34
Sacrifice Flies
31
Pitching
126
Team Games Played
126
25
Quality Starts
37
67
Wins
57
59
Losses
69
37
Saves
24
78
Holds
54
1022
Hits
1010
503
Earned runs
507
137
Home Runs
135
435
Walks
447
1022
Strikeouts
1131
8.3
Strikeouts Per 9 Innings
9.1
147.0
Pitches Per Start
148.6
1.31
Walks Plus Hits Per Inning Pitched
1.30
4.07
Earned Run Average
4.07
59
Losses
69
1113.0
Innings pitched
1121.2
.532
Win Percentage
.452
52
Save Opportunities
38
.244
Opponent Batting Average
.238
.321
Opponent's On-base pct.
.318
.394
Opponent's Slugging pct.
.392
.714
Opponent's OPB Pct + SLG Pct
.709
4187
At Bats
4249
185
Doubles
212
15
Triples
19
50
Batters Hit
63
79
Stolen Bases
56
126
Games Played
126
0
Complete Games
0
9
Shutouts
5
34
Wild Pitches
31
516
Runs Batted In
540
3
Balks
3
1113.0
Innings pitched
1121.2
8.3
Strikeouts Per 9 Innings
9.1
40
Caught Stealing
27
126
Games Started
126
0.0
Wins Above Replacement
0.0
1
Is Qualified
1
534
Runs
566
503
Earned Runs
507
1648
Total Bases
1665
Fielding
126
Team Games Played
126
1113
Full Innings
1122
4498
Total Chances
4443
3339
Putouts
3365
1106
Assists
997
53
Errors
81
183
Double Plays
157
0.988
Fielding Percentage
0.982
35.9
Range Factor
35.0
0.0
Zone Rating
0.0
126
Games Played
126
0
Games Started
0
0.0
Defensive Wins Above Replacement
0.0
1
Qualified
1