

Padres vs Reds Live Score (2 Sep, 2026)
Game Information
Stage
STD
Season
2026
First Pitch
Wed, Sep 2, 12:40 pm
Venue
Great American Ball Park
Location
Cincinnati, Ohio
Venue Type
Outdoor
Broadcast
MLB.TV
Attendance
14,632
Live Situation
1Balls
3Strikes
0Outs
—Pitcher
—At Bat
Pitch Sequence
1
STRIKE LOOKING
Splitter
83 MPH
2
STRIKE FOUL
Cutter
86 MPH
3
BALL
Cutter
86 MPH
4
STRIKE FOUL
Four-seam FB
96 MPH
5
STRIKE FOUL
Four-seam FB
96 MPH
6
STRIKE SWINGING
Cutter
86 MPH
Injury Report






Team Stats
 SD
CIN


3
Runs
7
7
Hits
10
1
Errors
0
1
Home Runs
3
4
Walks
2
10
Strikeouts
7
Player Box Score
San Diego Padres
| Player | H-AB | AB | R | H | RBI | HR | BB | K | #P | AVG | OBP | SLG |
|---|---|---|---|---|---|---|---|---|---|---|---|---|
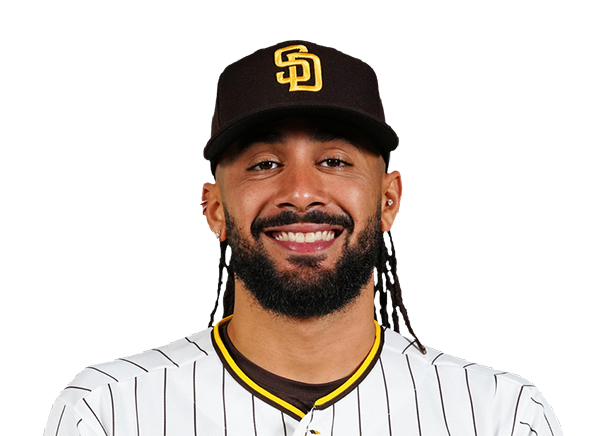 Fernando Tatis Jr. | 2-4 | 4 | 1 | 2 | 1 | 0 | 0 | 2 | 19 | .284 | .350 | .449 |
 Samad Taylor | 0-3 | 3 | 0 | 0 | 0 | 0 | 1 | 1 | 20 | .333 | .418 | .417 |
 Jackson Merrill | 0-4 | 4 | 0 | 0 | 0 | 0 | 0 | 0 | 10 | .241 | .293 | .418 |
 Ty France | 2-3 | 3 | 1 | 2 | 2 | 1 | 1 | 0 | 15 | .292 | .360 | .512 |
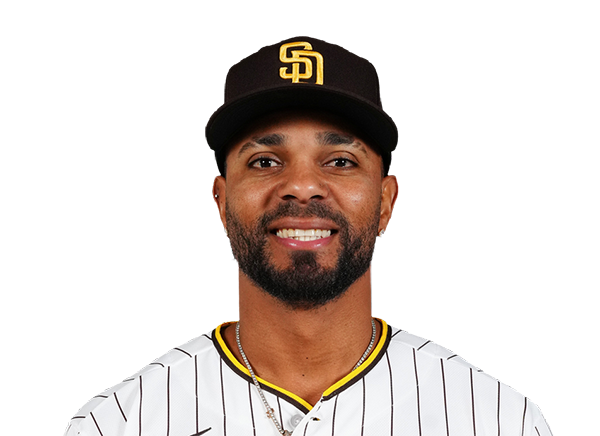 Xander Bogaerts | 2-3 | 3 | 0 | 2 | 0 | 0 | 1 | 0 | 14 | .219 | .321 | .323 |
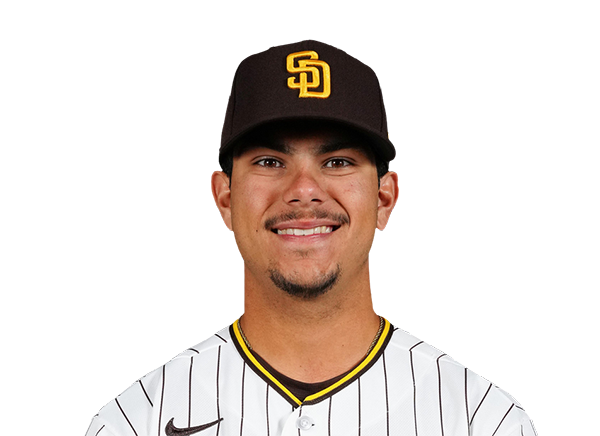 Ethan Salas | 0-4 | 4 | 0 | 0 | 0 | 0 | 0 | 2 | 14 | .000 | .000 | .000 |
 Austin Hays | 1-2 | 2 | 1 | 1 | 0 | 0 | 0 | 1 | 9 | .227 | .256 | .333 |
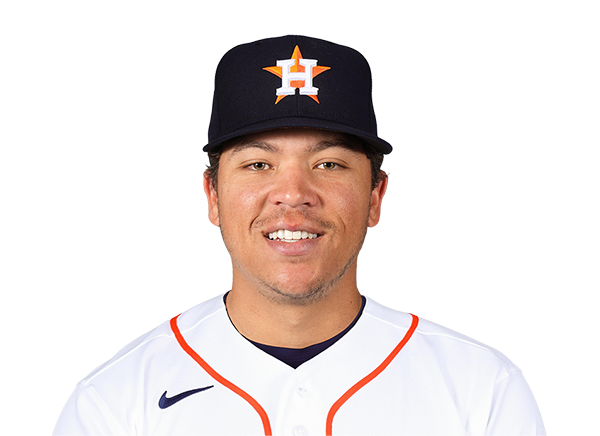 Dustin Harris | 0-2 | 2 | 0 | 0 | 0 | 0 | 0 | 1 | 8 | .290 | .366 | .355 |
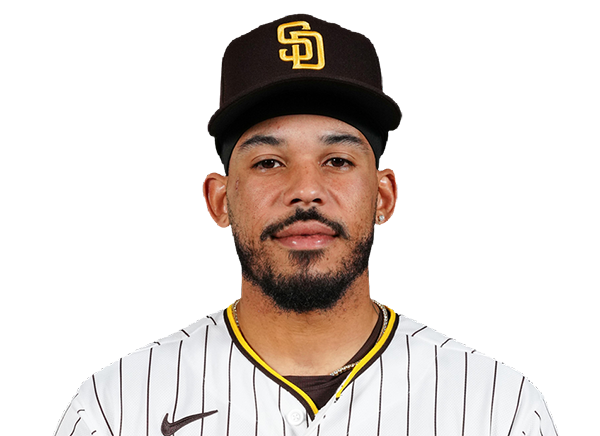 Luis Campusano | 0-4 | 4 | 0 | 0 | 0 | 0 | 0 | 2 | 20 | .277 | .381 | .445 |
 Jake Cronenworth | 0-3 | 3 | 0 | 0 | 0 | 0 | 1 | 1 | 16 | .215 | .301 | .291 |
Cincinnati Reds
| Player | H-AB | AB | R | H | RBI | HR | BB | K | #P | AVG | OBP | SLG |
|---|---|---|---|---|---|---|---|---|---|---|---|---|
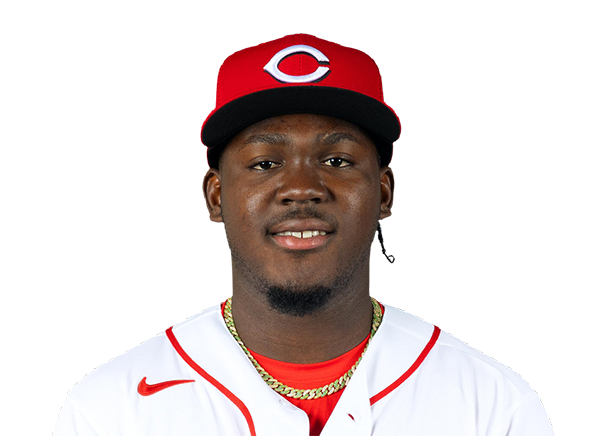 Hector Rodriguez | 1-5 | 5 | 1 | 1 | 1 | 1 | 0 | 1 | 19 | .240 | .305 | .480 |
 TJ Friedl | 0-0 | 0 | 0 | 0 | 0 | 0 | 0 | 0 | 0 | .165 | .248 | .251 |
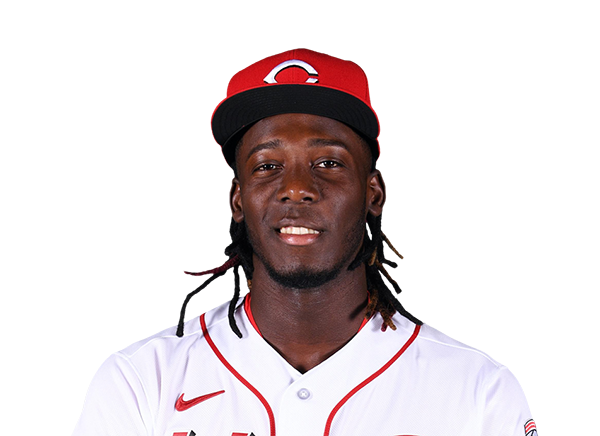 Elly De La Cruz | 2-4 | 4 | 1 | 2 | 0 | 0 | 0 | 1 | 20 | .273 | .353 | .476 |
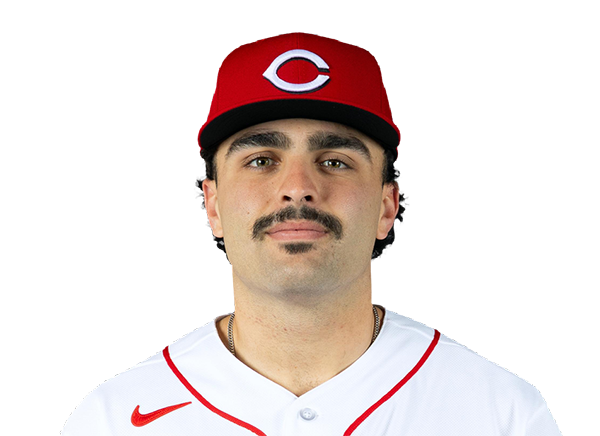 Sal Stewart | 0-4 | 4 | 0 | 0 | 0 | 0 | 0 | 0 | 23 | .266 | .336 | .485 |
 JJ Bleday | 3-4 | 4 | 2 | 3 | 2 | 1 | 0 | 0 | 7 | .222 | .333 | .437 |
 Tyler Stephenson | 0-3 | 3 | 1 | 0 | 0 | 0 | 1 | 1 | 16 | .249 | .329 | .423 |
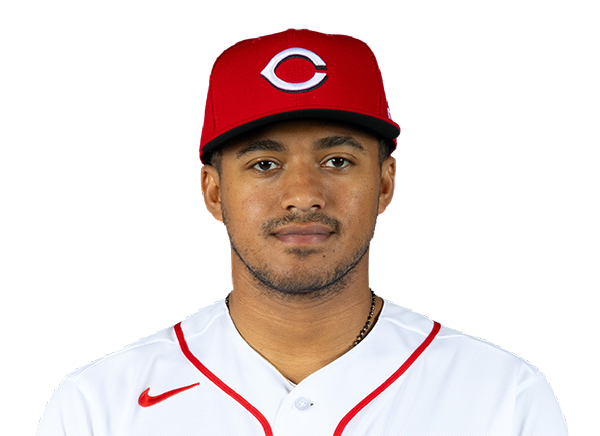 Dane Myers | 3-4 | 4 | 1 | 3 | 0 | 0 | 0 | 1 | 18 | .262 | .352 | .373 |
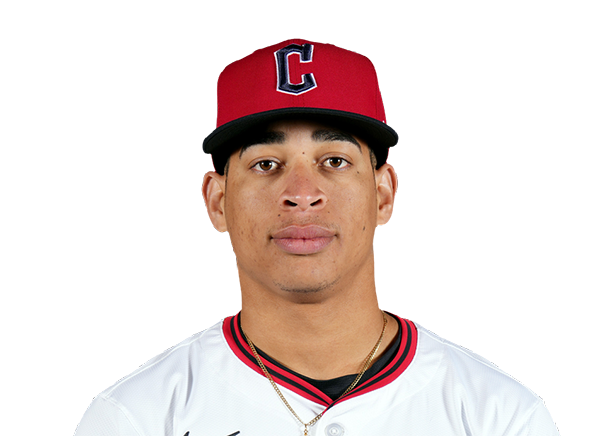 Juan Brito | 1-3 | 3 | 1 | 1 | 3 | 1 | 1 | 1 | 21 | .175 | .250 | .298 |
 Matt McLain | 0-3 | 3 | 0 | 0 | 1 | 0 | 0 | 2 | 15 | .188 | .285 | .336 |
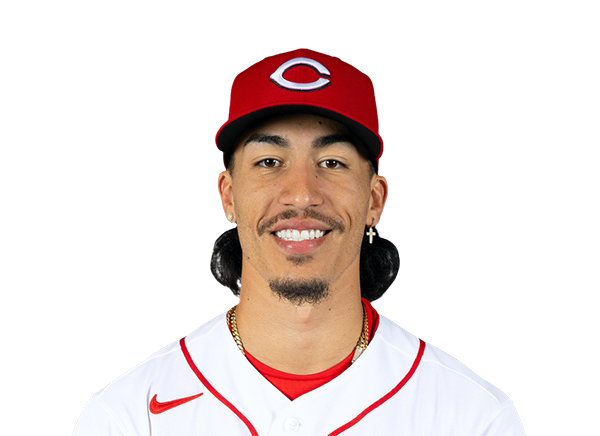 Edwin Arroyo | 0-4 | 4 | 0 | 0 | 0 | 0 | 0 | 0 | 22 | .226 | .269 | .267 |
San Diego Padres
| Player | IP | H | R | ER | BB | K | HR | PC-ST | ERA | PC |
|---|---|---|---|---|---|---|---|---|---|---|
 Casey Mize | 4.0 | 5 | 4 | 4 | 1 | 4 | 2 | 85-55 | 3.64 | 85 |
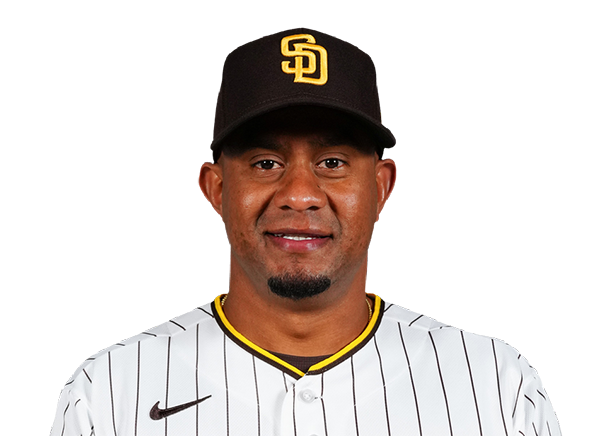 Wandy Peralta | 1.1 | 1 | 1 | 1 | 0 | 1 | 0 | 20-12 | 3.48 | 20 |
 David Morgan | 0.1 | 1 | 0 | 0 | 1 | 0 | 0 | 16-8 | 4.94 | 16 |
 Kyle Hart | 0.2 | 1 | 1 | 1 | 0 | 0 | 0 | 17-10 | 3.88 | 17 |
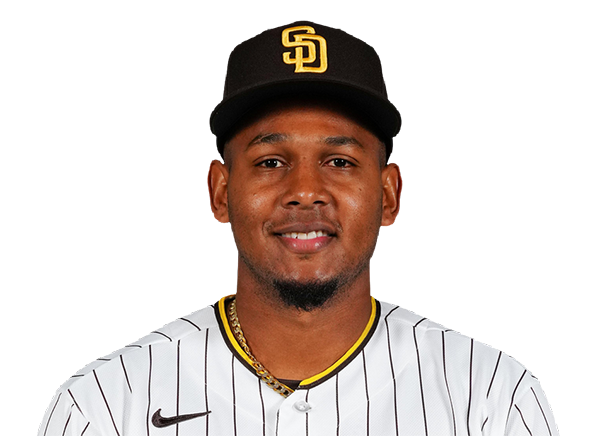 Jhony Brito | 1.2 | 2 | 1 | 1 | 0 | 2 | 1 | 23-17 | 3.86 | 23 |
Cincinnati Reds
| Player | IP | H | R | ER | BB | K | HR | PC-ST | ERA | PC |
|---|---|---|---|---|---|---|---|---|---|---|
 Brandon Williamson | 5.1 | 7 | 3 | 3 | 2 | 5 | 1 | 87-58 | 5.94 | 87 |
 Pierce Johnson | 0.2 | 0 | 0 | 0 | 0 | 1 | 0 | 9-7 | 4.46 | 9 |
 Tejay Antone | 1.0 | 0 | 0 | 0 | 1 | 2 | 0 | 20-10 | 3.74 | 20 |
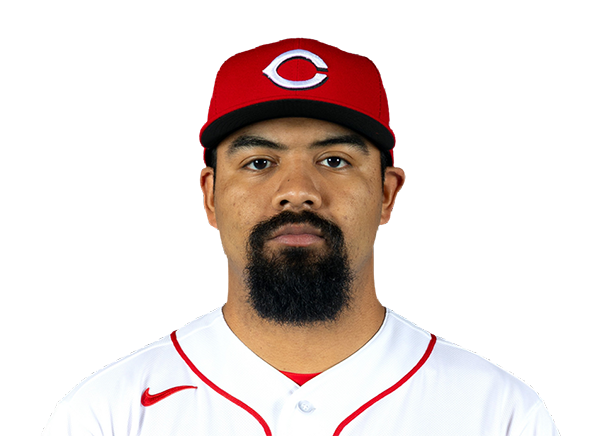 Tony Santillan | 1.0 | 0 | 0 | 0 | 1 | 1 | 0 | 16-9 | 6.56 | 16 |
 Emilio Pagan | 1.0 | 0 | 0 | 0 | 0 | 1 | 0 | 13-9 | 4.08 | 13 |
H2H / Season Series
CIN7–3
SD
CIN4–3
SD
CIN0–5
SD
SD5–4
CIN
SD3–5
CIN
SD6–2
CIN
SD14–3
CIN
CIN11–10
SD
Last 5 Games
| Date | Opponent | Result |
|---|---|---|
| Sep 2 | @ CIN | L3–7 |
| Sep 1 | @ CIN | L3–4 |
| Aug 31 | @ CIN | W5–0 |
| Aug 30 |  @ TB | L4–5 |
| Aug 29 | @ TB | L6–7 |
| Date | Opponent | Result |
|---|---|---|
| Sep 2 | vs SD | W7–3 |
| Sep 1 | vs SD | W4–3 |
| Aug 31 | vs SD | L0–5 |
| Aug 30 |  @ CHC | W7–5 |
| Aug 29 | @ CHC | L5–17 |
Standings
American League
| Team | W | L | PCT | GB | DIFF | STRK |
|---|---|---|---|---|---|---|
| 1Rays | 83 | 56 | .597 | - | +51 | L1 |
2 White Sox | 73 | 65 | .529 | 9.5 | +45 | W1 |
3 Astros | 70 | 69 | .504 | 13 | -44 | L1 |
4 Yankees | 79 | 60 | .568 | 4 | +112 | W1 |
5 Red Sox | 75 | 65 | .536 | 8.5 | +77 | L2 |
6 Guardians | 70 | 69 | .504 | 13 | -8 | L1 |
7 Rangers | 69 | 71 | .493 | 14.5 | -48 | L1 |
8 Blue Jays | 69 | 71 | .493 | 14.5 | -44 | W1 |
9 Orioles | 69 | 71 | .493 | 14.5 | -20 | L2 |
10 Twins | 67 | 72 | .482 | 16 | -33 | W3 |
11 Mariners | 66 | 74 | .471 | 17.5 | -65 | W2 |
12 Tigers | 63 | 75 | .457 | 19.5 | +42 | L3 |
13 Royals | 62 | 77 | .446 | 21 | -86 | L2 |
14 Athletics | 54 | 86 | .386 | 29.5 | -194 | W1 |
15 Angels | 53 | 86 | .381 | 30 | -77 | L1 |
National League
| Team | W | L | PCT | GB | DIFF | STRK |
|---|---|---|---|---|---|---|
1 Brewers | 86 | 53 | .619 | - | +168 | W1 |
2 Dodgers | 82 | 56 | .594 | 3.5 | +148 | L1 |
3 Braves | 83 | 57 | .593 | 3.5 | +118 | W1 |
4 Phillies | 79 | 61 | .564 | 7.5 | +36 | L1 |
| 5Cubs | 78 | 61 | .561 | 8 | +136 | L1 |
6 Diamondbacks | 74 | 67 | .525 | 13 | -1 | W1 |
| 7Padres | 73 | 67 | .521 | 13.5 | +10 | L2 |
8 Marlins | 70 | 69 | .504 | 16 | +15 | W1 |
9 Cardinals | 69 | 70 | .496 | 17 | -10 | W1 |
10 Pirates | 68 | 72 | .486 | 18.5 | +26 | L1 |
| 11Reds | 67 | 73 | .479 | 19.5 | -108 | W2 |
12 Nationals | 67 | 75 | .472 | 20.5 | +14 | L1 |
13 Mets | 63 | 77 | .450 | 23.5 | -50 | W1 |
14 Giants | 58 | 82 | .414 | 28.5 | -70 | W1 |
15 Rockies | 54 | 86 | .386 | 32.5 | -140 | W2 |
SD
VS
CIN
Pitchers
Casey Mize
Catchers
Ethan Salas
Infielders
Fernando Tatis Jr.
Ty France
Xander Bogaerts
Jake Cronenworth
Outfielders
Samad Taylor
Jackson Merrill
Austin Hays
Designated Hitters
Luis Campusano
Pitchers
Brandon Williamson
Catchers
Tyler Stephenson
Infielders
Sal Stewart
Juan Brito
Matt McLain
Edwin Arroyo
Outfielders
Hector Rodriguez
JJ Bleday
Dane Myers
Designated Hitters
Elly De La Cruz
Padres
VS
Reds
Batting
140
Team Games Played
140
4617
At Bats
4657
1096
Hits
1064
572
Runs Batted In
557
153
Home Runs
186
138
Stolen Bases
94
.237
Batting Average
.228
594
Runs
581
202
Doubles
197
14
Triples
12
1785
Total Bases
1843
485
Walks
499
1139
Strikeouts
1329
.315
On Base Percentage
.307
.387
Slugging Percentage
.396
.701
OBP Pct + SLG Pct
.703
140
Games Played
140
140
Games Started
140
53
Hit By Pitch
47
0.0
Wins Above Replacement
0.0
0.0
Offensive Wins Above Replacement
0.0
39
Caught Stealing
31
1
Is Qualified
1
572.9
Runs Created
582.8
4.1
Runs Created Per 27 Outs
4.2
.093
Walks Per Plate Appearance
.095
0.43
Walk To Strikeout Ratio
0.38
.149
Isolated Power
.167
.276
Secondary Average
.288
3.92
Pitches Per Plate Appearance
3.94
369
Extra Base Hits
395
5217
Plate Appearances
5256
30.2
At Bats Per Home Run
25.0
21
Sacrifice Hit
15
38
Sacrifice Flies
35
Pitching
140
Team Games Played
140
32
Quality Starts
45
73
Wins
67
67
Losses
73
40
Saves
37
86
Holds
77
1125
Hits
1201
542
Earned runs
641
155
Home Runs
180
475
Walks
567
1131
Strikeouts
1129
8.2
Strikeouts Per 9 Innings
8.2
147.0
Pitches Per Start
152.9
1.29
Walks Plus Hits Per Inning Pitched
1.42
3.94
Earned Run Average
4.64
67
Losses
73
1238.1
Innings pitched
1242.0
.521
Win Percentage
.479
58
Save Opportunities
58
.242
Opponent Batting Average
.252
.318
Opponent's On-base pct.
.338
.391
Opponent's Slugging pct.
.422
.709
Opponent's OPB Pct + SLG Pct
.759
4654
At Bats
4764
198
Doubles
216
16
Triples
26
58
Batters Hit
72
92
Stolen Bases
130
140
Games Played
140
0
Complete Games
0
11
Shutouts
8
38
Wild Pitches
40
563
Runs Batted In
666
4
Balks
2
1238.1
Innings pitched
1242.0
8.2
Strikeouts Per 9 Innings
8.2
44
Caught Stealing
29
140
Games Started
140
0.0
Wins Above Replacement
0.0
1
Is Qualified
1
584
Runs
689
542
Earned Runs
641
1820
Total Bases
2009
Fielding
140
Team Games Played
140
1238
Full Innings
1242
5010
Total Chances
4929
3715
Putouts
3726
1236
Assists
1125
59
Errors
78
202
Double Plays
197
0.988
Fielding Percentage
0.984
36.0
Range Factor
35.2
0.0
Zone Rating
0.0
140
Games Played
140
0
Games Started
0
0.0
Defensive Wins Above Replacement
0.0
1
Qualified
1