

Padres vs Rockies Live Score (16 Sep, 2026)
Game Information
Stage
STD
Season
2026
First Pitch
Tue, Sep 15, 8:40 pm
Venue
Coors Field
Location
Denver, Colorado
Venue Type
Outdoor
Broadcast
MLB.TV
Attendance
15,115
Live Situation
0Balls
0Strikes
0Outs
—Pitcher
—At Bat
Pitch Sequence
1
BALL IN PLAY
Slider
89 MPH
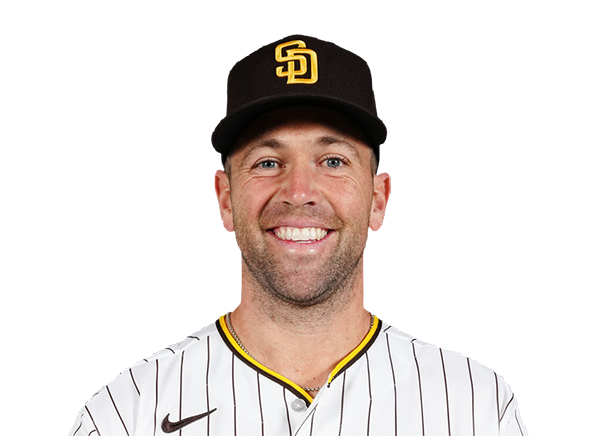
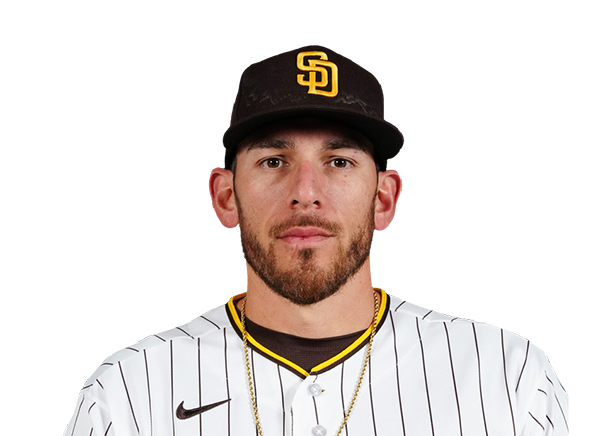
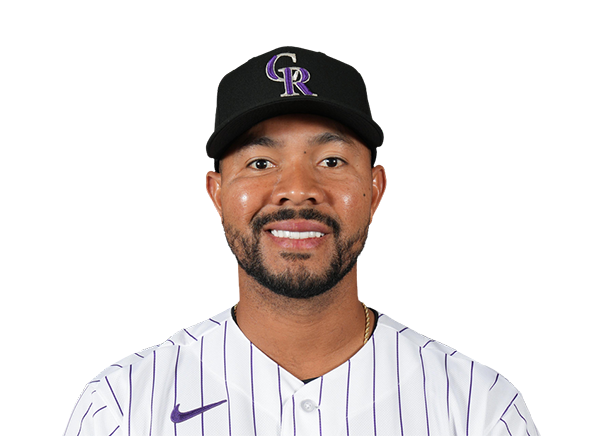
Injury Report






Team Stats
 SD
COL


3
Runs
9
11
Hits
16
0
Errors
0
3
Home Runs
2
1
Walks
1
6
Strikeouts
3
Player Box Score
San Diego Padres
| Player | H-AB | AB | R | H | RBI | HR | BB | K | #P | AVG | OBP | SLG |
|---|---|---|---|---|---|---|---|---|---|---|---|---|
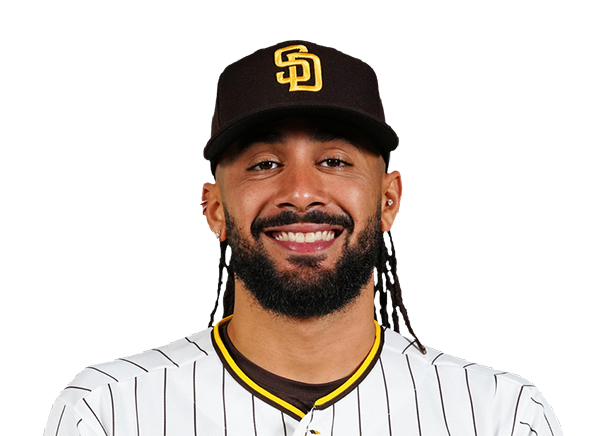 Fernando Tatis Jr. | 1-5 | 5 | 1 | 1 | 1 | 1 | 0 | 1 | 15 | .288 | .356 | .465 |
 Austin Hays | 2-3 | 3 | 1 | 2 | 1 | 1 | 0 | 0 | 6 | .270 | .290 | .404 |
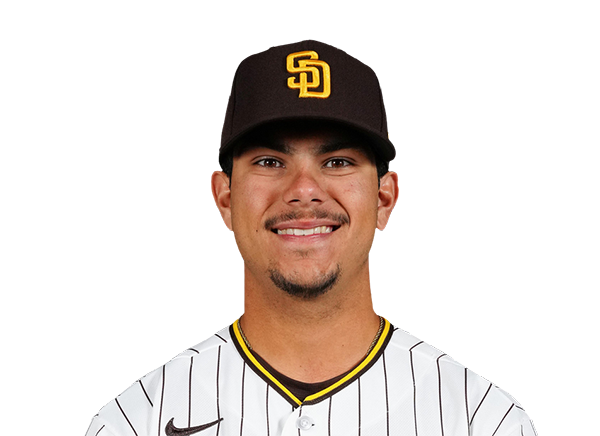 Ethan Salas | 0-1 | 1 | 0 | 0 | 0 | 0 | 0 | 1 | 4 | .059 | .059 | .176 |
 Manny Machado | 1-3 | 3 | 0 | 1 | 0 | 0 | 1 | 0 | 16 | .222 | .312 | .416 |
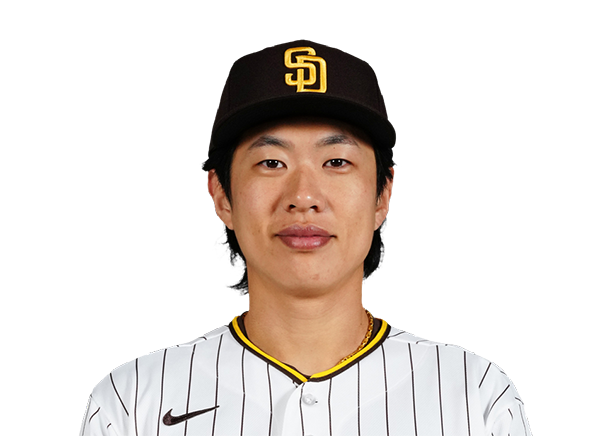 Sung-Mun Song | 0-0 | 0 | 0 | 0 | 0 | 0 | 0 | 0 | 0 | .189 | .291 | .246 |
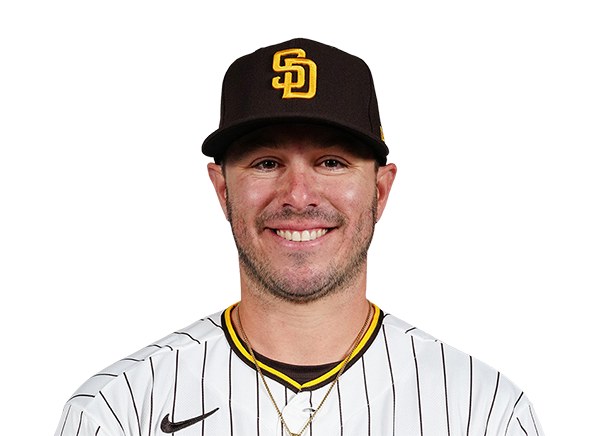 Ty France | 0-4 | 4 | 0 | 0 | 0 | 0 | 0 | 2 | 15 | .295 | .362 | .509 |
 Jackson Merrill | 2-4 | 4 | 0 | 2 | 0 | 0 | 0 | 0 | 8 | .253 | .302 | .441 |
 Jase Bowen | 0-0 | 0 | 0 | 0 | 0 | 0 | 0 | 0 | 0 | .156 | .200 | .267 |
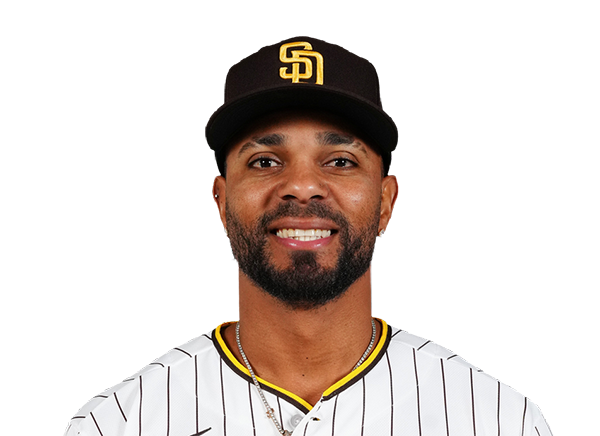 Xander Bogaerts | 1-4 | 4 | 0 | 1 | 0 | 0 | 0 | 2 | 16 | .223 | .322 | .323 |
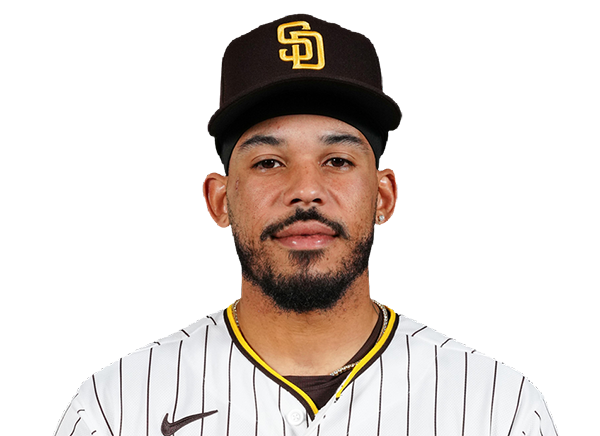 Luis Campusano | 2-4 | 4 | 1 | 2 | 1 | 1 | 0 | 0 | 9 | .273 | .368 | .455 |
 Samad Taylor | 0-2 | 2 | 0 | 0 | 0 | 0 | 0 | 0 | 4 | .306 | .382 | .380 |
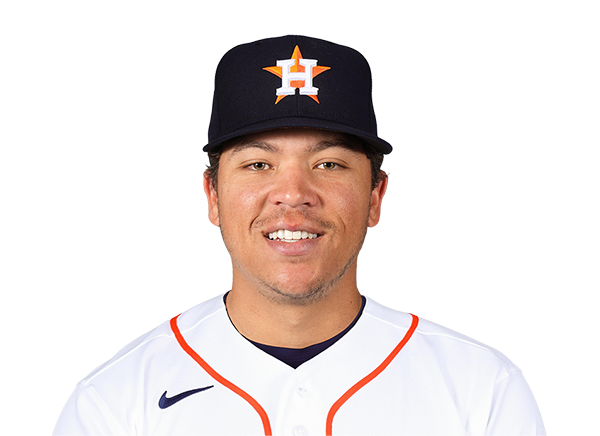 Dustin Harris | 1-2 | 2 | 0 | 1 | 0 | 0 | 0 | 0 | 7 | .284 | .350 | .364 |
 Jake Cronenworth | 1-4 | 4 | 0 | 1 | 0 | 0 | 0 | 0 | 11 | .214 | .297 | .291 |
Colorado Rockies
| Player | H-AB | AB | R | H | RBI | HR | BB | K | #P | AVG | OBP | SLG |
|---|---|---|---|---|---|---|---|---|---|---|---|---|
 Jake McCarthy | 2-5 | 5 | 1 | 2 | 0 | 0 | 0 | 0 | 14 | .297 | .341 | .485 |
 Adael Amador | 1-5 | 5 | 1 | 1 | 0 | 0 | 0 | 0 | 24 | .309 | .387 | .582 |
 Cole Carrigg | 4-5 | 5 | 2 | 4 | 5 | 2 | 0 | 1 | 25 | .270 | .338 | .474 |
 TJ Rumfield | 2-4 | 4 | 0 | 2 | 0 | 0 | 0 | 0 | 23 | .300 | .392 | .455 |
 Kyle Karros | 1-4 | 4 | 1 | 1 | 0 | 0 | 1 | 0 | 22 | .259 | .353 | .420 |
 Mickey Moniak | 1-4 | 4 | 1 | 1 | 0 | 0 | 0 | 1 | 10 | .241 | .282 | .486 |
 Troy Johnston | 3-3 | 3 | 1 | 3 | 2 | 0 | 0 | 0 | 11 | .285 | .355 | .404 |
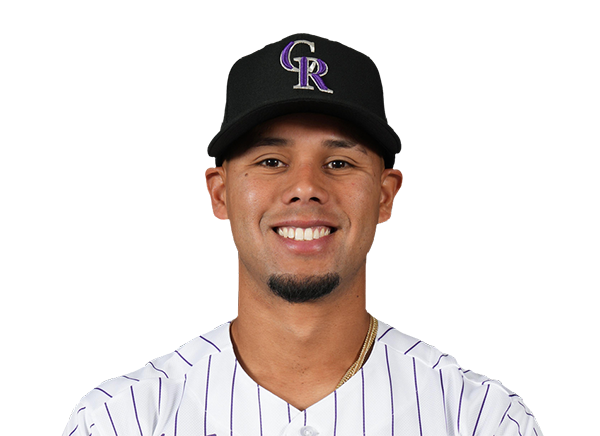 Ezequiel Tovar | 0-0 | 0 | 1 | 0 | 0 | 0 | 0 | 0 | 0 | .214 | .262 | .339 |
 Brett Sullivan | 1-4 | 4 | 1 | 1 | 1 | 0 | 0 | 0 | 14 | .230 | .276 | .407 |
 Zac Veen | 1-4 | 4 | 0 | 1 | 1 | 0 | 0 | 1 | 17 | .250 | .339 | .442 |
San Diego Padres
| Player | IP | H | R | ER | BB | K | HR | PC-ST | ERA | PC |
|---|---|---|---|---|---|---|---|---|---|---|
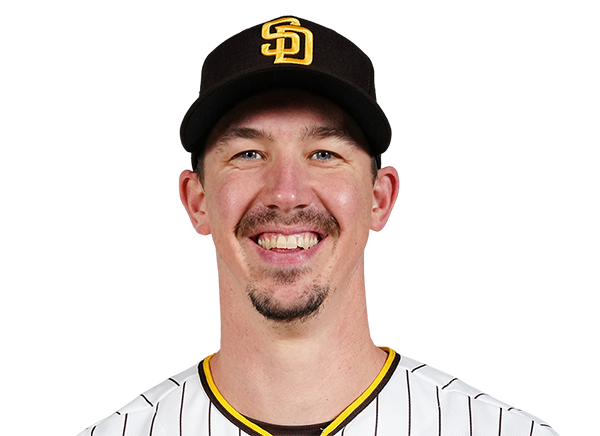 Walker Buehler | 4.2 | 7 | 2 | 2 | 1 | 1 | 1 | 92-56 | 4.58 | 92 |
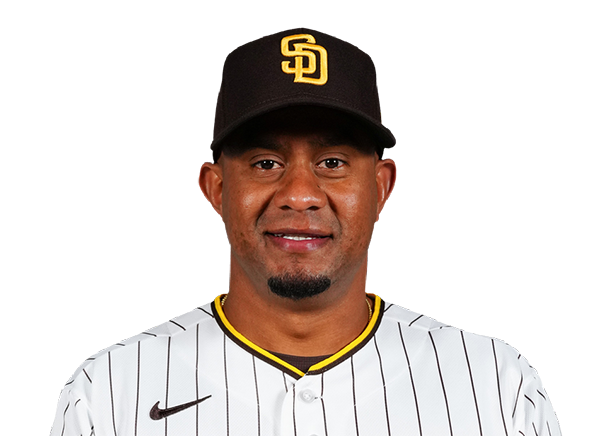 Wandy Peralta | 0.2 | 4 | 4 | 4 | 0 | 1 | 0 | 24-14 | 3.75 | 24 |
 Randy Vasquez | 2.2 | 5 | 3 | 3 | 0 | 1 | 1 | 44-35 | 4.07 | 44 |
Colorado Rockies
| Player | IP | H | R | ER | BB | K | HR | PC-ST | ERA | PC |
|---|---|---|---|---|---|---|---|---|---|---|
 Kyle Freeland | 4.0 | 8 | 3 | 3 | 0 | 1 | 3 | 50-36 | 6.38 | 50 |
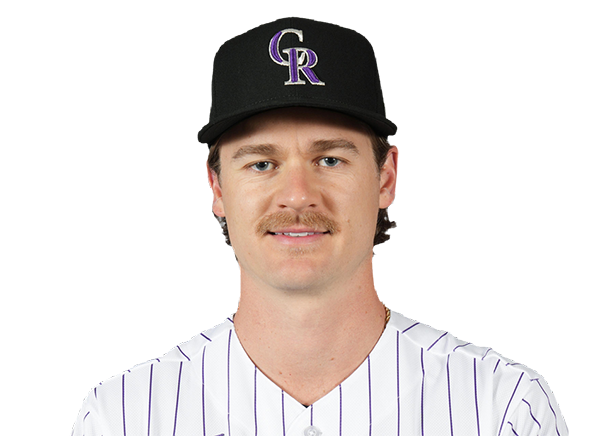 Ryan Feltner | 5.0 | 3 | 0 | 0 | 1 | 5 | 0 | 61-43 | 5.63 | 61 |
H2H / Season Series
COL9–3
SD
COL7–8
SD
SD3–1
COL
SD8–7
COL
COL8–10
SD
COL8–3
SD
COL0–1
SD
SD7–2
COL
SD9–5
COL
SD5–2
COL
Last 5 Games
| Date | Opponent | Result |
|---|---|---|
| Sep 15 | @ COL | L3–9 |
| Sep 14 | @ COL | W8–7 |
| Sep 13 |  @ SF | W6–4 |
| Sep 12 | @ SF | W7–6 |
| Sep 11 | @ SF | W7–5 |
| Date | Opponent | Result |
|---|---|---|
| Sep 15 | vs SD | W9–3 |
| Sep 14 | vs SD | L7–8 |
| Sep 13 |  @ DET | L1–8 |
| Sep 12 | @ DET | L7–11 |
| Sep 11 | @ DET | L2–6 |
Standings
American League
| Team | W | L | PCT | GB | DIFF | STRK |
|---|---|---|---|---|---|---|
1 Rays | 91 | 59 | .607 | - | +70 | W4 |
2 White Sox | 77 | 74 | .510 | 14.5 | +37 | L1 |
3 Astros | 76 | 75 | .503 | 15.5 | -51 | W1 |
4 Yankees | 88 | 63 | .583 | 3.5 | +137 | W3 |
5 Red Sox | 82 | 69 | .543 | 9.5 | +86 | L1 |
6 Guardians | 77 | 75 | .507 | 15 | -10 | W1 |
7 Rangers | 75 | 76 | .497 | 16.5 | -42 | W3 |
8 Blue Jays | 75 | 77 | .493 | 17 | -41 | L2 |
9 Orioles | 74 | 78 | .487 | 18 | -32 | W2 |
| 10Tigers | 72 | 79 | .477 | 19.5 | +80 | W6 |
11 Twins | 70 | 81 | .464 | 21.5 | -74 | L3 |
12 Mariners | 70 | 82 | .461 | 22 | -61 | L3 |
13 Royals | 66 | 85 | .437 | 25.5 | -96 | L3 |
14 Athletics | 61 | 90 | .404 | 30.5 | -204 | L1 |
15 Angels | 58 | 93 | .384 | 33.5 | -73 | W2 |
National League
| Team | W | L | PCT | GB | DIFF | STRK |
|---|---|---|---|---|---|---|
1 Brewers | 94 | 57 | .623 | - | +199 | W1 |
2 Dodgers | 92 | 59 | .609 | 2 | +177 | W2 |
3 Braves | 89 | 63 | .586 | 5.5 | +115 | W1 |
4 Cubs | 84 | 68 | .553 | 10.5 | +139 | L1 |
5 Phillies | 83 | 68 | .550 | 11 | +28 | L1 |
| 6Padres | 82 | 69 | .543 | 12 | +17 | L1 |
7 Diamondbacks | 80 | 72 | .526 | 14.5 | +1 | L1 |
8 Pirates | 75 | 76 | .497 | 19 | +22 | L1 |
9 Marlins | 75 | 77 | .493 | 19.5 | +7 | W1 |
10 Cardinals | 75 | 77 | .493 | 19.5 | -13 | L1 |
11 Nationals | 71 | 81 | .467 | 23.5 | +6 | W4 |
12 Reds | 70 | 81 | .464 | 24 | -152 | L2 |
13 Mets | 69 | 82 | .457 | 25 | -37 | L3 |
| 14Giants | 63 | 89 | .414 | 31.5 | -71 | W1 |
| 15Rockies | 56 | 95 | .371 | 38 | -164 | W1 |
SD
VS
COL
Pitchers
Walker Buehler
Catchers
Luis Campusano
Infielders
Manny Machado
Ty France
Xander Bogaerts
Jake Cronenworth
Outfielders
Fernando Tatis Jr.
Jackson Merrill
Samad Taylor
Designated Hitters
Austin Hays
Pitchers
Kyle Freeland
Catchers
Brett Sullivan
Infielders
Adael Amador
Cole Carrigg
TJ Rumfield
Kyle Karros
Outfielders
Jake McCarthy
Troy Johnston
Zac Veen
Designated Hitters
Mickey Moniak
Padres
VS
Rockies
Batting
151
Team Games Played
151
4991
At Bats
5143
1200
Hits
1309
626
Runs Batted In
682
169
Home Runs
168
151
Stolen Bases
100
.240
Batting Average
.255
650
Runs
712
218
Doubles
271
18
Triples
35
1961
Total Bases
2154
520
Walks
475
1214
Strikeouts
1312
.316
On Base Percentage
.324
.393
Slugging Percentage
.419
.709
OBP Pct + SLG Pct
.743
151
Games Played
151
151
Games Started
151
54
Hit By Pitch
77
0.0
Wins Above Replacement
0.0
0.0
Offensive Wins Above Replacement
0.0
41
Caught Stealing
38
1
Is Qualified
1
634.0
Runs Created
709.8
4.3
Runs Created Per 27 Outs
4.8
.092
Walks Per Plate Appearance
.082
0.43
Walk To Strikeout Ratio
0.36
.152
Isolated Power
.164
.279
Secondary Average
.269
3.91
Pitches Per Plate Appearance
3.75
405
Extra Base Hits
474
5634
Plate Appearances
5765
29.5
At Bats Per Home Run
30.6
24
Sacrifice Hit
21
42
Sacrifice Flies
48
Pitching
151
Team Games Played
151
34
Quality Starts
23
82
Wins
56
69
Losses
95
47
Saves
32
99
Holds
60
1215
Hits
1521
589
Earned runs
820
169
Home Runs
208
508
Walks
506
1222
Strikeouts
1033
8.2
Strikeouts Per 9 Innings
7.0
146.8
Pitches Per Start
149.5
1.29
Walks Plus Hits Per Inning Pitched
1.53
3.96
Earned Run Average
5.57
69
Losses
95
1337.1
Innings pitched
1324.2
.543
Win Percentage
.371
65
Save Opportunities
56
.242
Opponent Batting Average
.288
.317
Opponent's On-base pct.
.352
.393
Opponent's Slugging pct.
.488
.710
Opponent's OPB Pct + SLG Pct
.840
5028
At Bats
5279
217
Doubles
335
19
Triples
48
61
Batters Hit
56
97
Stolen Bases
125
151
Games Played
151
0
Complete Games
1
11
Shutouts
1
39
Wild Pitches
44
611
Runs Batted In
839
4
Balks
5
1337.1
Innings pitched
1324.2
8.2
Strikeouts Per 9 Innings
7.0
49
Caught Stealing
26
151
Games Started
151
0.0
Wins Above Replacement
0.0
1
Is Qualified
1
633
Runs
876
589
Earned Runs
820
1977
Total Bases
2576
Fielding
151
Team Games Played
151
1337
Full Innings
1325
5418
Total Chances
5329
4012
Putouts
3974
1343
Assists
1261
63
Errors
94
218
Double Plays
271
0.988
Fielding Percentage
0.982
36.0
Range Factor
35.6
0.0
Zone Rating
0.0
151
Games Played
151
0
Games Started
0
0.0
Defensive Wins Above Replacement
0.0
1
Qualified
1