

Phillies vs Braves Live Score (11 Sep, 2026)
Game Information
Stage
STD
Season
2026
First Pitch
Fri, Sep 11, 7:15 pm
Venue
Truist Park
Location
Atlanta, Georgia
Venue Type
Outdoor
Broadcast
MLB.TV
Attendance
40,161
Live Situation
2Balls
2Strikes
0Outs
—Pitcher
—At Bat
Pitch Sequence
1
BALL
Cutter
87 MPH
2
BALL
Sweeper
80 MPH
3
STRIKE SWINGING
Cutter
85 MPH
4
STRIKE FOUL
Cutter
86 MPH
5
BALL IN PLAY
Sweeper
81 MPH
Injury Report





Team Stats
 PHI
ATL


5
Runs
6
7
Hits
11
1
Errors
0
0
Home Runs
2
4
Walks
3
9
Strikeouts
6
Player Box Score
Philadelphia Phillies
| Player | H-AB | AB | R | H | RBI | HR | BB | K | #P | AVG | OBP | SLG |
|---|---|---|---|---|---|---|---|---|---|---|---|---|
 Kyle Schwarber | 0-5 | 5 | 0 | 0 | 0 | 0 | 0 | 3 | 23 | .238 | .352 | .522 |
 Garrett Stubbs | 0-0 | 0 | 1 | 0 | 0 | 0 | 0 | 0 | 0 | .167 | .220 | .167 |
 Trea Turner | 0-5 | 5 | 0 | 0 | 0 | 0 | 0 | 1 | 14 | .239 | .290 | .385 |
 Bryce Harper | 2-5 | 5 | 0 | 2 | 0 | 0 | 0 | 2 | 19 | .271 | .387 | .493 |
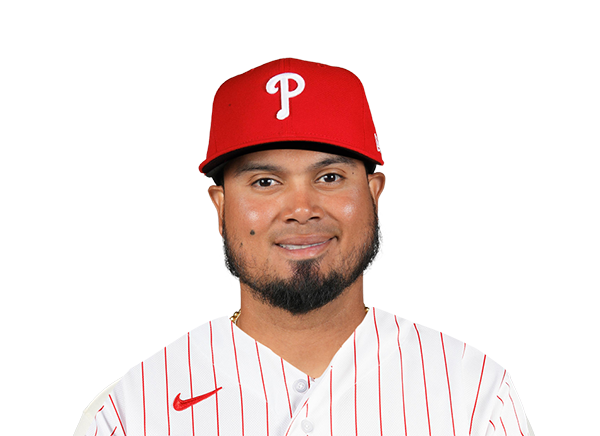 Luis Arraez | 2-5 | 5 | 0 | 2 | 1 | 0 | 0 | 0 | 12 | .318 | .350 | .430 |
 Alec Bohm | 0-4 | 4 | 0 | 0 | 0 | 0 | 1 | 1 | 17 | .244 | .307 | .388 |
 Edmundo Sosa | 1-3 | 3 | 1 | 1 | 0 | 0 | 0 | 0 | 8 | .240 | .279 | .396 |
 Bryson Stott | 0-1 | 1 | 1 | 0 | 0 | 0 | 1 | 1 | 10 | .248 | .325 | .390 |
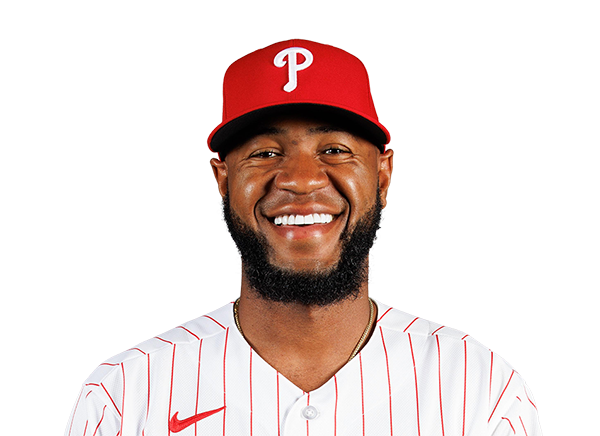 Bryan De La Cruz | 0-2 | 2 | 1 | 0 | 0 | 0 | 1 | 1 | 18 | .328 | .379 | .483 |
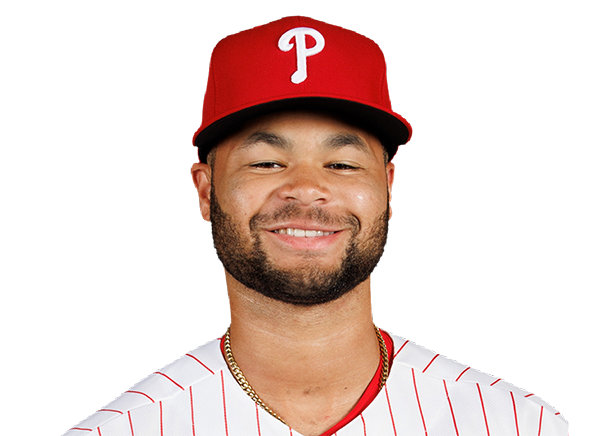 Justin Crawford | 1-2 | 2 | 0 | 1 | 1 | 0 | 0 | 0 | 3 | .265 | .312 | .347 |
 J.T. Realmuto | 0-3 | 3 | 1 | 0 | 0 | 0 | 0 | 0 | 8 | .214 | .289 | .341 |
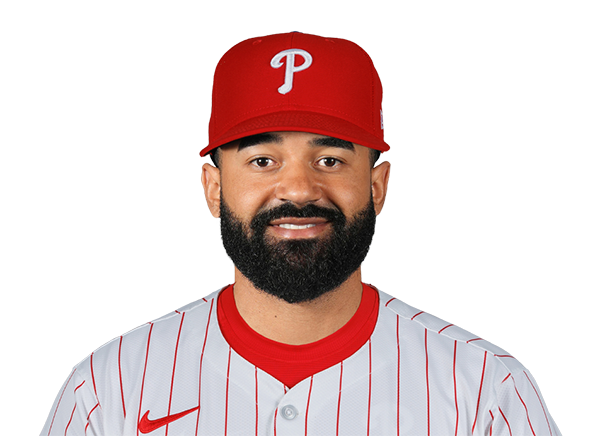 Derek Hill | 1-2 | 2 | 0 | 1 | 3 | 0 | 1 | 0 | 10 | .249 | .300 | .444 |
 Brandon Marsh | 0-1 | 1 | 0 | 0 | 0 | 0 | 0 | 0 | 5 | .266 | .311 | .417 |
Atlanta Braves
| Player | H-AB | AB | R | H | RBI | HR | BB | K | #P | AVG | OBP | SLG |
|---|---|---|---|---|---|---|---|---|---|---|---|---|
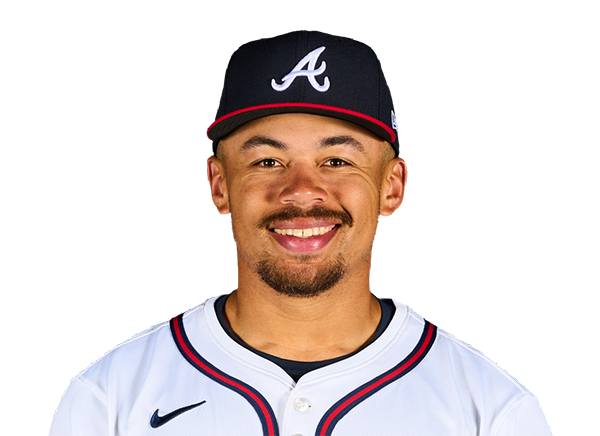 Drake Baldwin | 2-5 | 5 | 0 | 2 | 1 | 0 | 0 | 1 | 29 | .277 | .354 | .451 |
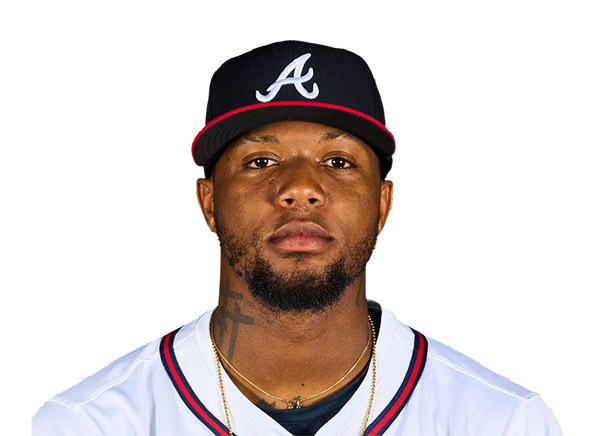 Ronald Acuna Jr. | 1-5 | 5 | 0 | 1 | 0 | 0 | 0 | 1 | 17 | .249 | .343 | .435 |
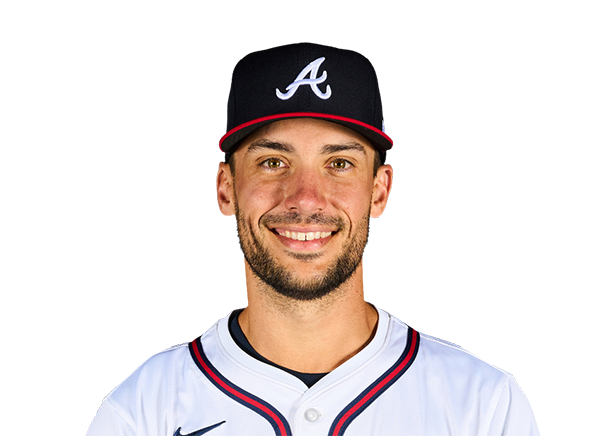 Matt Olson | 1-4 | 4 | 1 | 1 | 1 | 1 | 1 | 0 | 17 | .249 | .323 | .506 |
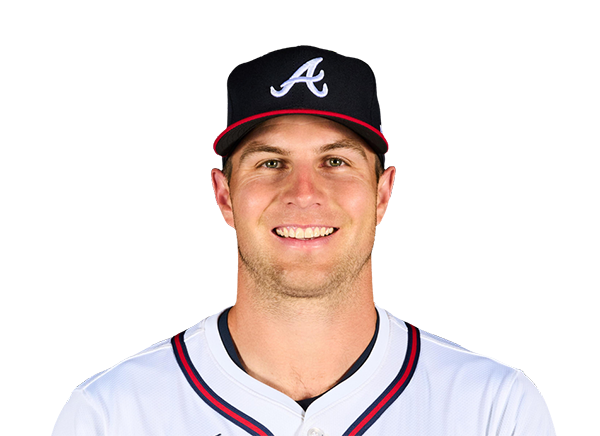 Brewer Hicklen | 0-0 | 0 | 1 | 0 | 0 | 0 | 0 | 0 | 0 | .333 | .467 | .500 |
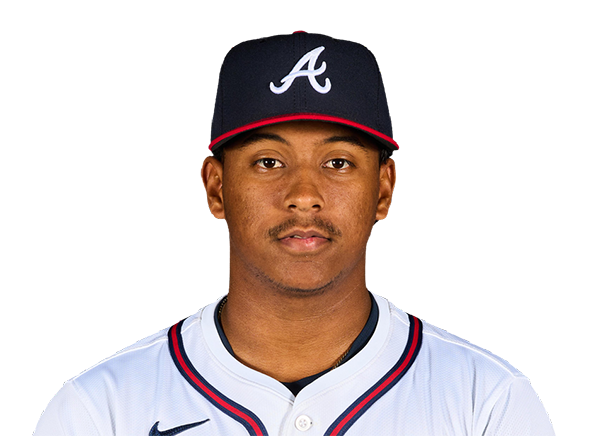 Didier Fuentes | 0-0 | 0 | 0 | 0 | 0 | 0 | 0 | 0 | 0 | .000 | .000 | .000 |
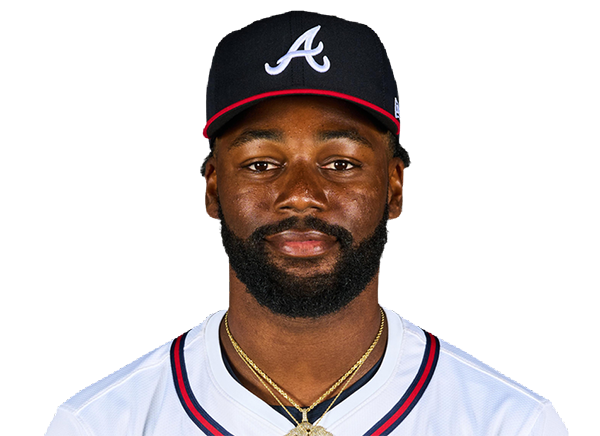 Michael Harris II | 0-5 | 5 | 0 | 0 | 0 | 0 | 0 | 1 | 15 | .283 | .311 | .480 |
 Mauricio Dubon | 1-3 | 3 | 0 | 1 | 1 | 0 | 0 | 0 | 13 | .264 | .308 | .383 |
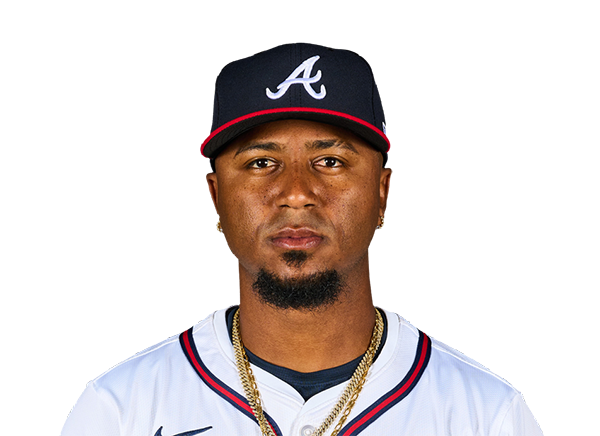 Ozzie Albies | 0-5 | 5 | 1 | 0 | 0 | 0 | 0 | 1 | 19 | .246 | .301 | .408 |
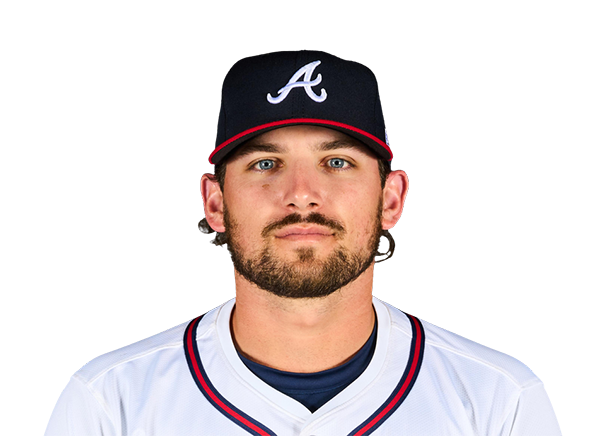 Austin Riley | 1-4 | 4 | 1 | 1 | 1 | 1 | 1 | 1 | 18 | .223 | .294 | .369 |
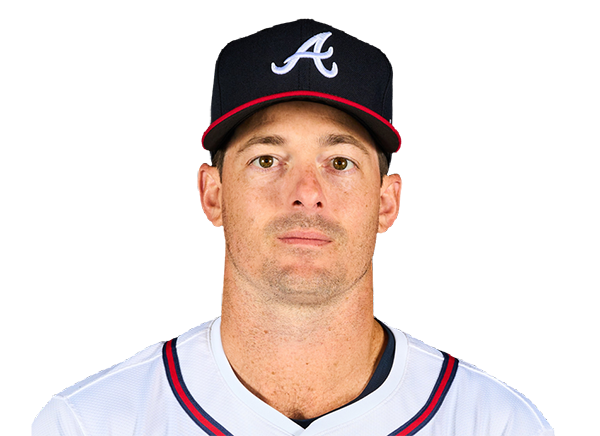 Mike Yastrzemski | 3-3 | 3 | 0 | 3 | 0 | 0 | 1 | 0 | 23 | .231 | .316 | .377 |
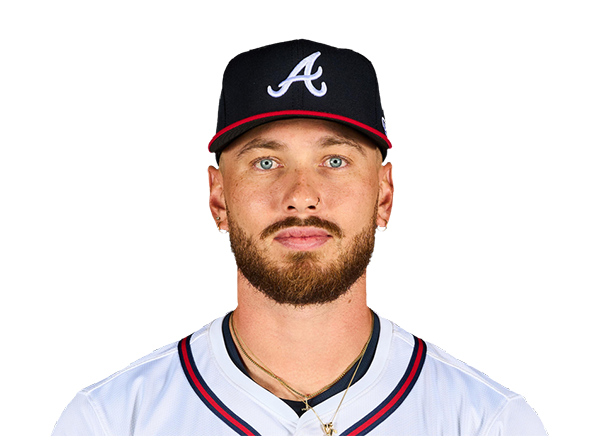 DaShawn Keirsey Jr. | 0-0 | 0 | 1 | 0 | 0 | 0 | 0 | 0 | 0 | .000 | .000 | .000 |
 Raisel Iglesias | 0-0 | 0 | 0 | 0 | 0 | 0 | 0 | 0 | 0 | .000 | .000 | .000 |
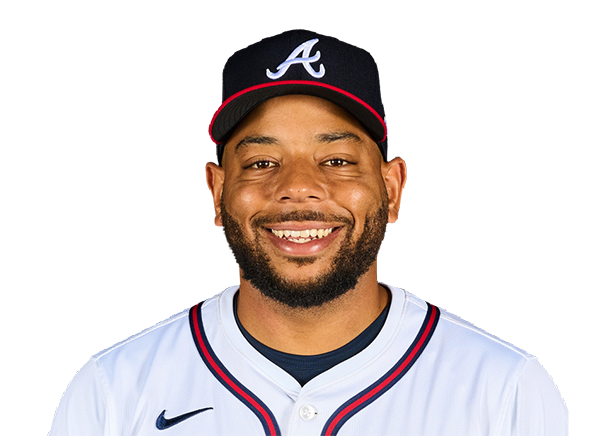 Dominic Smith | 0-1 | 1 | 0 | 0 | 0 | 0 | 0 | 0 | 1 | .255 | .312 | .376 |
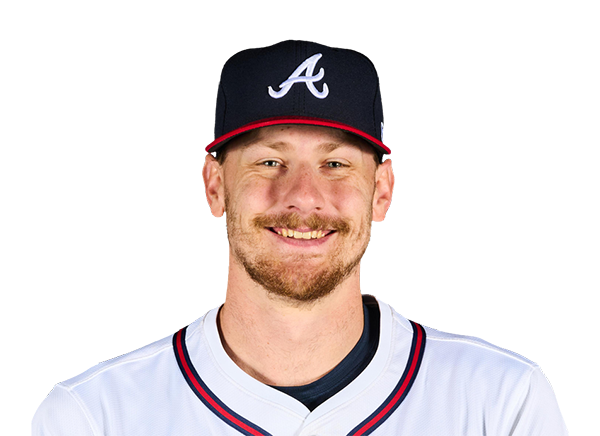 Sean Murphy | 1-4 | 4 | 0 | 1 | 0 | 0 | 0 | 1 | 10 | .205 | .262 | .359 |
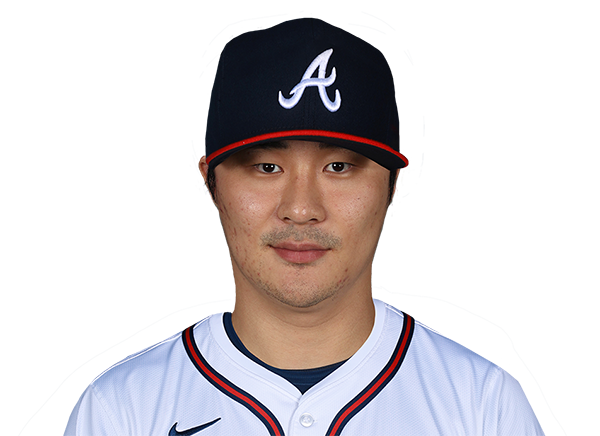 Ha-Seong Kim | 1-1 | 1 | 1 | 1 | 1 | 0 | 0 | 0 | 3 | .135 | .217 | .144 |
Philadelphia Phillies
| Player | IP | H | R | ER | BB | K | HR | PC-ST | ERA | PC |
|---|---|---|---|---|---|---|---|---|---|---|
 Aaron Nola | 6.1 | 6 | 2 | 2 | 3 | 3 | 2 | 101-68 | 4.69 | 101 |
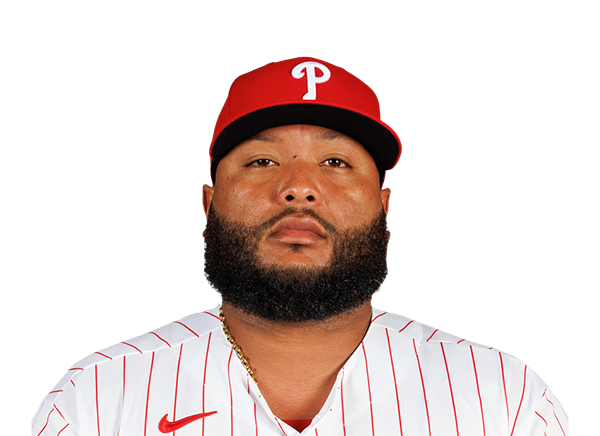 Jose Alvarado | 0.2 | 0 | 0 | 0 | 0 | 2 | 0 | 9-6 | 5.23 | 9 |
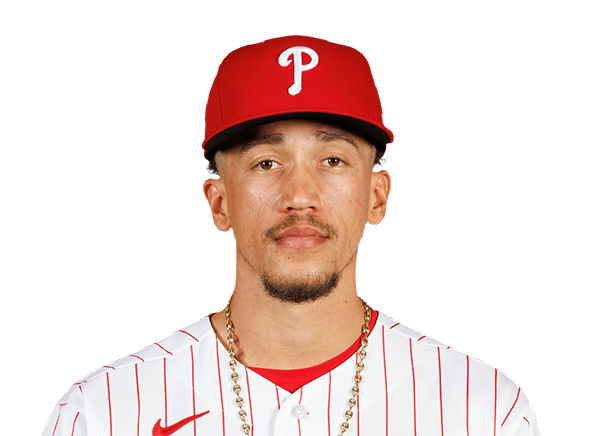 Alex McFarlane | 1.0 | 1 | 0 | 0 | 0 | 0 | 0 | 15-9 | 2.63 | 15 |
 Jonathan Bowlan | 1.0 | 2 | 1 | 1 | 0 | 1 | 0 | 22-15 | 3.27 | 22 |
 Chase Shugart | 1.1 | 0 | 2 | 0 | 0 | 0 | 0 | 9-6 | 4.37 | 9 |
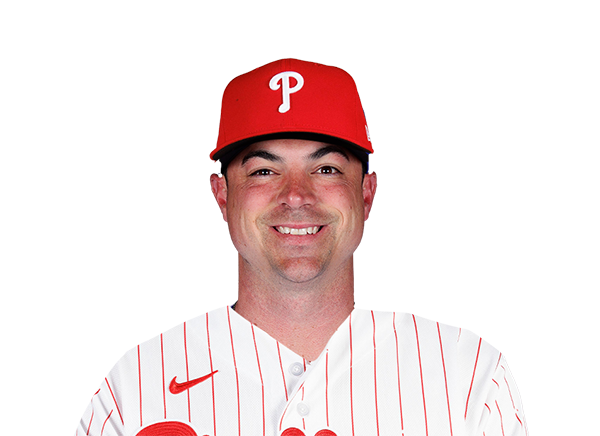 Brooks Raley | 0.1 | 2 | 1 | 1 | 0 | 0 | 0 | 9-6 | 2.47 | 9 |
Atlanta Braves
| Player | IP | H | R | ER | BB | K | HR | PC-ST | ERA | PC |
|---|---|---|---|---|---|---|---|---|---|---|
 Chris Sale | 7.0 | 3 | 3 | 3 | 2 | 6 | 0 | 94-59 | 2.18 | 94 |
 Dylan Lee | 1.1 | 1 | 0 | 0 | 1 | 0 | 0 | 14-7 | 2.56 | 14 |
 Victor Mederos | 0.2 | 0 | 0 | 0 | 0 | 1 | 0 | 7-6 | 2.97 | 7 |
|
Raisel Iglesias | 1.0 | 1 | 1 | 0 | 0 | 1 | 0 | 14-9 | 2.78 | 14 |
|
Didier Fuentes | 1.0 | 2 | 1 | 0 | 1 | 1 | 0 | 18-11 | 2.27 | 18 |
H2H / Season Series
ATL6–5
PHI
PHI1–0
ATL
PHI4–5
ATL
PHI4–2
ATL
PHI2–5
ATL
ATL6–2
PHI
ATL5–8
PHI
ATL5–3
PHI
PHI2–4
ATL
PHI1–3
ATL
Last 5 Games
| Date | Opponent | Result |
|---|---|---|
| Sep 11 | @ ATL | L5–6 |
| Sep 10 |  vs HOU | L1–2 |
| Sep 9 | vs HOU | W11–7 |
| Sep 8 | vs HOU | L5–6 |
| Sep 7 | vs ATL | W1–0 |
| Date | Opponent | Result |
|---|---|---|
| Sep 11 | vs PHI | W6–5 |
| Sep 10 |  vs TB | W3–1 |
| Sep 9 | vs TB | L2–7 |
| Sep 8 | vs TB | L1–7 |
| Sep 7 | @ PHI | L0–1 |
Standings
American League
| Team | W | L | PCT | GB | DIFF | STRK |
|---|---|---|---|---|---|---|
| 1Rays | 88 | 59 | .599 | - | +58 | W1 |
2 White Sox | 75 | 72 | .510 | 13 | +35 | L4 |
| 3Astros | 75 | 73 | .507 | 13.5 | -42 | L1 |
4 Yankees | 85 | 62 | .578 | 3 | +133 | W4 |
5 Red Sox | 80 | 68 | .541 | 8.5 | +81 | L3 |
6 Guardians | 75 | 73 | .507 | 13.5 | -13 | W1 |
7 Blue Jays | 73 | 75 | .493 | 15.5 | -42 | L2 |
8 Rangers | 72 | 76 | .486 | 16.5 | -49 | L3 |
9 Orioles | 72 | 76 | .486 | 16.5 | -24 | W2 |
10 Twins | 69 | 78 | .469 | 19 | -56 | L2 |
11 Mariners | 69 | 79 | .466 | 19.5 | -75 | L1 |
12 Tigers | 68 | 79 | .463 | 20 | +59 | W2 |
13 Royals | 66 | 82 | .446 | 22.5 | -87 | W2 |
14 Athletics | 60 | 88 | .405 | 28.5 | -186 | W2 |
15 Angels | 56 | 91 | .381 | 32 | -74 | L1 |
National League
| Team | W | L | PCT | GB | DIFF | STRK |
|---|---|---|---|---|---|---|
1 Brewers | 92 | 56 | .622 | - | +192 | W4 |
2 Dodgers | 90 | 57 | .612 | 1.5 | +173 | W8 |
| 3Braves | 87 | 61 | .588 | 5 | +111 | W2 |
4 Cubs | 82 | 66 | .554 | 10 | +138 | W1 |
| 5Phillies | 82 | 66 | .554 | 10 | +36 | L2 |
6 Padres | 79 | 68 | .537 | 12.5 | +19 | W5 |
7 Diamondbacks | 79 | 69 | .534 | 13 | +7 | W1 |
8 Pirates | 74 | 74 | .500 | 18 | +26 | L1 |
9 Cardinals | 73 | 75 | .493 | 19 | -8 | W1 |
10 Marlins | 72 | 76 | .486 | 20 | +3 | L4 |
11 Reds | 69 | 78 | .469 | 22.5 | -142 | L4 |
12 Mets | 68 | 79 | .463 | 23.5 | -42 | L1 |
13 Nationals | 68 | 81 | .456 | 24.5 | +1 | W1 |
14 Giants | 62 | 86 | .419 | 30 | -74 | L1 |
15 Rockies | 55 | 92 | .374 | 36.5 | -158 | L5 |
PHI
VS
ATL
Pitchers
Aaron Nola
Catchers
J.T. Realmuto
Infielders
Trea Turner
Luis Arraez
Alec Bohm
Edmundo Sosa
Outfielders
Bryce Harper
Bryan De La Cruz
Derek Hill
Designated Hitters
Kyle Schwarber
Pitchers
Chris Sale
Catchers
Sean Murphy
Infielders
Matt Olson
Mauricio Dubon
Ozzie Albies
Austin Riley
Outfielders
Ronald Acuna Jr.
Michael Harris II
Mike Yastrzemski
Designated Hitters
Drake Baldwin
Phillies
VS
Braves
Batting
148
Team Games Played
148
4959
At Bats
4991
1197
Hits
1228
644
Runs Batted In
649
173
Home Runs
185
99
Stolen Bases
76
.241
Batting Average
.246
664
Runs
677
217
Doubles
235
22
Triples
11
1977
Total Bases
2040
468
Walks
422
1229
Strikeouts
1194
.311
On Base Percentage
.309
.399
Slugging Percentage
.409
.710
OBP Pct + SLG Pct
.718
148
Games Played
148
148
Games Started
148
58
Hit By Pitch
53
0.0
Wins Above Replacement
0.0
0.0
Offensive Wins Above Replacement
0.0
19
Caught Stealing
23
1
Is Qualified
1
628.5
Runs Created
642.1
4.3
Runs Created Per 27 Outs
4.4
.084
Walks Per Plate Appearance
.076
0.38
Walk To Strikeout Ratio
0.35
.157
Isolated Power
.163
.268
Secondary Average
.258
3.90
Pitches Per Plate Appearance
3.88
412
Extra Base Hits
431
5549
Plate Appearances
5520
28.7
At Bats Per Home Run
27.0
11
Sacrifice Hit
9
50
Sacrifice Flies
42
Pitching
148
Team Games Played
148
69
Quality Starts
57
82
Wins
87
66
Losses
61
39
Saves
46
68
Holds
100
1236
Hits
1138
582
Earned runs
521
175
Home Runs
163
441
Walks
496
1443
Strikeouts
1249
9.9
Strikeouts Per 9 Innings
8.5
148.5
Pitches Per Start
144.0
1.27
Walks Plus Hits Per Inning Pitched
1.24
3.98
Earned Run Average
3.57
66
Losses
61
1316.1
Innings pitched
1315.0
.554
Win Percentage
.588
61
Save Opportunities
65
.246
Opponent Batting Average
.232
.313
Opponent's On-base pct.
.307
.400
Opponent's Slugging pct.
.377
.713
Opponent's OPB Pct + SLG Pct
.684
5033
At Bats
4912
206
Doubles
186
24
Triples
20
65
Batters Hit
56
83
Stolen Bases
107
148
Games Played
148
2
Complete Games
1
17
Shutouts
10
37
Wild Pitches
29
596
Runs Batted In
545
3
Balks
4
1316.1
Innings pitched
1315.0
9.9
Strikeouts Per 9 Innings
8.5
35
Caught Stealing
19
148
Games Started
148
0.0
Wins Above Replacement
0.0
1
Is Qualified
1
628
Runs
566
582
Earned Runs
521
2015
Total Bases
1853
Fielding
148
Team Games Played
148
1316
Full Innings
1315
5247
Total Chances
5226
3949
Putouts
3945
1223
Assists
1217
75
Errors
64
217
Double Plays
235
0.986
Fielding Percentage
0.988
35.4
Range Factor
35.3
0.0
Zone Rating
0.0
148
Games Played
148
0
Games Started
0
0.0
Defensive Wins Above Replacement
0.0
1
Qualified
1