

Phillies vs Brewers Live Score (14 Jun, 2026)
Game Information
Stage
Standard
Season
2026
First Pitch
Sun, Jun 14, 2:10 pm
Venue
American Family Field
Location
Milwaukee, Wisconsin
Attendance
40,131
Live Situation
2Balls
0Strikes
0Outs
—Pitcher
—At Bat
Pitch Sequence
1
BALL
Sinker
98 MPH
2
BALL
Curve
84 MPH
3
BALL IN PLAY
Sinker
97 MPH
Injury Report


Team Stats
 PHI
MIL

0
Runs
4
4
Hits
10
1
Errors
1
0
Home Runs
2
0
Walks
1
6
Strikeouts
5
Player Box Score
Philadelphia Phillies
| Player | H-AB | AB | R | H | RBI | HR | BB | K | #P | AVG | OBP | SLG |
|---|---|---|---|---|---|---|---|---|---|---|---|---|
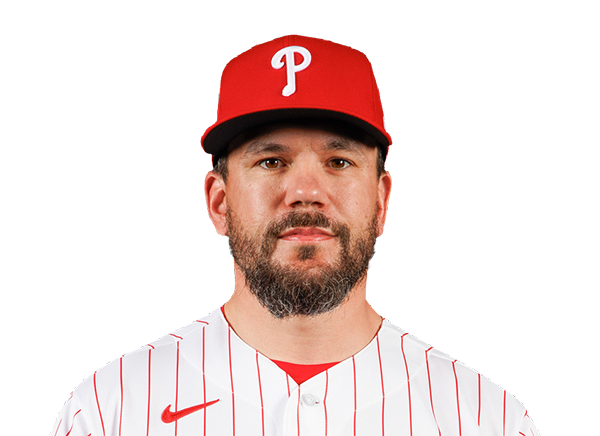 Kyle Schwarber |
1-4 | 4 | 0 | 1 | 0 | 0 | 0 | 0 | 14 | .247 | .363 | .568 |
 Trea Turner |
0-4 | 4 | 0 | 0 | 0 | 0 | 0 | 2 | 20 | .219 | .269 | .330 |
 Bryce Harper |
0-4 | 4 | 0 | 0 | 0 | 0 | 0 | 1 | 13 | .256 | .364 | .496 |
 Alec Bohm |
0-4 | 4 | 0 | 0 | 0 | 0 | 0 | 0 | 16 | .219 | .274 | .352 |
 Brandon Marsh |
0-4 | 4 | 0 | 0 | 0 | 0 | 0 | 1 | 23 | .322 | .356 | .492 |
 Edmundo Sosa |
0-1 | 1 | 0 | 0 | 0 | 0 | 0 | 0 | 6 | .221 | .259 | .375 |
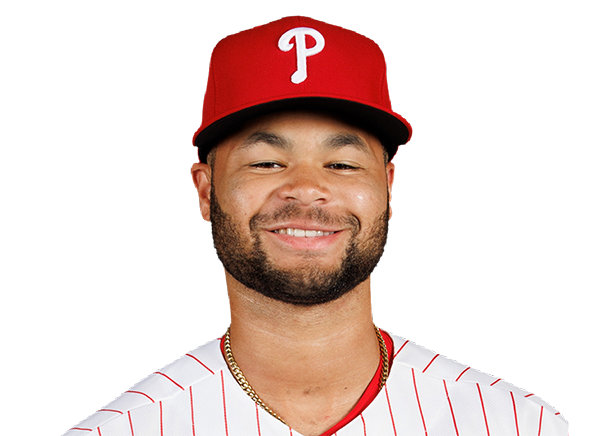 Justin Crawford |
1-1 | 1 | 0 | 1 | 0 | 0 | 0 | 0 | 7 | .231 | .289 | .328 |
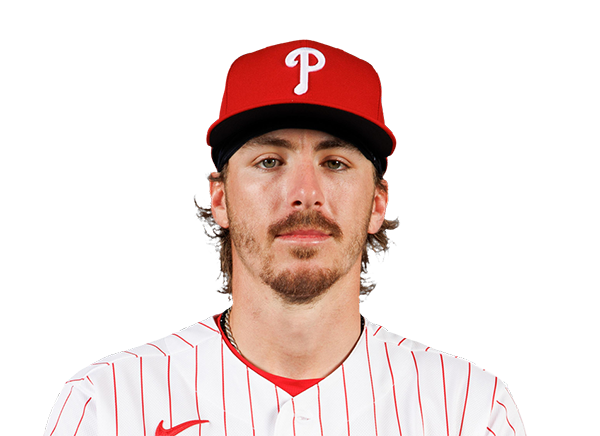 Bryson Stott |
1-3 | 3 | 0 | 1 | 0 | 0 | 0 | 0 | 13 | .232 | .285 | .388 |
 Rafael Marchan |
0-3 | 3 | 0 | 0 | 0 | 0 | 0 | 0 | 8 | .099 | .135 | .183 |
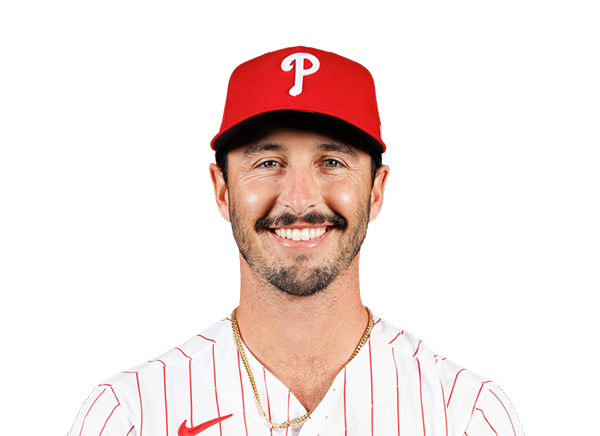 Garrett Stubbs |
0-0 | 0 | 0 | 0 | 0 | 0 | 0 | 0 | 0 | .200 | .292 | .200 |
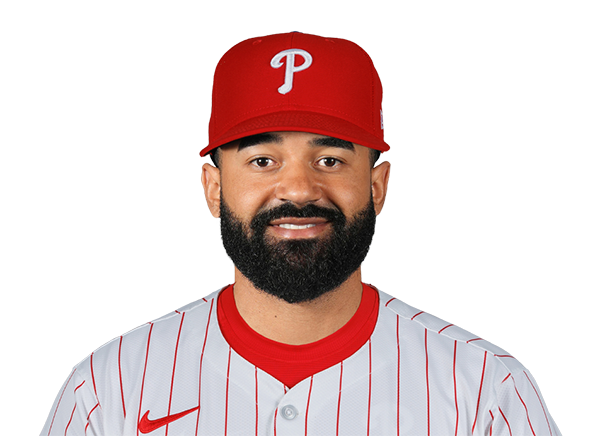 Derek Hill |
1-3 | 3 | 0 | 1 | 0 | 0 | 0 | 2 | 9 | .250 | .250 | .250 |
Milwaukee Brewers
| Player | H-AB | AB | R | H | RBI | HR | BB | K | #P | AVG | OBP | SLG |
|---|---|---|---|---|---|---|---|---|---|---|---|---|
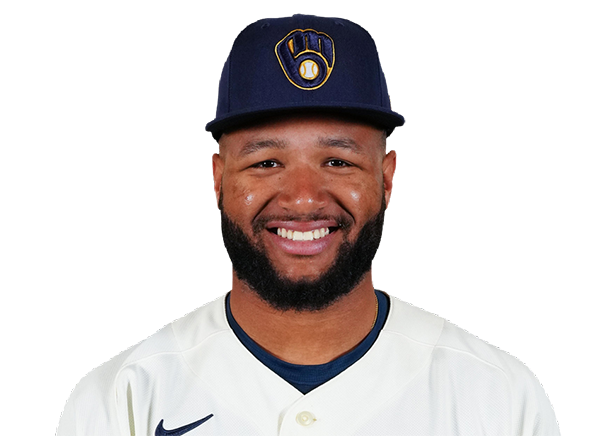 Jackson Chourio |
2-4 | 4 | 1 | 2 | 1 | 1 | 0 | 0 | 18 | .322 | .370 | .572 |
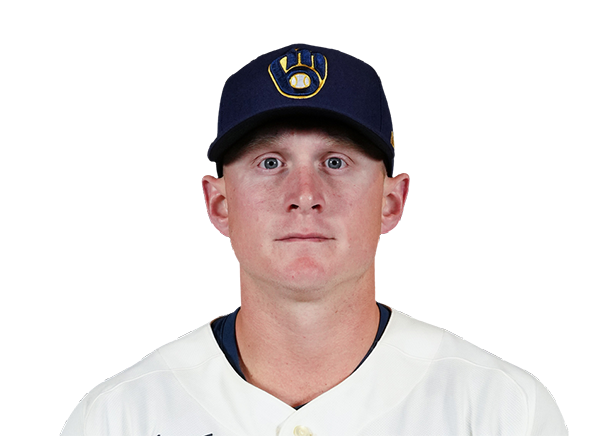 Andrew Vaughn |
0-3 | 3 | 0 | 0 | 0 | 0 | 1 | 1 | 16 | .354 | .431 | .531 |
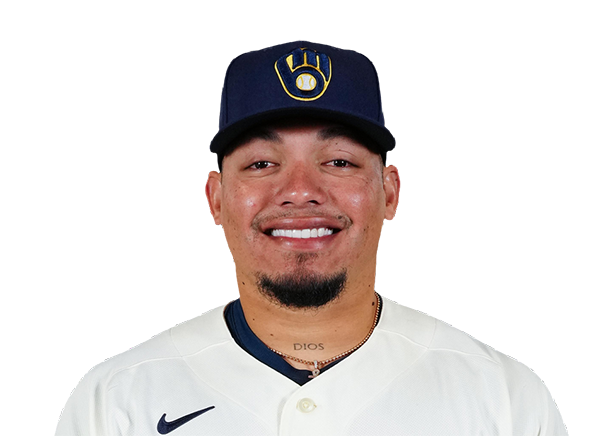 William Contreras |
2-4 | 4 | 0 | 2 | 0 | 0 | 0 | 0 | 15 | .295 | .352 | .411 |
 Gary Sanchez |
1-4 | 4 | 1 | 1 | 0 | 0 | 0 | 0 | 16 | .227 | .370 | .473 |
 Luis Rengifo |
1-4 | 4 | 1 | 1 | 0 | 0 | 0 | 0 | 19 | .205 | .280 | .254 |
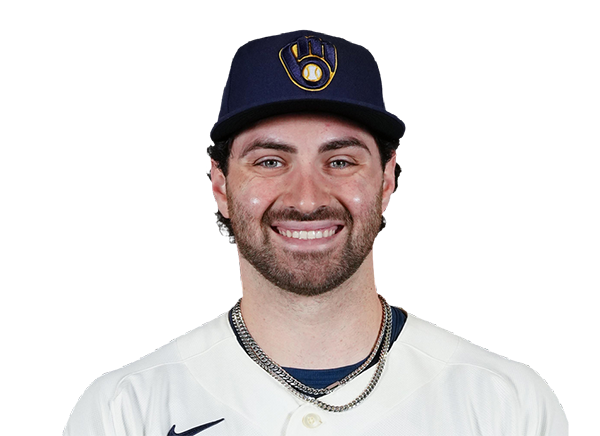 Garrett Mitchell |
0-4 | 4 | 0 | 0 | 0 | 0 | 0 | 2 | 12 | .251 | .353 | .412 |
 Blake Perkins |
2-4 | 4 | 1 | 2 | 3 | 1 | 0 | 1 | 24 | .133 | .235 | .227 |
 Joey Ortiz |
1-3 | 3 | 0 | 1 | 0 | 0 | 0 | 0 | 9 | .207 | .299 | .262 |
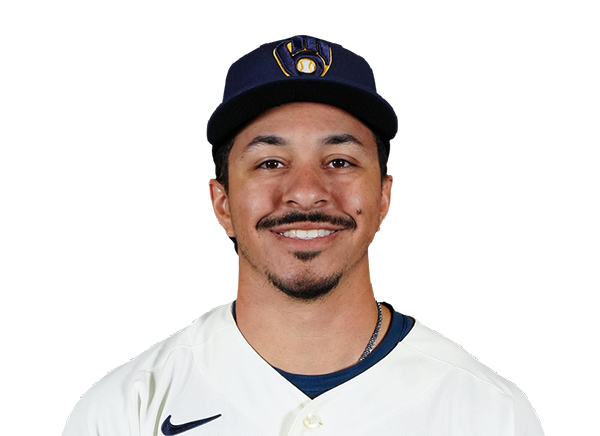 David Hamilton |
1-3 | 3 | 0 | 1 | 0 | 0 | 0 | 1 | 11 | .231 | .316 | .320 |
Philadelphia Phillies
| Player | IP | H | R | ER | BB | K | HR | PC-ST | ERA | PC |
|---|---|---|---|---|---|---|---|---|---|---|
 Cristopher Sanchez |
5.2 | 8 | 4 | 4 | 1 | 3 | 2 | 98-63 | 1.82 | 98 |
 Chase Shugart |
1.1 | 1 | 0 | 0 | 0 | 1 | 0 | 20-14 | 3.13 | 20 |
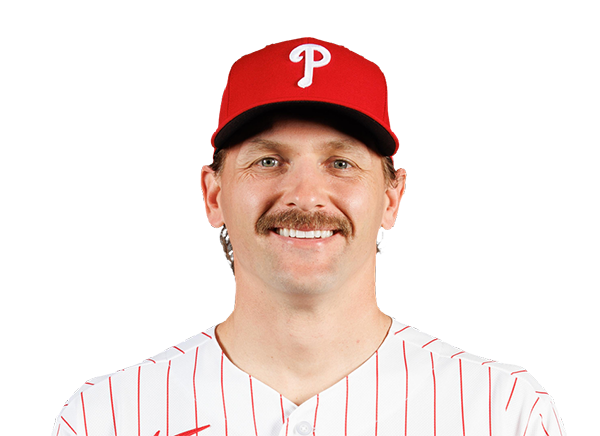 Tanner Banks |
1.0 | 1 | 0 | 0 | 0 | 1 | 0 | 22-16 | 5.96 | 22 |
Milwaukee Brewers
| Player | IP | H | R | ER | BB | K | HR | PC-ST | ERA | PC |
|---|---|---|---|---|---|---|---|---|---|---|
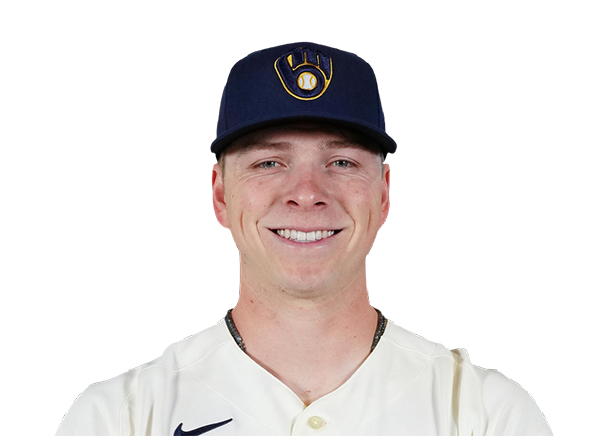 Kyle Harrison |
6.0 | 3 | 0 | 0 | 0 | 3 | 0 | 80-55 | 2.47 | 80 |
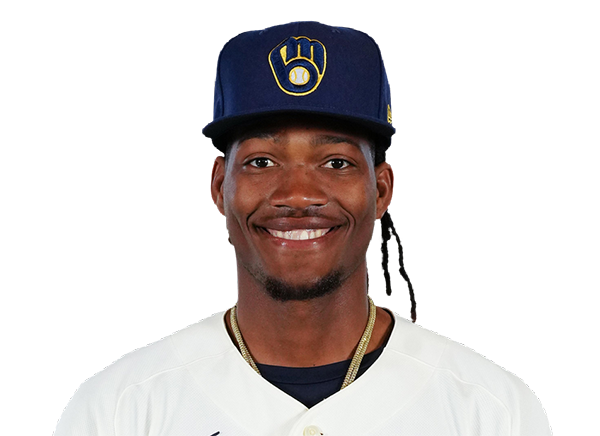 Abner Uribe |
1.0 | 1 | 0 | 0 | 0 | 0 | 0 | 22-15 | 3.65 | 22 |
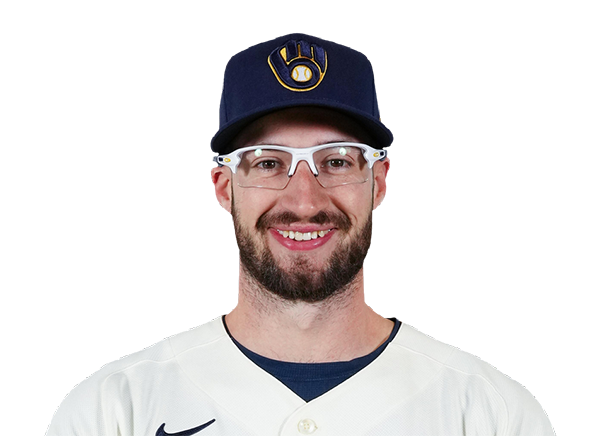 Aaron Ashby |
2.0 | 0 | 0 | 0 | 0 | 3 | 0 | 27-18 | 2.72 | 27 |
H2H / Season Series
MIL4–0
PHI
MIL8–9
PHI
MIL6–0
PHI
Last 5 Games
| Date | Opponent | Result |
|---|---|---|
| Aug 21 |  vs STL | W7–6 |
| Aug 19 |  vs MIA | W4–1 |
| Aug 18 | vs MIA | W6–4 |
| Aug 17 | vs MIA | W6–5 |
| Aug 16 |  @ MIN | W7–5 |
| Date | Opponent | Result |
|---|---|---|
| Aug 22 |  vs ATL | W4–1 |
| Aug 21 | vs ATL | W2–1 |
| Aug 20 |  vs SEA | W7–4 |
| Aug 19 | vs SEA | L5–7 |
| Aug 18 | vs SEA | W22–0 |
Standings
American League
| Team | W | L | PCT | GB | DIFF | STRK |
|---|---|---|---|---|---|---|
1 Rays | 76 | 52 | .594 | - | +43 | L2 |
2 White Sox | 67 | 61 | .523 | 9 | +47 | W1 |
3 Astros | 65 | 64 | .504 | 11.5 | -42 | W1 |
4 Yankees | 73 | 56 | .566 | 3.5 | +95 | L1 |
5 Red Sox | 69 | 59 | .539 | 7 | +97 | W1 |
6 Rangers | 64 | 65 | .496 | 12.5 | -45 | W2 |
7 Blue Jays | 64 | 67 | .489 | 13.5 | -50 | W1 |
| 8Twins | 63 | 66 | .488 | 13.5 | -45 | L1 |
9 Guardians | 63 | 66 | .488 | 13.5 | -15 | W2 |
10 Orioles | 62 | 67 | .481 | 14.5 | -34 | W1 |
11 Tigers | 61 | 67 | .477 | 15 | +79 | L3 |
| 12Mariners | 61 | 68 | .473 | 15.5 | -45 | W1 |
13 Royals | 56 | 74 | .431 | 21 | -97 | W6 |
14 Angels | 51 | 78 | .395 | 25.5 | -71 | L1 |
15 Athletics | 49 | 80 | .380 | 27.5 | -189 | L5 |
National League
| Team | W | L | PCT | GB | DIFF | STRK |
|---|---|---|---|---|---|---|
| 1Brewers | 81 | 49 | .623 | - | +163 | W3 |
2 Dodgers | 78 | 51 | .605 | 2.5 | +146 | W4 |
| 3Braves | 75 | 55 | .577 | 6 | +108 | L2 |
4 Cubs | 74 | 55 | .574 | 6.5 | +99 | L2 |
| 5Phillies | 71 | 58 | .550 | 9.5 | +16 | W7 |
6 Padres | 69 | 60 | .535 | 11.5 | +7 | W1 |
7 Diamondbacks | 68 | 61 | .527 | 12.5 | +13 | W2 |
| 8Cardinals | 66 | 64 | .508 | 15 | +9 | L1 |
| 9Marlins | 65 | 64 | .504 | 15.5 | +15 | W1 |
10 Pirates | 63 | 67 | .485 | 18 | +30 | L1 |
11 Reds | 61 | 68 | .473 | 19.5 | -98 | L2 |
12 Nationals | 61 | 69 | .469 | 20 | +16 | L2 |
13 Mets | 58 | 71 | .450 | 22.5 | -44 | L1 |
14 Giants | 52 | 76 | .406 | 28 | -78 | L2 |
15 Rockies | 50 | 78 | .391 | 30 | -130 | L4 |
PHI
VS
MIL
Pitchers
Cristopher Sanchez
Chase Shugart
Tanner Banks
Catchers
Rafael Marchan
Garrett Stubbs
Infielders
Trea Turner
Bryce Harper
Alec Bohm
Bryson Stott
Outfielders
Brandon Marsh
Edmundo Sosa
Justin Crawford
Derek Hill
Designated Hitters
Kyle Schwarber
Pitchers
Kyle Harrison
Abner Uribe
Aaron Ashby
Catchers
Gary Sanchez
Infielders
Andrew Vaughn
Luis Rengifo
Joey Ortiz
David Hamilton
Outfielders
Jackson Chourio
Garrett Mitchell
Blake Perkins
Designated Hitters
William Contreras
Phillies
VS
Brewers
Batting
129
Team Games Played
129
4322
At Bats
4361
1044
Hits
1104
562
Runs Batted In
605
155
Home Runs
119
95
Stolen Bases
129
.242
Batting Average
.253
581
Runs
644
185
Doubles
226
21
Triples
20
1736
Total Bases
1727
416
Walks
537
1086
Strikeouts
1084
.313
On Base Percentage
.337
.402
Slugging Percentage
.396
.715
OBP Pct + SLG Pct
.733
129
Games Played
129
129
Games Started
129
53
Hit By Pitch
32
0.0
Wins Above Replacement
0.0
0.0
Offensive Wins Above Replacement
0.0
16
Caught Stealing
41
1
Is Qualified
1
558.4
Runs Created
608.3
4.4
Runs Created Per 27 Outs
4.8
.086
Walks Per Plate Appearance
.107
0.38
Walk To Strikeout Ratio
0.50
.160
Isolated Power
.143
.275
Secondary Average
.286
3.89
Pitches Per Plate Appearance
4.00
361
Extra Base Hits
365
4849
Plate Appearances
5000
27.9
At Bats Per Home Run
36.6
11
Sacrifice Hit
29
44
Sacrifice Flies
34
Pitching
129
Team Games Played
129
55
Quality Starts
45
71
Wins
80
58
Losses
49
35
Saves
42
57
Holds
66
1103
Hits
933
524
Earned runs
441
152
Home Runs
129
393
Walks
408
1272
Strikeouts
1253
10.0
Strikeouts Per 9 Innings
9.8
149.5
Pitches Per Start
145.2
1.31
Walks Plus Hits Per Inning Pitched
1.16
4.12
Earned Run Average
3.44
58
Losses
49
1145.2
Innings pitched
1153.1
.550
Win Percentage
.620
52
Save Opportunities
60
.250
Opponent Batting Average
.219
.318
Opponent's On-base pct.
.294
.406
Opponent's Slugging pct.
.357
.724
Opponent's OPB Pct + SLG Pct
.651
4405
At Bats
4257
186
Doubles
172
22
Triples
13
57
Batters Hit
52
76
Stolen Bases
55
129
Games Played
129
1
Complete Games
1
15
Shutouts
9
32
Wild Pitches
44
538
Runs Batted In
465
3
Balks
6
1145.2
Innings pitched
1153.1
10.0
Strikeouts Per 9 Innings
9.8
34
Caught Stealing
29
129
Games Started
129
0.0
Wins Above Replacement
0.0
1
Is Qualified
1
565
Runs
484
524
Earned Runs
441
1789
Total Bases
1518
Fielding
129
Team Games Played
129
1146
Full Innings
1153
4558
Total Chances
4522
3437
Putouts
3460
1056
Assists
1005
65
Errors
57
185
Double Plays
226
0.986
Fielding Percentage
0.987
35.3
Range Factor
34.8
0.0
Zone Rating
0.0
129
Games Played
129
0
Games Started
0
0.0
Defensive Wins Above Replacement
0.0
1
Qualified
1