

Phillies vs Diamondbacks Live Score (2 Sep, 2026)
Game Information
Stage
STD
Season
2026
First Pitch
Tue, Sep 1, 9:40 pm
Venue
Chase Field
Location
Phoenix, Arizona
Venue Type
Indoor
Broadcast
MLB.TV
Attendance
27,395
Live Situation
2Balls
1Strikes
0Outs
—Pitcher
—At Bat
Pitch Sequence
1
BALL
Cutter
94 MPH
2
STRIKE FOUL
Sinker
94 MPH
3
BALL
Cutter
91 MPH
4
BALL IN PLAY
Sweeper
82 MPH
Injury Report









Team Stats
 PHI
ARI


7
Runs
1
13
Hits
6
0
Errors
0
0
Home Runs
1
5
Walks
1
6
Strikeouts
8
Player Box Score
Philadelphia Phillies
| Player | H-AB | AB | R | H | RBI | HR | BB | K | #P | AVG | OBP | SLG |
|---|---|---|---|---|---|---|---|---|---|---|---|---|
 Kyle Schwarber | 0-3 | 3 | 1 | 0 | 1 | 0 | 1 | 2 | 18 | .241 | .357 | .521 |
 Trea Turner | 1-5 | 5 | 1 | 1 | 1 | 0 | 0 | 0 | 22 | .241 | .294 | .379 |
 Bryce Harper | 4-4 | 4 | 1 | 4 | 1 | 0 | 1 | 0 | 25 | .274 | .392 | .509 |
 Luis Arraez | 2-4 | 4 | 0 | 2 | 0 | 0 | 1 | 0 | 20 | .317 | .350 | .432 |
 Alec Bohm | 2-4 | 4 | 1 | 2 | 1 | 0 | 1 | 2 | 23 | .246 | .308 | .382 |
 Edmundo Sosa | 1-3 | 3 | 0 | 1 | 0 | 0 | 0 | 0 | 11 | .238 | .276 | .401 |
 Brandon Marsh | 0-2 | 2 | 0 | 0 | 0 | 0 | 0 | 0 | 9 | .270 | .316 | .424 |
 Bryson Stott | 0-3 | 3 | 1 | 0 | 1 | 0 | 1 | 0 | 14 | .257 | .333 | .406 |
 J.T. Realmuto | 1-5 | 5 | 1 | 1 | 0 | 0 | 0 | 1 | 22 | .224 | .298 | .359 |
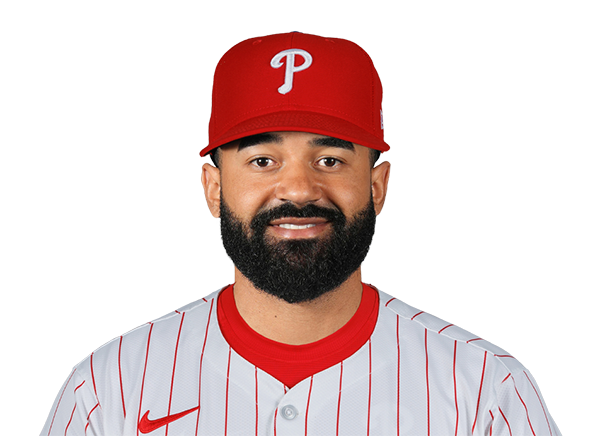 Derek Hill | 1-3 | 3 | 0 | 1 | 0 | 0 | 0 | 1 | 13 | .243 | .295 | .418 |
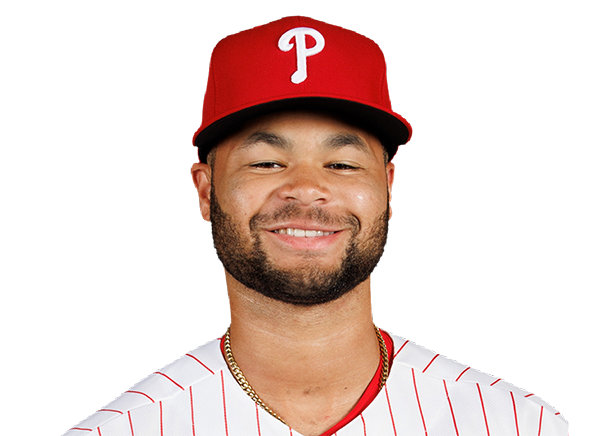 Justin Crawford | 1-1 | 1 | 1 | 1 | 1 | 0 | 0 | 0 | 1 | .268 | .318 | .352 |
Arizona Diamondbacks
| Player | H-AB | AB | R | H | RBI | HR | BB | K | #P | AVG | OBP | SLG |
|---|---|---|---|---|---|---|---|---|---|---|---|---|
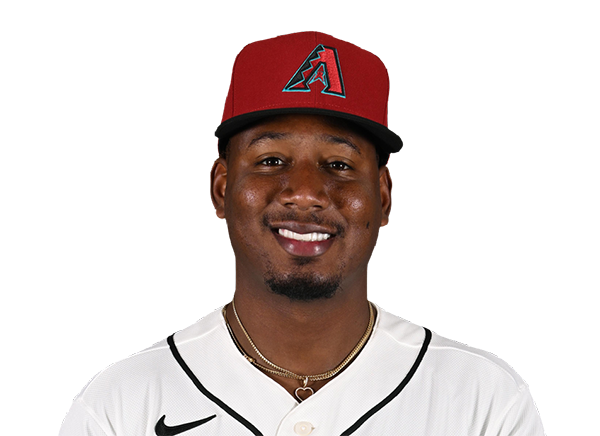 Geraldo Perdomo | 0-4 | 4 | 0 | 0 | 0 | 0 | 0 | 1 | 18 | .253 | .360 | .370 |
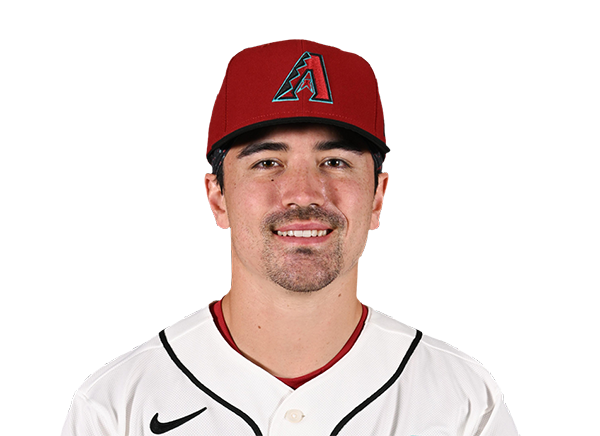 Corbin Carroll | 0-4 | 4 | 0 | 0 | 0 | 0 | 0 | 3 | 20 | .242 | .339 | .472 |
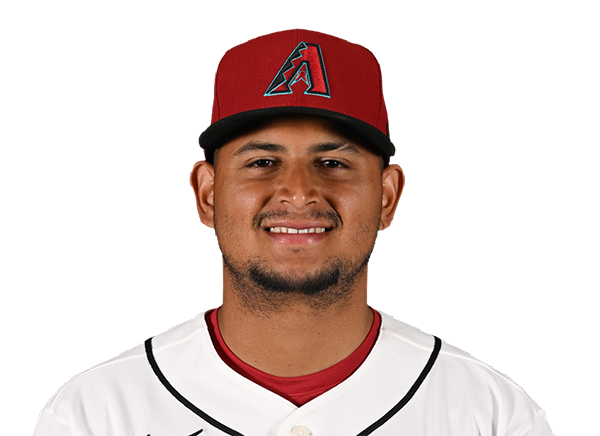 Gabriel Moreno | 0-4 | 4 | 0 | 0 | 0 | 0 | 0 | 1 | 14 | .300 | .379 | .463 |
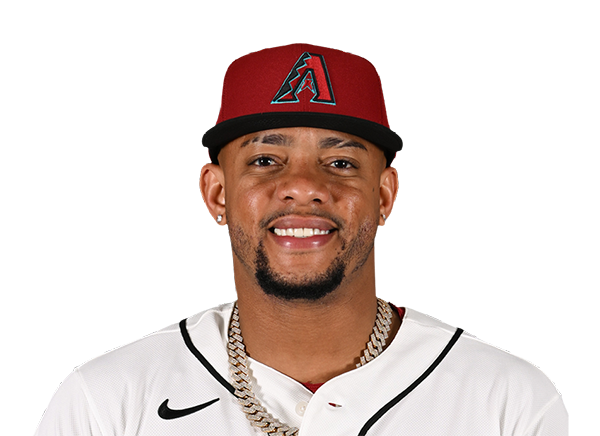 Ketel Marte | 1-3 | 3 | 0 | 1 | 0 | 0 | 0 | 0 | 11 | .251 | .317 | .444 |
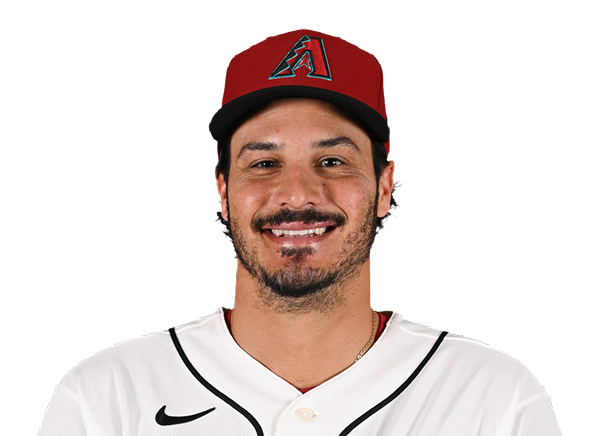 Nolan Arenado | 0-4 | 4 | 0 | 0 | 0 | 0 | 0 | 1 | 15 | .236 | .310 | .425 |
 Ildemaro Vargas | 1-4 | 4 | 0 | 1 | 0 | 0 | 0 | 1 | 12 | .253 | .295 | .387 |
 Tim Tawa | 1-4 | 4 | 0 | 1 | 0 | 0 | 0 | 0 | 13 | .243 | .300 | .399 |
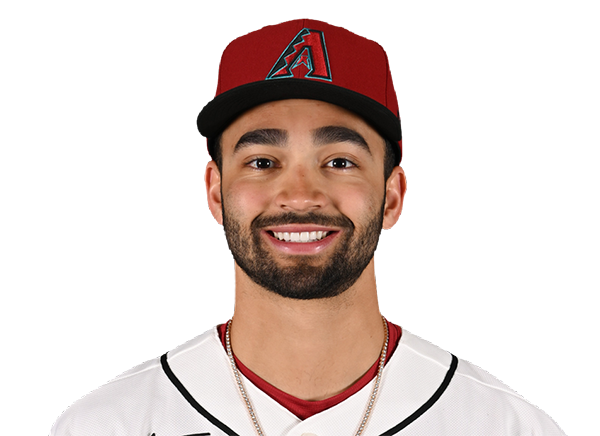 Jordan Lawlar | 2-3 | 3 | 1 | 2 | 1 | 1 | 0 | 0 | 13 | .288 | .358 | .479 |
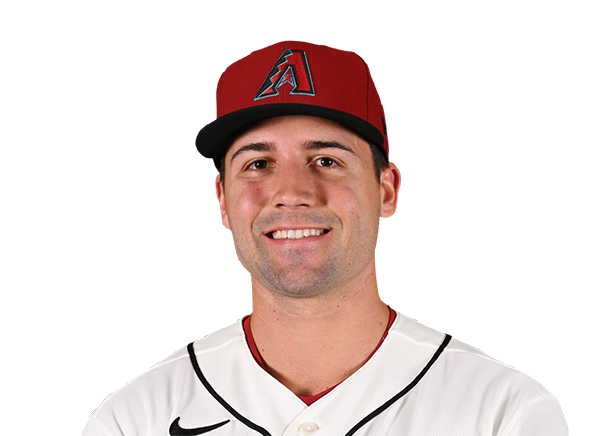 Ryan Waldschmidt | 1-2 | 2 | 0 | 1 | 0 | 0 | 1 | 1 | 16 | .273 | .336 | .388 |
Philadelphia Phillies
| Player | IP | H | R | ER | BB | K | HR | PC-ST | ERA | PC |
|---|---|---|---|---|---|---|---|---|---|---|
 Jesus Luzardo | 6.2 | 6 | 1 | 1 | 1 | 6 | 1 | 99-65 | 3.02 | 99 |
 Jonathan Bowlan | 1.1 | 0 | 0 | 0 | 0 | 2 | 0 | 21-15 | 2.82 | 21 |
 Chase Shugart | 1.0 | 0 | 0 | 0 | 0 | 0 | 0 | 12-8 | 4.60 | 12 |
Arizona Diamondbacks
| Player | IP | H | R | ER | BB | K | HR | PC-ST | ERA | PC |
|---|---|---|---|---|---|---|---|---|---|---|
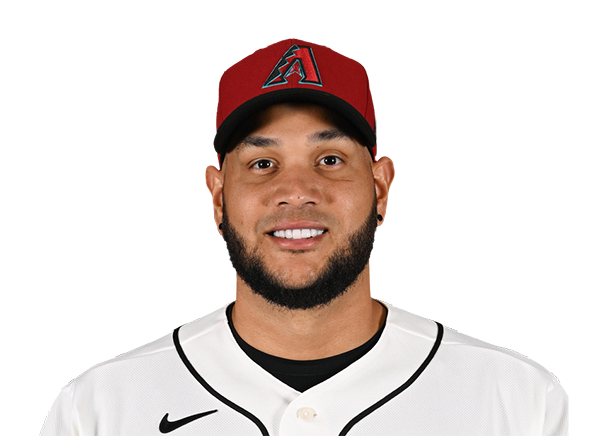 Eduardo Rodriguez | 5.0 | 8 | 3 | 3 | 3 | 3 | 0 | 103-66 | 2.59 | 103 |
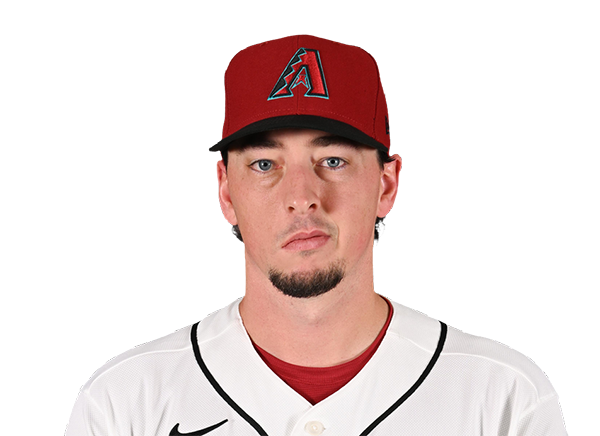 Taylor Clarke | 1.0 | 0 | 0 | 0 | 0 | 2 | 0 | 10-7 | 2.60 | 10 |
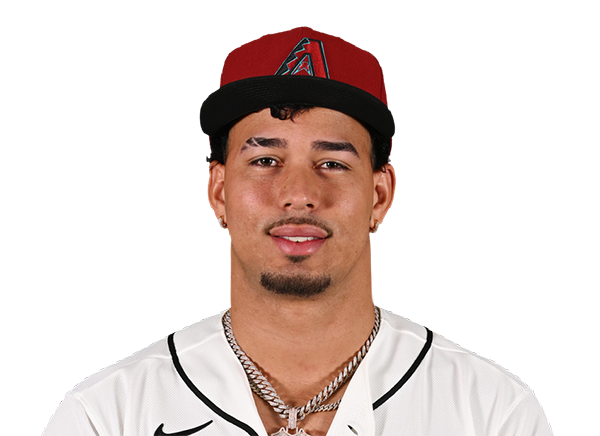 Justin Martinez | 1.0 | 1 | 0 | 0 | 1 | 1 | 0 | 21-10 | 0.00 | 21 |
 Gerardo Carrillo | 0.0 | 2 | 3 | 3 | 1 | 0 | 0 | 13-6 | 2.65 | 13 |
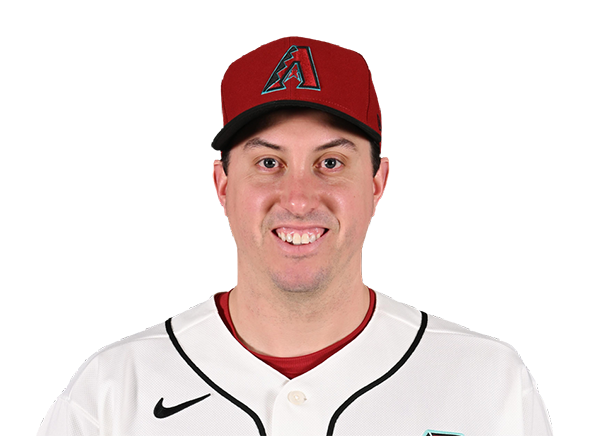 Derek Law | 1.0 | 1 | 0 | 0 | 0 | 0 | 0 | 17-10 | 3.86 | 17 |
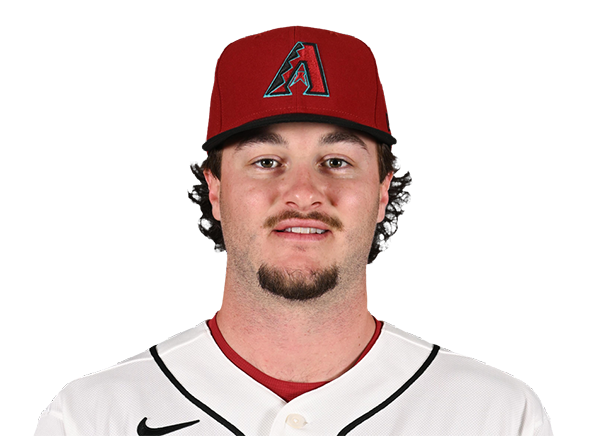 Blake Walston | 1.0 | 1 | 1 | 1 | 0 | 0 | 0 | 14-8 | 9.00 | 14 |
H2H / Season Series
ARI1–7
PHI
ARI1–2
PHI
PHI3–4
ARI
PHI4–3
ARI
PHI4–5
ARI
Last 5 Games
| Date | Opponent | Result |
|---|---|---|
| Sep 1 | @ ARI | W7–1 |
| Aug 31 | @ ARI | W2–1 |
| Aug 30 |  @ LAA | W5–2 |
| Aug 29 | @ LAA | W4–2 |
| Aug 28 | @ LAA | W5–3 |
| Date | Opponent | Result |
|---|---|---|
| Sep 1 | vs PHI | L1–7 |
| Aug 31 | vs PHI | L1–2 |
| Aug 29 |  @ SF | L2–7 |
| Aug 29 | @ SF | W7–1 |
| Aug 28 | @ SF | W10–6 |
Standings
American League
| Team | W | L | PCT | GB | DIFF | STRK |
|---|---|---|---|---|---|---|
1 Rays | 83 | 55 | .601 | - | +57 | W1 |
2 White Sox | 72 | 65 | .526 | 10.5 | +41 | L2 |
3 Astros | 70 | 68 | .507 | 13 | -40 | W2 |
4 Yankees | 78 | 60 | .565 | 5 | +108 | L1 |
5 Red Sox | 75 | 64 | .540 | 8.5 | +82 | L1 |
6 Guardians | 70 | 68 | .507 | 13 | +3 | W2 |
7 Orioles | 69 | 69 | .500 | 14 | -17 | W4 |
8 Rangers | 68 | 70 | .493 | 15 | -44 | W2 |
9 Blue Jays | 68 | 71 | .489 | 15.5 | -55 | L1 |
10 Twins | 67 | 72 | .482 | 16.5 | -33 | W3 |
11 Mariners | 65 | 74 | .468 | 18.5 | -70 | W1 |
12 Tigers | 63 | 75 | .457 | 20 | +42 | L3 |
13 Royals | 62 | 77 | .446 | 21.5 | -86 | L2 |
14 Athletics | 53 | 85 | .384 | 30 | -198 | L4 |
| 15Angels | 53 | 85 | .384 | 30 | -73 | W1 |
National League
| Team | W | L | PCT | GB | DIFF | STRK |
|---|---|---|---|---|---|---|
1 Brewers | 85 | 53 | .616 | - | +163 | L2 |
2 Dodgers | 82 | 55 | .599 | 2.5 | +153 | W1 |
3 Braves | 82 | 57 | .590 | 3.5 | +109 | L2 |
4 Cubs | 78 | 60 | .565 | 7 | +141 | W1 |
| 5Phillies | 78 | 60 | .565 | 7 | +31 | W5 |
| 6Diamondbacks | 73 | 66 | .525 | 12.5 | +4 | L2 |
7 Padres | 73 | 66 | .525 | 12.5 | +14 | L1 |
8 Marlins | 70 | 69 | .504 | 15.5 | +15 | W1 |
9 Cardinals | 68 | 70 | .493 | 17 | -15 | L2 |
10 Pirates | 68 | 71 | .489 | 17.5 | +27 | W3 |
11 Nationals | 67 | 74 | .475 | 19.5 | +23 | W2 |
12 Reds | 66 | 73 | .475 | 19.5 | -112 | W1 |
13 Mets | 62 | 77 | .446 | 23.5 | -56 | L1 |
| 14Giants | 57 | 82 | .410 | 28.5 | -71 | L1 |
15 Rockies | 52 | 86 | .377 | 33 | -143 | L5 |
PHI
VS
ARI
Pitchers
Jesus Luzardo
Catchers
J.T. Realmuto
Infielders
Trea Turner
Luis Arraez
Alec Bohm
Bryson Stott
Outfielders
Bryce Harper
Edmundo Sosa
Derek Hill
Designated Hitters
Kyle Schwarber
Pitchers
Eduardo Rodriguez
Catchers
Gabriel Moreno
Infielders
Geraldo Perdomo
Nolan Arenado
Ildemaro Vargas
Tim Tawa
Outfielders
Corbin Carroll
Jordan Lawlar
Ryan Waldschmidt
Designated Hitters
Ketel Marte
Phillies
VS
Diamondbacks
Batting
139
Team Games Played
140
4667
At Bats
4689
1136
Hits
1142
611
Runs Batted In
598
165
Home Runs
137
97
Stolen Bases
96
.243
Batting Average
.244
631
Runs
627
201
Doubles
235
21
Triples
35
1874
Total Bases
1858
448
Walks
466
1152
Strikeouts
1016
.314
On Base Percentage
.316
.402
Slugging Percentage
.396
.715
OBP Pct + SLG Pct
.712
139
Games Played
140
139
Games Started
140
54
Hit By Pitch
49
0.0
Wins Above Replacement
0.0
0.0
Offensive Wins Above Replacement
0.0
18
Caught Stealing
23
1
Is Qualified
1
603.0
Runs Created
605.0
4.4
Runs Created Per 27 Outs
4.4
.086
Walks Per Plate Appearance
.088
0.39
Walk To Strikeout Ratio
0.46
.158
Isolated Power
.153
.271
Secondary Average
.268
3.90
Pitches Per Plate Appearance
3.94
387
Extra Base Hits
407
5232
Plate Appearances
5284
28.3
At Bats Per Home Run
34.2
11
Sacrifice Hit
33
49
Sacrifice Flies
44
Pitching
139
Team Games Played
140
62
Quality Starts
50
79
Wins
73
60
Losses
67
38
Saves
33
64
Holds
74
1166
Hits
1182
550
Earned runs
578
162
Home Runs
160
423
Walks
421
1366
Strikeouts
954
10.0
Strikeouts Per 9 Innings
6.9
149.2
Pitches Per Start
141.5
1.29
Walks Plus Hits Per Inning Pitched
1.29
4.01
Earned Run Average
4.19
60
Losses
67
1234.2
Innings pitched
1242.0
.568
Win Percentage
.521
56
Save Opportunities
48
.247
Opponent Batting Average
.250
.315
Opponent's On-base pct.
.316
.399
Opponent's Slugging pct.
.413
.714
Opponent's OPB Pct + SLG Pct
.729
4728
At Bats
4723
190
Doubles
235
23
Triples
27
62
Batters Hit
55
82
Stolen Bases
84
139
Games Played
140
1
Complete Games
1
16
Shutouts
9
37
Wild Pitches
26
563
Runs Batted In
613
3
Balks
5
1234.2
Innings pitched
1242.0
10.0
Strikeouts Per 9 Innings
6.9
35
Caught Stealing
18
139
Games Started
140
0.0
Wins Above Replacement
0.0
1
Is Qualified
1
594
Runs
629
550
Earned Runs
578
1888
Total Bases
1951
Fielding
139
Team Games Played
140
1235
Full Innings
1242
4917
Total Chances
4999
3704
Putouts
3726
1144
Assists
1220
69
Errors
53
201
Double Plays
235
0.986
Fielding Percentage
0.989
35.3
Range Factor
35.8
0.0
Zone Rating
0.0
139
Games Played
140
0
Games Started
0
0.0
Defensive Wins Above Replacement
0.0
1
Qualified
1