

Phillies vs Mets Live Score (18 Sep, 2026)
Game Information
Stage
STD
Season
2026
First Pitch
Fri, Sep 18, 7:10 pm
Venue
Citi Field
Location
Queens, New York
Venue Type
Outdoor
Broadcast
Apple TV
Attendance
29,764
Live Situation
0Balls
0Strikes
0Outs
—Pitcher
—At Bat
Pitch Sequence
1
BALL IN PLAY
Four-seam FB
98 MPH
Injury Report






Team Stats
 PHI
NYM


3
Runs
6
6
Hits
13
0
Errors
0
2
Home Runs
1
1
Walks
2
5
Strikeouts
8
Player Box Score
Philadelphia Phillies
| Player | H-AB | AB | R | H | RBI | HR | BB | K | #P | AVG | OBP | SLG |
|---|---|---|---|---|---|---|---|---|---|---|---|---|
 Kyle Schwarber | 0-2 | 2 | 0 | 0 | 0 | 0 | 1 | 1 | 18 | .235 | .351 | .513 |
 Trea Turner | 1-4 | 4 | 0 | 1 | 0 | 0 | 0 | 1 | 14 | .239 | .293 | .379 |
 Bryce Harper | 0-4 | 4 | 0 | 0 | 0 | 0 | 0 | 3 | 18 | .272 | .385 | .494 |
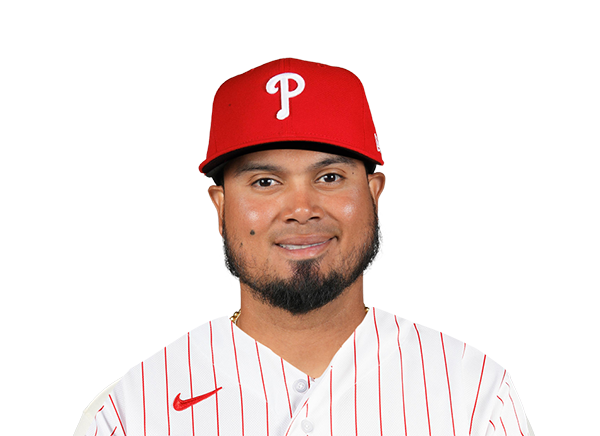 Luis Arraez | 0-4 | 4 | 0 | 0 | 0 | 0 | 0 | 0 | 10 | .313 | .349 | .425 |
 Alec Bohm | 0-4 | 4 | 0 | 0 | 0 | 0 | 0 | 0 | 10 | .249 | .314 | .388 |
 Edmundo Sosa | 3-3 | 3 | 2 | 3 | 1 | 1 | 0 | 0 | 6 | .249 | .287 | .421 |
 Brandon Marsh | 0-1 | 1 | 0 | 0 | 0 | 0 | 0 | 0 | 4 | .261 | .306 | .408 |
 Bryson Stott | 1-4 | 4 | 0 | 1 | 1 | 0 | 0 | 0 | 14 | .250 | .326 | .391 |
 J.T. Realmuto | 0-4 | 4 | 0 | 0 | 0 | 0 | 0 | 0 | 8 | .216 | .290 | .347 |
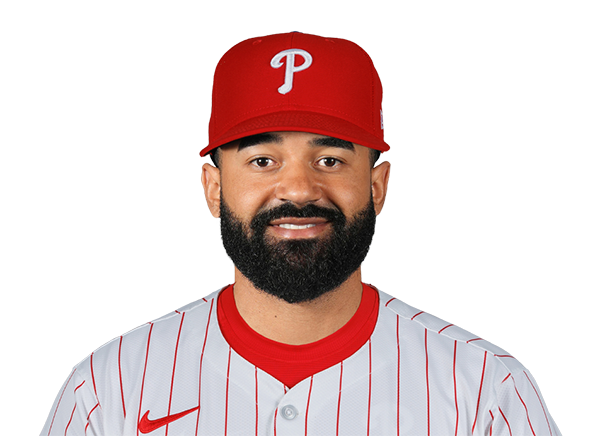 Derek Hill | 1-3 | 3 | 1 | 1 | 1 | 1 | 0 | 0 | 14 | .246 | .297 | .451 |
New York Mets
| Player | H-AB | AB | R | H | RBI | HR | BB | K | #P | AVG | OBP | SLG |
|---|---|---|---|---|---|---|---|---|---|---|---|---|
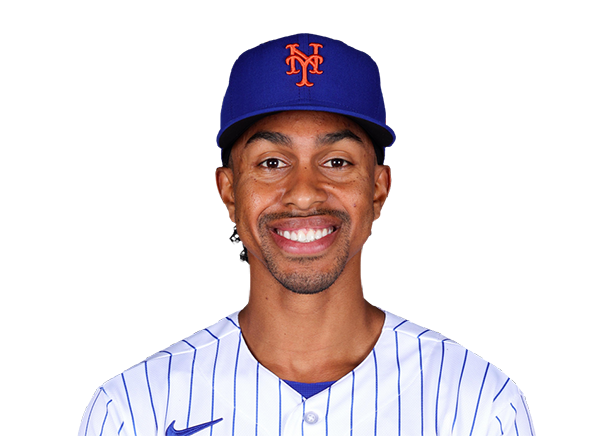 Francisco Lindor | 2-5 | 5 | 1 | 2 | 0 | 0 | 0 | 2 | 20 | .230 | .314 | .436 |
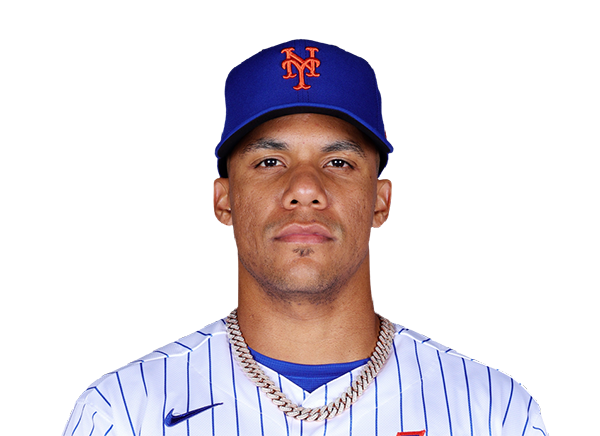 Juan Soto | 3-5 | 5 | 1 | 3 | 3 | 1 | 0 | 0 | 23 | .274 | .393 | .527 |
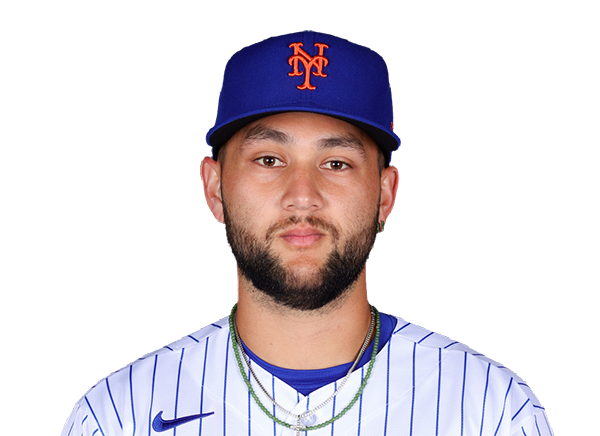 Bo Bichette | 1-5 | 5 | 1 | 1 | 0 | 0 | 0 | 1 | 27 | .263 | .312 | .388 |
 Carson Benge | 2-3 | 3 | 1 | 2 | 1 | 0 | 0 | 0 | 16 | .272 | .335 | .413 |
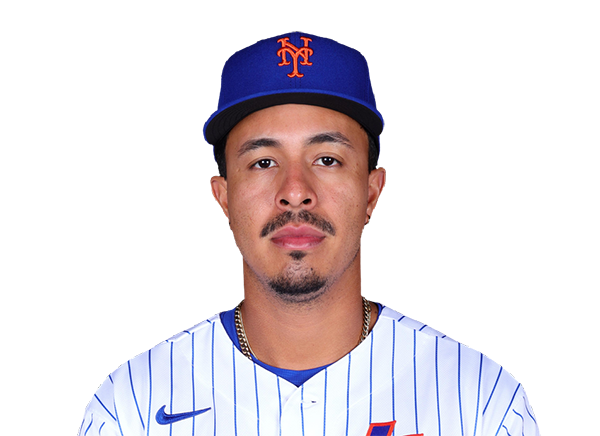 Mark Vientos | 1-3 | 3 | 0 | 1 | 0 | 0 | 1 | 0 | 13 | .218 | .267 | .405 |
 A.J. Ewing | 1-4 | 4 | 0 | 1 | 2 | 0 | 0 | 2 | 12 | .254 | .323 | .378 |
 Marcus Semien | 1-4 | 4 | 1 | 1 | 0 | 0 | 0 | 0 | 10 | .220 | .284 | .344 |
 Brett Baty | 1-3 | 3 | 0 | 1 | 0 | 0 | 1 | 1 | 18 | .229 | .304 | .362 |
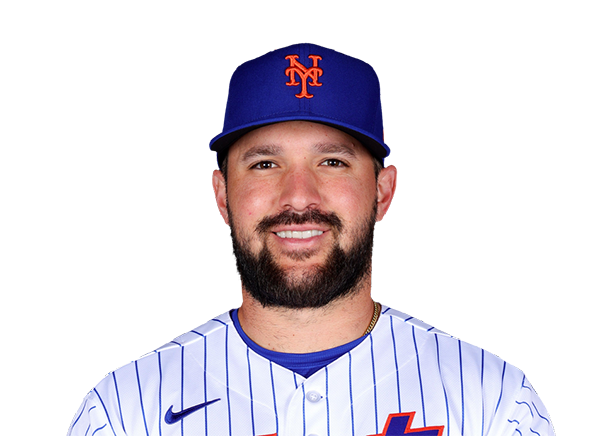 Luis Torrens | 1-4 | 4 | 1 | 1 | 0 | 0 | 0 | 2 | 12 | .242 | .302 | .410 |
Philadelphia Phillies
| Player | IP | H | R | ER | BB | K | HR | PC-ST | ERA | PC |
|---|---|---|---|---|---|---|---|---|---|---|
 Tim Mayza | 0.1 | 3 | 3 | 3 | 1 | 0 | 0 | 32-19 | 3.46 | 32 |
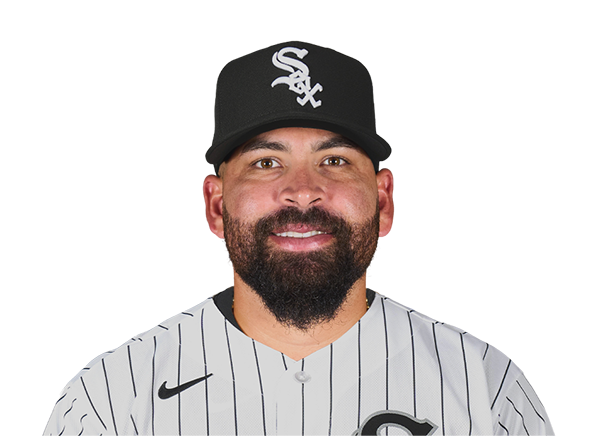 Jose Urquidy | 4.2 | 5 | 0 | 0 | 0 | 6 | 0 | 64-47 | 4.54 | 64 |
 Orion Kerkering | 1.0 | 3 | 3 | 3 | 0 | 2 | 1 | 18-14 | 4.42 | 18 |
 Tanner Banks | 2.0 | 2 | 0 | 0 | 1 | 0 | 0 | 37-21 | 6.82 | 37 |
New York Mets
| Player | IP | H | R | ER | BB | K | HR | PC-ST | ERA | PC |
|---|---|---|---|---|---|---|---|---|---|---|
 Zac Thornton | 6.0 | 5 | 2 | 2 | 1 | 4 | 1 | 87-59 | 3.40 | 87 |
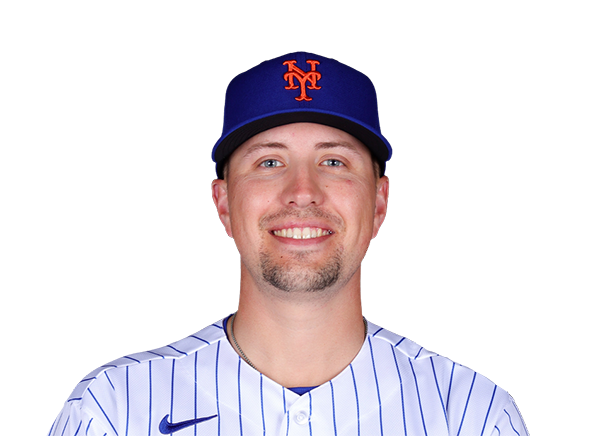 Nate Lavender | 1.2 | 1 | 1 | 1 | 0 | 1 | 1 | 18-14 | 1.93 | 18 |
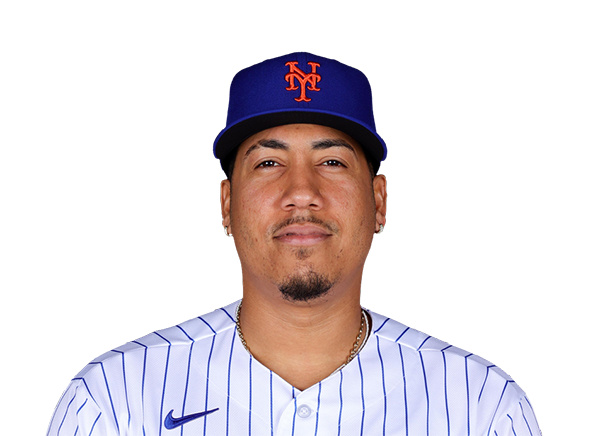 Dedniel Nunez | 1.1 | 0 | 0 | 0 | 0 | 0 | 0 | 11-7 | 3.94 | 11 |
H2H / Season Series
NYM6–3
PHI
NYM0–3
PHI
PHI1–6
NYM
PHI6–1
NYM
PHI1–4
NYM
NYM4–5
PHI
NYM6–2
PHI
NYM1–2
PHI
PHI6–2
NYM
PHI15–3
NYM
Last 5 Games
| Date | Opponent | Result |
|---|---|---|
| Sep 18 | @ NYM | L3–6 |
| Sep 17 | @ NYM | W3–0 |
| Sep 16 |  @ WSH | W3–0 |
| Sep 15 | @ WSH | L3–6 |
| Sep 13 |  @ ATL | W9–4 |
| Date | Opponent | Result |
|---|---|---|
| Sep 18 | vs PHI | W6–3 |
| Sep 17 | vs PHI | L0–3 |
| Sep 16 |  vs BAL | L1–7 |
| Sep 15 | vs BAL | L5–7 |
| Sep 14 | vs BAL | L1–2 |
Standings
American League
| Team | W | L | PCT | GB | DIFF | STRK |
|---|---|---|---|---|---|---|
1 Rays | 93 | 60 | .608 | - | +78 | L1 |
2 Guardians | 79 | 75 | .513 | 14.5 | -5 | W3 |
3 Astros | 77 | 77 | .500 | 16.5 | -54 | L1 |
4 Yankees | 89 | 64 | .582 | 4 | +143 | W1 |
5 Red Sox | 84 | 70 | .545 | 9.5 | +85 | W2 |
6 White Sox | 78 | 76 | .506 | 15.5 | +33 | L1 |
7 Rangers | 77 | 77 | .500 | 16.5 | -33 | W1 |
8 Blue Jays | 76 | 78 | .494 | 17.5 | -43 | L1 |
| 9Orioles | 75 | 79 | .487 | 18.5 | -27 | L1 |
10 Tigers | 73 | 81 | .474 | 20.5 | +77 | W1 |
11 Mariners | 72 | 82 | .468 | 21.5 | -55 | W2 |
12 Twins | 72 | 82 | .468 | 21.5 | -71 | W1 |
13 Royals | 67 | 87 | .435 | 26.5 | -100 | L2 |
14 Athletics | 61 | 93 | .396 | 32.5 | -216 | L4 |
15 Angels | 59 | 95 | .383 | 34.5 | -80 | L1 |
National League
| Team | W | L | PCT | GB | DIFF | STRK |
|---|---|---|---|---|---|---|
1 Brewers | 96 | 58 | .623 | - | +198 | W1 |
2 Dodgers | 94 | 60 | .610 | 2 | +185 | W2 |
| 3Braves | 90 | 64 | .584 | 6 | +115 | W1 |
| 4Phillies | 85 | 69 | .552 | 11 | +31 | L1 |
5 Cubs | 85 | 69 | .552 | 11 | +141 | L1 |
6 Padres | 85 | 69 | .552 | 11 | +36 | W3 |
7 Diamondbacks | 80 | 74 | .519 | 16 | -7 | L3 |
8 Pirates | 77 | 77 | .500 | 19 | +27 | W2 |
9 Marlins | 76 | 78 | .494 | 20 | +2 | L1 |
10 Cardinals | 75 | 79 | .487 | 21 | -22 | L3 |
| 11Nationals | 72 | 82 | .468 | 24 | +11 | W1 |
12 Reds | 72 | 82 | .468 | 24 | -152 | W1 |
| 13Mets | 70 | 84 | .455 | 26 | -43 | W1 |
14 Giants | 64 | 90 | .416 | 32 | -76 | L1 |
15 Rockies | 56 | 98 | .364 | 40 | -178 | L3 |
PHI
VS
NYM
Pitchers
Tim Mayza
Catchers
J.T. Realmuto
Infielders
Trea Turner
Luis Arraez
Alec Bohm
Bryson Stott
Outfielders
Bryce Harper
Edmundo Sosa
Derek Hill
Designated Hitters
Kyle Schwarber
Pitchers
Zac Thornton
Catchers
Luis Torrens
Infielders
Francisco Lindor
Bo Bichette
Marcus Semien
Brett Baty
Outfielders
Juan Soto
Carson Benge
A.J. Ewing
Designated Hitters
Mark Vientos
Phillies
VS
Mets
Batting
154
Team Games Played
154
5156
At Bats
5195
1244
Hits
1237
667
Runs Batted In
627
179
Home Runs
191
101
Stolen Bases
82
.241
Batting Average
.238
687
Runs
656
229
Doubles
197
22
Triples
18
2054
Total Bases
2043
493
Walks
497
1261
Strikeouts
1296
.312
On Base Percentage
.309
.398
Slugging Percentage
.393
.710
OBP Pct + SLG Pct
.702
154
Games Played
154
154
Games Started
154
59
Hit By Pitch
48
0.0
Wins Above Replacement
0.0
0.0
Offensive Wins Above Replacement
0.0
19
Caught Stealing
33
1
Is Qualified
1
654.0
Runs Created
635.2
4.3
Runs Created Per 27 Outs
4.1
.085
Walks Per Plate Appearance
.086
0.39
Walk To Strikeout Ratio
0.38
.157
Isolated Power
.155
.269
Secondary Average
.260
3.89
Pitches Per Plate Appearance
3.93
430
Extra Base Hits
406
5777
Plate Appearances
5797
28.8
At Bats Per Home Run
27.2
14
Sacrifice Hit
18
52
Sacrifice Flies
35
Pitching
154
Team Games Played
154
71
Quality Starts
46
85
Wins
70
69
Losses
84
41
Saves
30
72
Holds
70
1291
Hits
1254
604
Earned runs
634
181
Home Runs
179
461
Walks
524
1492
Strikeouts
1377
9.8
Strikeouts Per 9 Innings
9.0
148.1
Pitches Per Start
147.8
1.28
Walks Plus Hits Per Inning Pitched
1.30
3.98
Earned Run Average
4.16
69
Losses
84
1367.1
Innings pitched
1372.2
.552
Win Percentage
.455
64
Save Opportunities
49
.247
Opponent Batting Average
.241
.314
Opponent's On-base pct.
.317
.401
Opponent's Slugging pct.
.400
.715
Opponent's OPB Pct + SLG Pct
.718
5229
At Bats
5209
215
Doubles
249
24
Triples
23
68
Batters Hit
75
85
Stolen Bases
65
154
Games Played
154
2
Complete Games
0
19
Shutouts
5
39
Wild Pitches
35
622
Runs Batted In
671
3
Balks
3
1367.1
Innings pitched
1372.2
9.8
Strikeouts Per 9 Innings
9.0
36
Caught Stealing
30
154
Games Started
154
0.0
Wins Above Replacement
0.0
1
Is Qualified
1
656
Runs
699
604
Earned Runs
634
2097
Total Bases
2086
Fielding
154
Team Games Played
154
1367
Full Innings
1373
5457
Total Chances
5398
4102
Putouts
4118
1278
Assists
1189
77
Errors
91
229
Double Plays
197
0.986
Fielding Percentage
0.983
35.4
Range Factor
34.8
0.0
Zone Rating
0.0
154
Games Played
154
0
Games Started
0
0.0
Defensive Wins Above Replacement
0.0
1
Qualified
1