

Phillies vs Nationals Live Score (15 Sep, 2026)
Game Information
Stage
STD
Season
2026
First Pitch
Tue, Sep 15, 6:45 pm
Venue
Nationals Park
Location
Washington, District of Columbia
Venue Type
Outdoor
Broadcast
MLB.TV
Attendance
23,952
Live Situation
3Balls
2Strikes
0Outs
—Pitcher
—At Bat
Pitch Sequence
1
BALL
Slider
86 MPH
2
BALL
Four-seam FB
95 MPH
3
STRIKE LOOKING
Four-seam FB
96 MPH
4
BALL
Four-seam FB
95 MPH
5
STRIKE FOUL
Four-seam FB
96 MPH
6
BALL IN PLAY
Four-seam FB
96 MPH
Injury Report





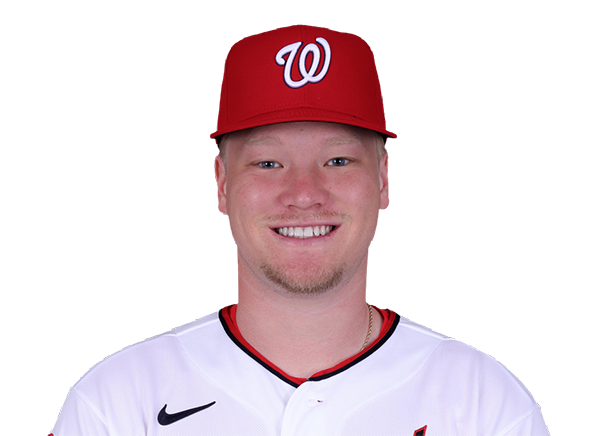
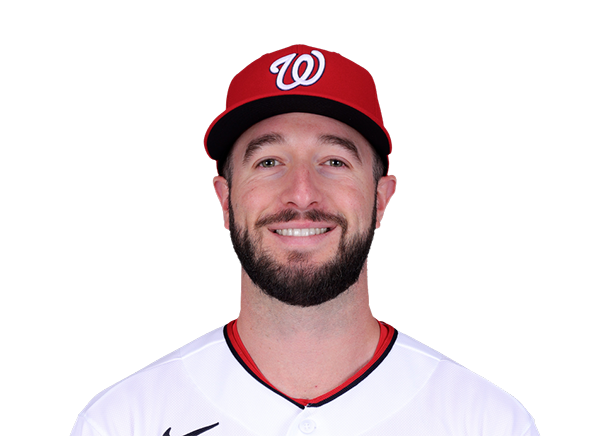

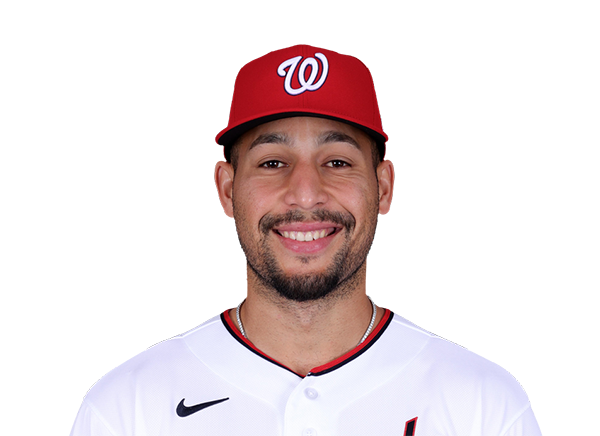
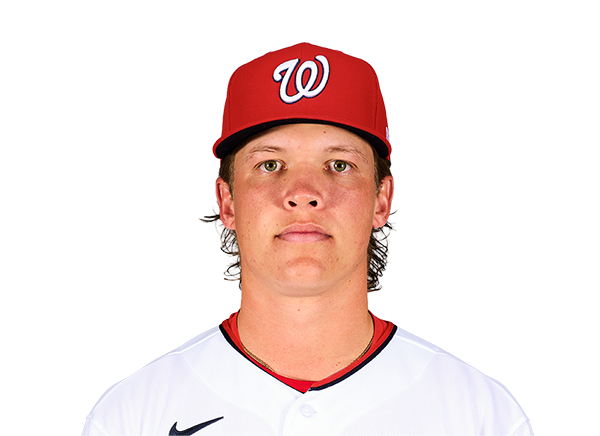
Team Stats
 PHI
WSH


3
Runs
6
5
Hits
9
0
Errors
0
1
Home Runs
2
3
Walks
2
5
Strikeouts
8
Player Box Score
Philadelphia Phillies
| Player | H-AB | AB | R | H | RBI | HR | BB | K | #P | AVG | OBP | SLG |
|---|---|---|---|---|---|---|---|---|---|---|---|---|
 Kyle Schwarber | 1-3 | 3 | 2 | 1 | 1 | 1 | 1 | 0 | 23 | .239 | .353 | .522 |
 Trea Turner | 1-4 | 4 | 1 | 1 | 0 | 0 | 0 | 0 | 18 | .241 | .293 | .384 |
 Bryce Harper | 0-4 | 4 | 0 | 0 | 0 | 0 | 0 | 1 | 9 | .270 | .384 | .497 |
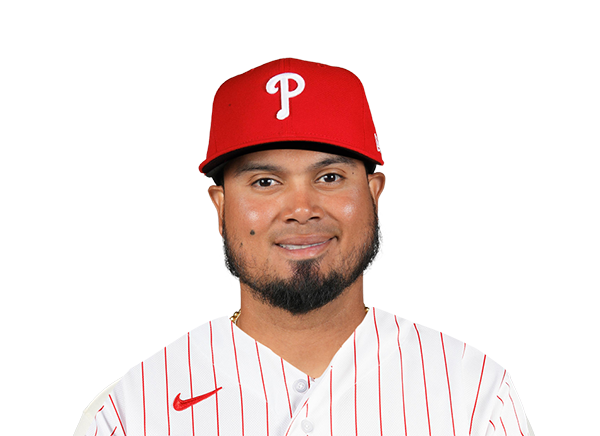 Luis Arraez | 2-3 | 3 | 0 | 2 | 1 | 0 | 1 | 0 | 15 | .315 | .348 | .428 |
 Alec Bohm | 1-3 | 3 | 0 | 1 | 1 | 0 | 1 | 0 | 17 | .248 | .310 | .390 |
 Bryan De La Cruz | 0-4 | 4 | 0 | 0 | 0 | 0 | 0 | 1 | 15 | .303 | .351 | .439 |
 Bryson Stott | 0-4 | 4 | 0 | 0 | 0 | 0 | 0 | 1 | 13 | .248 | .324 | .389 |
 J.T. Realmuto | 0-4 | 4 | 0 | 0 | 0 | 0 | 0 | 1 | 16 | .220 | .294 | .354 |
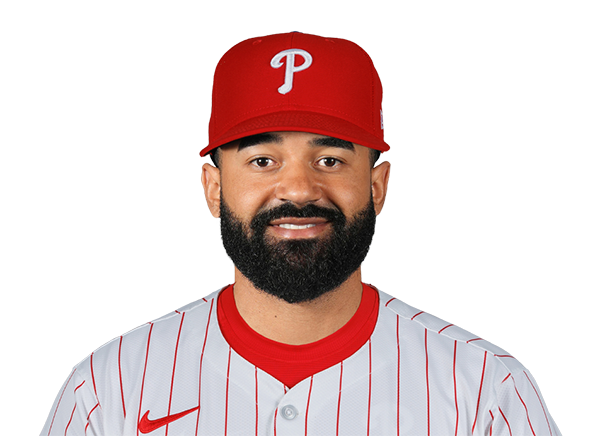 Derek Hill | 0-3 | 3 | 0 | 0 | 0 | 0 | 0 | 1 | 16 | .245 | .296 | .438 |
Washington Nationals
| Player | H-AB | AB | R | H | RBI | HR | BB | K | #P | AVG | OBP | SLG |
|---|---|---|---|---|---|---|---|---|---|---|---|---|
 Dylan Crews | 0-3 | 3 | 0 | 0 | 0 | 0 | 0 | 0 | 7 | .221 | .289 | .369 |
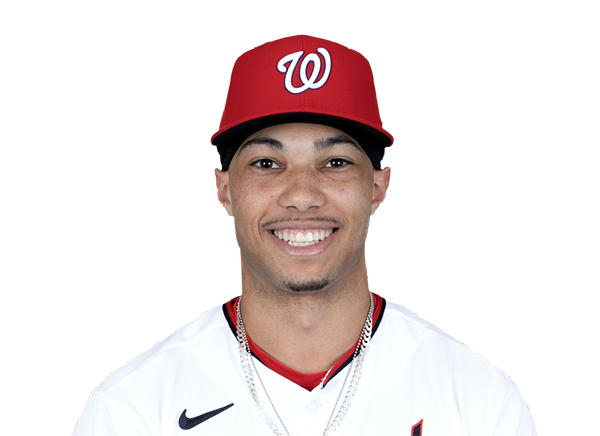 Daylen Lile | 1-1 | 1 | 1 | 1 | 3 | 1 | 0 | 0 | 1 | .250 | .302 | .437 |
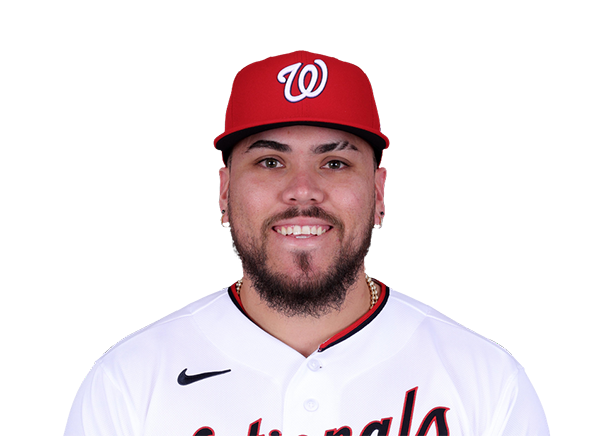 Andres Chaparro | 2-3 | 3 | 1 | 2 | 1 | 1 | 0 | 0 | 13 | .258 | .356 | .517 |
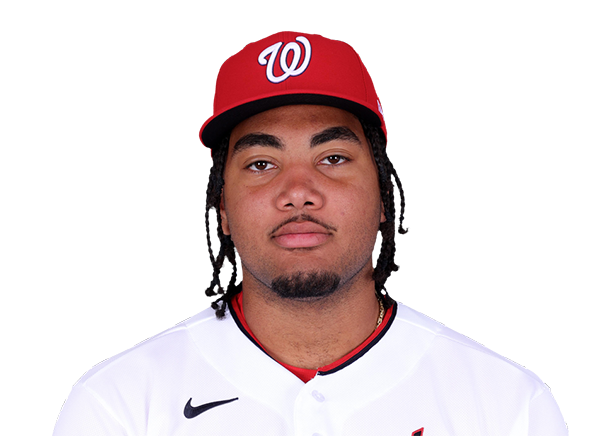 James Wood | 0-1 | 1 | 0 | 0 | 0 | 0 | 0 | 1 | 5 | .267 | .394 | .522 |
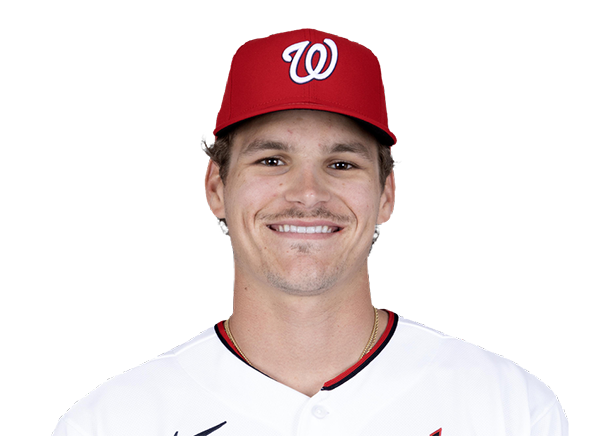 Brady House | 1-3 | 3 | 1 | 1 | 0 | 0 | 1 | 1 | 12 | .240 | .303 | .395 |
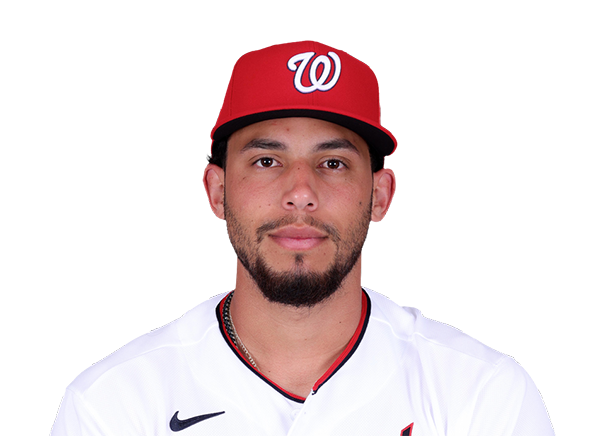 Yohandy Morales | 1-3 | 3 | 1 | 1 | 1 | 0 | 0 | 1 | 13 | .300 | .300 | .600 |
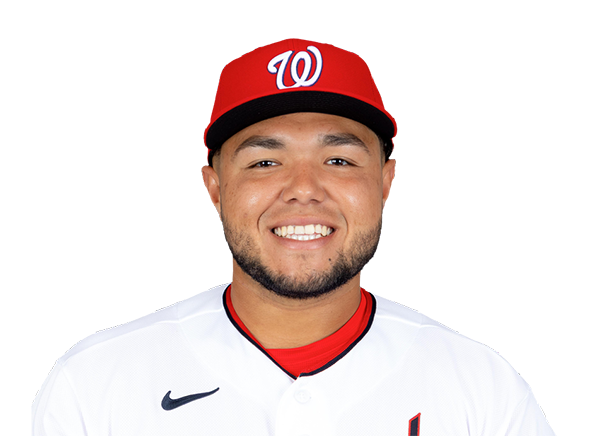 Abimelec Ortiz | 0-1 | 1 | 0 | 0 | 0 | 0 | 0 | 0 | 4 | .211 | .250 | .386 |
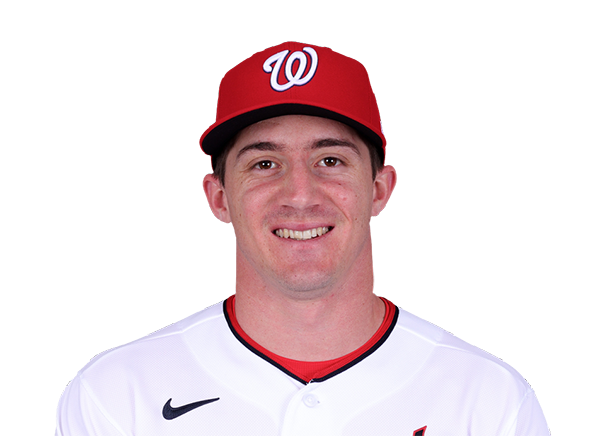 Jacob Young | 0-3 | 3 | 0 | 0 | 0 | 0 | 0 | 0 | 8 | .247 | .315 | .387 |
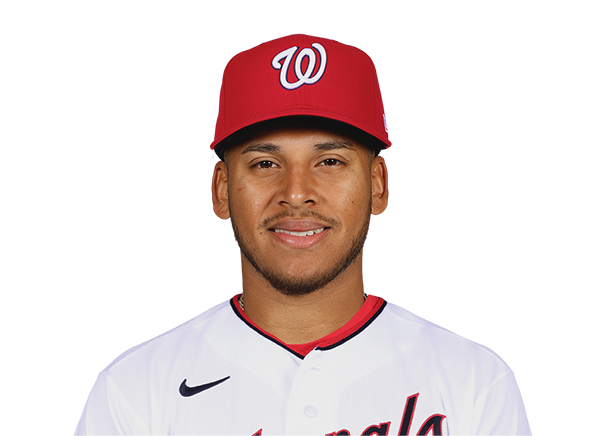 Jorbit Vivas | 1-4 | 4 | 0 | 1 | 1 | 0 | 0 | 2 | 14 | .244 | .336 | .334 |
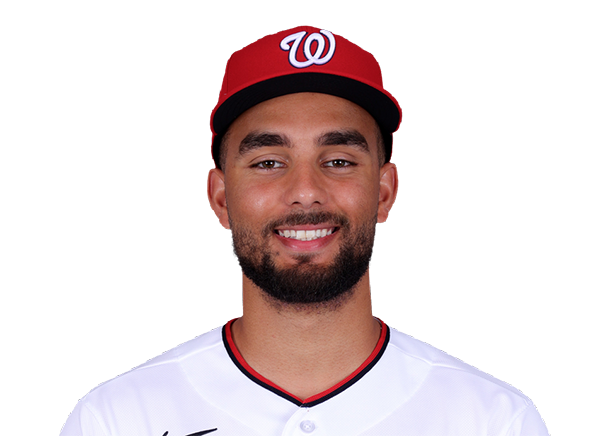 Harry Ford | 1-3 | 3 | 1 | 1 | 0 | 0 | 0 | 1 | 16 | .191 | .308 | .360 |
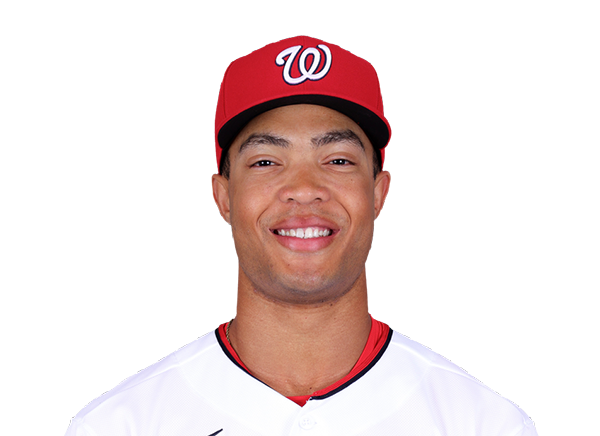 Andrew Pinckney | 1-3 | 3 | 1 | 1 | 0 | 0 | 0 | 2 | 13 | .280 | .310 | .480 |
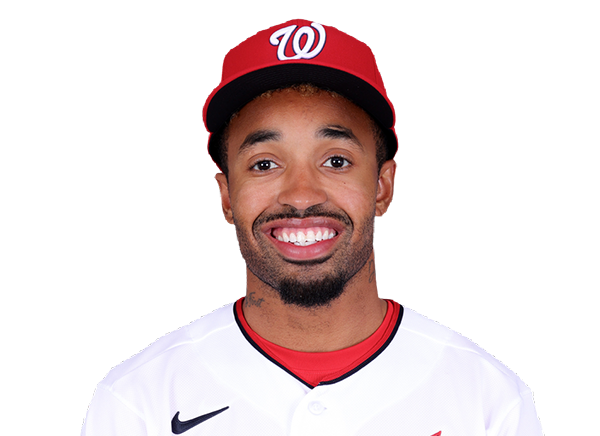 Nasim Nunez | 1-1 | 1 | 0 | 1 | 0 | 0 | 1 | 0 | 12 | .212 | .293 | .246 |
Philadelphia Phillies
| Player | IP | H | R | ER | BB | K | HR | PC-ST | ERA | PC |
|---|---|---|---|---|---|---|---|---|---|---|
 Cristopher Sanchez | 6.1 | 8 | 5 | 5 | 2 | 5 | 1 | 98-57 | 2.93 | 98 |
 Jonathan Bowlan | 0.2 | 1 | 1 | 1 | 0 | 2 | 1 | 11-7 | 3.40 | 11 |
 Chase Shugart | 1.0 | 0 | 0 | 0 | 0 | 1 | 0 | 9-7 | 4.17 | 9 |
Washington Nationals
| Player | IP | H | R | ER | BB | K | HR | PC-ST | ERA | PC |
|---|---|---|---|---|---|---|---|---|---|---|
 Jackson Kent | 5.0 | 4 | 3 | 3 | 3 | 4 | 1 | 88-58 | 6.40 | 88 |
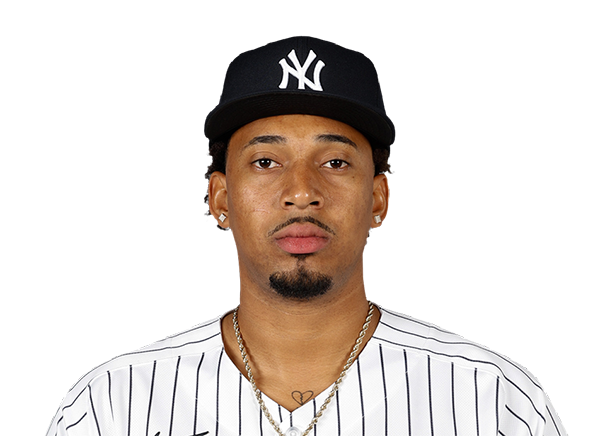 Yovanny Cruz | 1.2 | 0 | 0 | 0 | 0 | 0 | 0 | 18-11 | 4.50 | 18 |
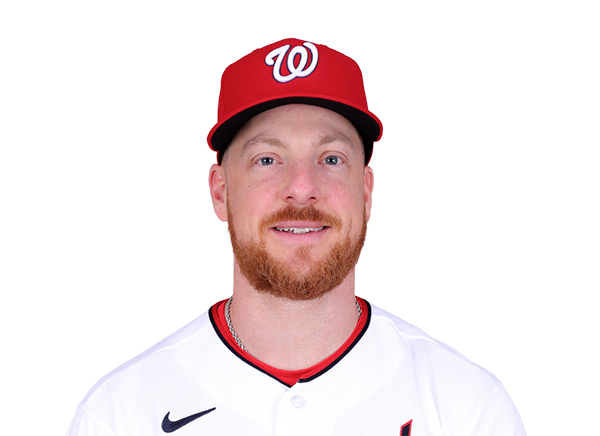 Richard Lovelady | 1.0 | 1 | 0 | 0 | 0 | 1 | 0 | 17-10 | 3.73 | 17 |
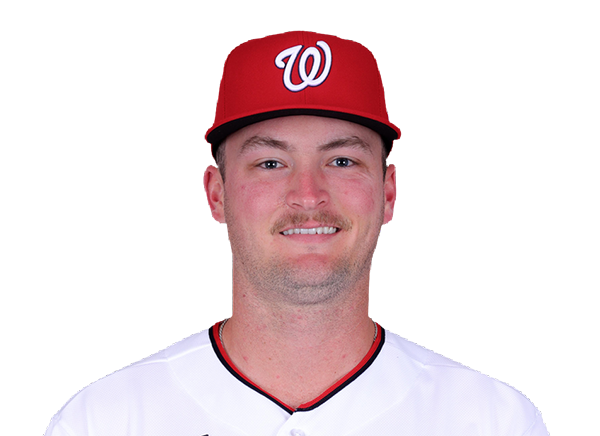 Brad Lord | 0.1 | 0 | 0 | 0 | 0 | 0 | 0 | 6-3 | 4.04 | 6 |
|
Erik Tolman | 1.0 | 0 | 0 | 0 | 0 | 0 | 0 | 13-8 | 2.38 | 13 |
H2H / Season Series
WSH6–3
PHI
PHI7–3
WSH
PHI4–10
WSH
PHI5–0
WSH
PHI6–3
WSH
WSH5–10
PHI
WSH4–5
PHI
WSH9–14
PHI
WSH4–1
PHI
PHI6–5
WSH
Last 5 Games
| Date | Opponent | Result |
|---|---|---|
| Sep 15 | @ WSH | L3–6 |
| Sep 13 |  @ ATL | W9–4 |
| Sep 12 | @ ATL | L2–12 |
| Sep 11 | @ ATL | L5–6 |
| Sep 10 |  vs HOU | L1–2 |
| Date | Opponent | Result |
|---|---|---|
| Sep 15 | vs PHI | W6–3 |
| Sep 13 |  vs LAA | W6–5 |
| Sep 12 | vs LAA | W6–5 |
| Sep 11 | vs LAA | W4–3 |
| Sep 9 |  @ SD | L2–9 |
Standings
American League
| Team | W | L | PCT | GB | DIFF | STRK |
|---|---|---|---|---|---|---|
1 Rays | 91 | 59 | .607 | - | +70 | W4 |
2 White Sox | 77 | 74 | .510 | 14.5 | +37 | L1 |
| 3Astros | 76 | 75 | .503 | 15.5 | -51 | W1 |
4 Yankees | 88 | 63 | .583 | 3.5 | +137 | W3 |
5 Red Sox | 82 | 69 | .543 | 9.5 | +86 | L1 |
6 Guardians | 77 | 75 | .507 | 15 | -10 | W1 |
7 Rangers | 75 | 76 | .497 | 16.5 | -42 | W3 |
8 Blue Jays | 75 | 77 | .493 | 17 | -41 | L2 |
9 Orioles | 74 | 78 | .487 | 18 | -32 | W2 |
10 Tigers | 72 | 79 | .477 | 19.5 | +80 | W6 |
11 Twins | 70 | 81 | .464 | 21.5 | -74 | L3 |
12 Mariners | 70 | 82 | .461 | 22 | -61 | L3 |
13 Royals | 66 | 85 | .437 | 25.5 | -96 | L3 |
14 Athletics | 61 | 90 | .404 | 30.5 | -204 | L1 |
| 15Angels | 58 | 93 | .384 | 33.5 | -73 | W2 |
National League
| Team | W | L | PCT | GB | DIFF | STRK |
|---|---|---|---|---|---|---|
1 Brewers | 94 | 57 | .623 | - | +199 | W1 |
2 Dodgers | 92 | 59 | .609 | 2 | +177 | W2 |
| 3Braves | 89 | 63 | .586 | 5.5 | +115 | W1 |
4 Cubs | 84 | 68 | .553 | 10.5 | +139 | L1 |
| 5Phillies | 83 | 68 | .550 | 11 | +28 | L1 |
| 6Padres | 82 | 69 | .543 | 12 | +17 | L1 |
7 Diamondbacks | 80 | 72 | .526 | 14.5 | +1 | L1 |
8 Pirates | 75 | 76 | .497 | 19 | +22 | L1 |
9 Marlins | 75 | 77 | .493 | 19.5 | +7 | W1 |
10 Cardinals | 75 | 77 | .493 | 19.5 | -13 | L1 |
| 11Nationals | 71 | 81 | .467 | 23.5 | +6 | W4 |
12 Reds | 70 | 81 | .464 | 24 | -152 | L2 |
13 Mets | 69 | 82 | .457 | 25 | -37 | L3 |
14 Giants | 63 | 89 | .414 | 31.5 | -71 | W1 |
15 Rockies | 56 | 95 | .371 | 38 | -164 | W1 |
PHI
VS
WSH
Pitchers
Cristopher Sanchez
Catchers
J.T. Realmuto
Infielders
Trea Turner
Luis Arraez
Alec Bohm
Bryson Stott
Outfielders
Bryce Harper
Bryan De La Cruz
Derek Hill
Designated Hitters
Kyle Schwarber
Pitchers
Jackson Kent
Catchers
Harry Ford
Infielders
Brady House
Yohandy Morales
Jorbit Vivas
Nasim Nunez
Outfielders
Dylan Crews
Jacob Young
Andrew Pinckney
Designated Hitters
Andres Chaparro
Phillies
VS
Nationals
Batting
151
Team Games Played
152
5064
At Bats
5179
1225
Hits
1285
658
Runs Batted In
737
177
Home Runs
200
99
Stolen Bases
166
.242
Batting Average
.248
678
Runs
778
224
Doubles
269
22
Triples
30
2024
Total Bases
2214
474
Walks
526
1243
Strikeouts
1273
.311
On Base Percentage
.324
.400
Slugging Percentage
.427
.711
OBP Pct + SLG Pct
.751
151
Games Played
152
151
Games Started
152
58
Hit By Pitch
68
0.0
Wins Above Replacement
0.0
0.0
Offensive Wins Above Replacement
0.0
19
Caught Stealing
38
1
Is Qualified
1
641.7
Runs Created
742.9
4.3
Runs Created Per 27 Outs
4.9
.084
Walks Per Plate Appearance
.090
0.38
Walk To Strikeout Ratio
0.41
.158
Isolated Power
.179
.267
Secondary Average
.306
3.90
Pitches Per Plate Appearance
3.82
423
Extra Base Hits
499
5660
Plate Appearances
5829
28.6
At Bats Per Home Run
25.9
11
Sacrifice Hit
19
50
Sacrifice Flies
34
Pitching
151
Team Games Played
152
69
Quality Starts
35
83
Wins
71
68
Losses
81
39
Saves
37
69
Holds
74
1270
Hits
1307
598
Earned runs
707
180
Home Runs
204
452
Walks
559
1468
Strikeouts
1190
9.8
Strikeouts Per 9 Innings
8.0
148.4
Pitches Per Start
150.7
1.28
Walks Plus Hits Per Inning Pitched
1.39
4.01
Earned Run Average
4.72
68
Losses
81
1341.1
Innings pitched
1347.0
.550
Win Percentage
.467
62
Save Opportunities
76
.247
Opponent Batting Average
.253
.314
Opponent's On-base pct.
.333
.403
Opponent's Slugging pct.
.423
.718
Opponent's OPB Pct + SLG Pct
.756
5135
At Bats
5157
212
Doubles
239
24
Triples
12
67
Batters Hit
78
85
Stolen Bases
112
151
Games Played
152
2
Complete Games
0
17
Shutouts
5
39
Wild Pitches
58
616
Runs Batted In
741
3
Balks
1
1341.1
Innings pitched
1347.0
9.8
Strikeouts Per 9 Innings
8.0
36
Caught Stealing
33
151
Games Started
152
0.0
Wins Above Replacement
0.0
1
Is Qualified
1
650
Runs
772
598
Earned Runs
707
2070
Total Bases
2182
Fielding
151
Team Games Played
152
1341
Full Innings
1347
5349
Total Chances
5513
4024
Putouts
4041
1248
Assists
1374
77
Errors
98
224
Double Plays
269
0.986
Fielding Percentage
0.982
35.4
Range Factor
36.2
0.0
Zone Rating
0.0
151
Games Played
152
0
Games Started
0
0.0
Defensive Wins Above Replacement
0.0
1
Qualified
1