

Phillies vs Nationals Live Score (16 Sep, 2026)
Game Information
Stage
STD
Season
2026
First Pitch
Wed, Sep 16, 6:45 pm
Venue
Nationals Park
Location
Washington, District of Columbia
Venue Type
Outdoor
Broadcast
MLB.TV
Attendance
23,007
Live Situation
3Balls
3Strikes
0Outs
—Pitcher
—At Bat
Pitch Sequence
1
STRIKE LOOKING
Knuckle Curve
90 MPH
2
BALL
Changeup
88 MPH
3
BALL
Splitter
98 MPH
4
BALL
Splitter
98 MPH
5
STRIKE SWINGING
Four-seam FB
100 MPH
6
STRIKE FOUL
Four-seam FB
101 MPH
7
STRIKE SWINGING
Splitter
99 MPH
Injury Report





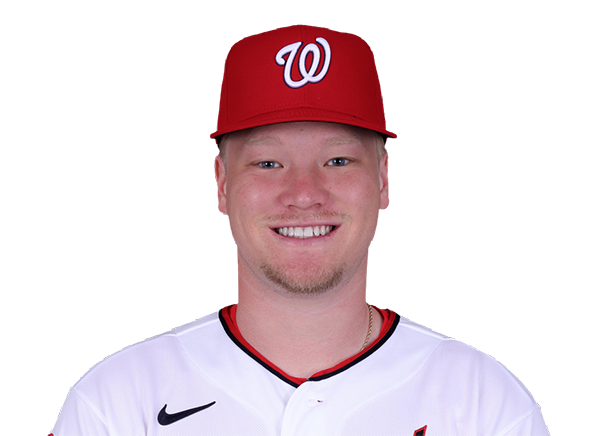
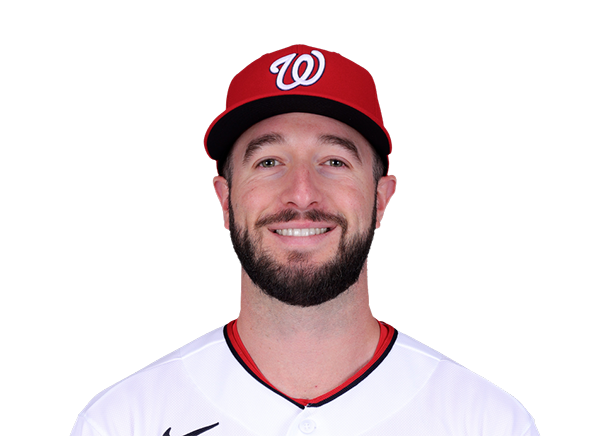
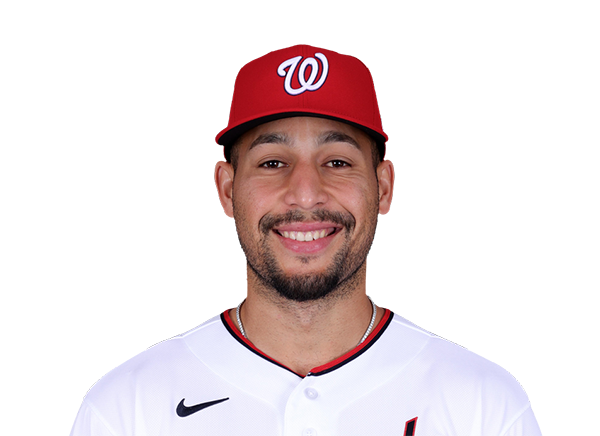
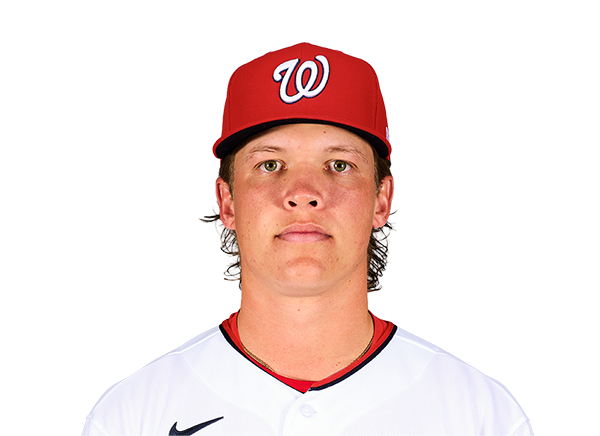
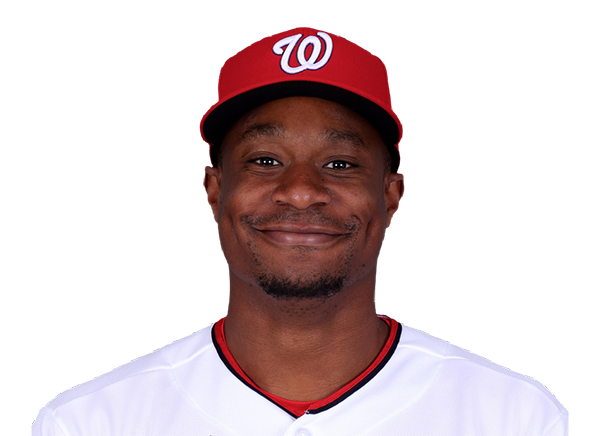
Team Stats
 PHI
WSH


3
Runs
0
5
Hits
4
0
Errors
0
0
Home Runs
0
13
Walks
2
7
Strikeouts
8
Player Box Score
Philadelphia Phillies
| Player | H-AB | AB | R | H | RBI | HR | BB | K | #P | AVG | OBP | SLG |
|---|---|---|---|---|---|---|---|---|---|---|---|---|
 Kyle Schwarber | 0-4 | 4 | 0 | 0 | 0 | 0 | 1 | 2 | 16 | .237 | .352 | .518 |
 Trea Turner | 0-4 | 4 | 1 | 0 | 0 | 0 | 1 | 1 | 17 | .240 | .292 | .382 |
 Bryce Harper | 1-4 | 4 | 2 | 1 | 0 | 0 | 1 | 1 | 14 | .270 | .384 | .495 |
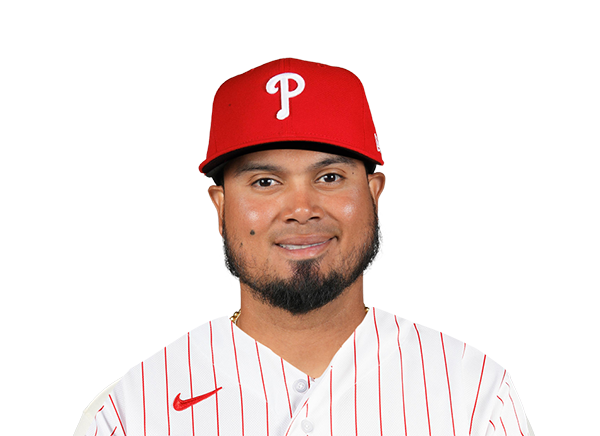 Luis Arraez | 1-2 | 2 | 0 | 1 | 1 | 0 | 3 | 0 | 27 | .316 | .352 | .430 |
 Alec Bohm | 2-2 | 2 | 0 | 2 | 1 | 0 | 3 | 0 | 25 | .251 | .316 | .392 |
 Bryson Stott | 0-3 | 3 | 0 | 0 | 1 | 0 | 2 | 0 | 21 | .247 | .324 | .386 |
 J.T. Realmuto | 0-4 | 4 | 0 | 0 | 0 | 0 | 1 | 2 | 23 | .218 | .293 | .351 |
 Brandon Marsh | 0-4 | 4 | 0 | 0 | 0 | 0 | 0 | 1 | 15 | .261 | .306 | .409 |
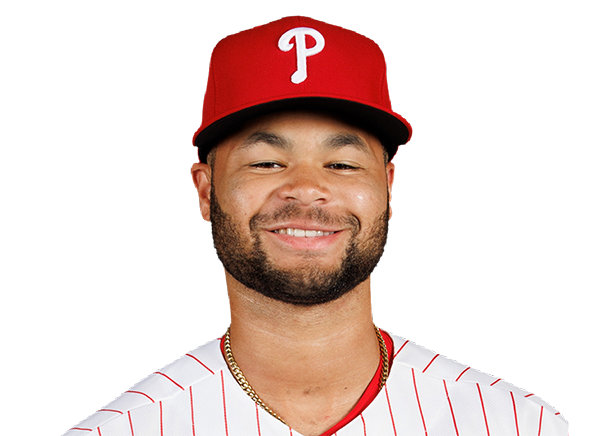 Justin Crawford | 1-3 | 3 | 0 | 1 | 0 | 0 | 1 | 0 | 18 | .266 | .316 | .357 |
Washington Nationals
| Player | H-AB | AB | R | H | RBI | HR | BB | K | #P | AVG | OBP | SLG |
|---|---|---|---|---|---|---|---|---|---|---|---|---|
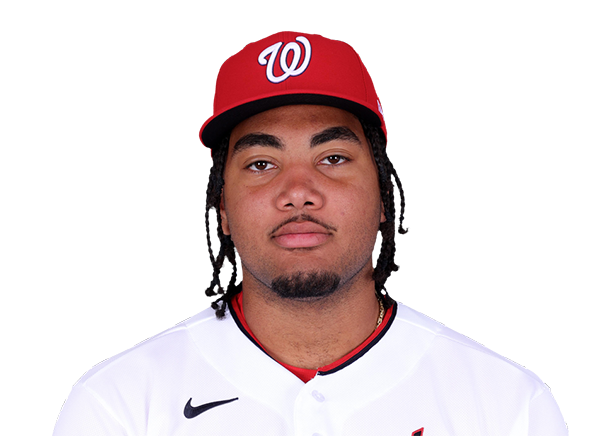 James Wood | 0-4 | 4 | 0 | 0 | 0 | 0 | 0 | 0 | 9 | .265 | .391 | .518 |
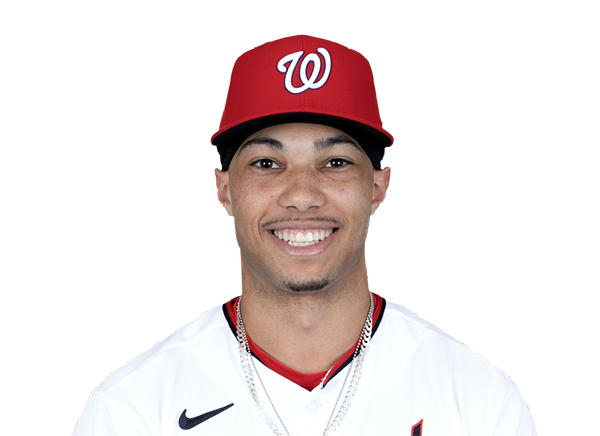 Daylen Lile | 2-4 | 4 | 0 | 2 | 0 | 0 | 0 | 0 | 8 | .251 | .304 | .438 |
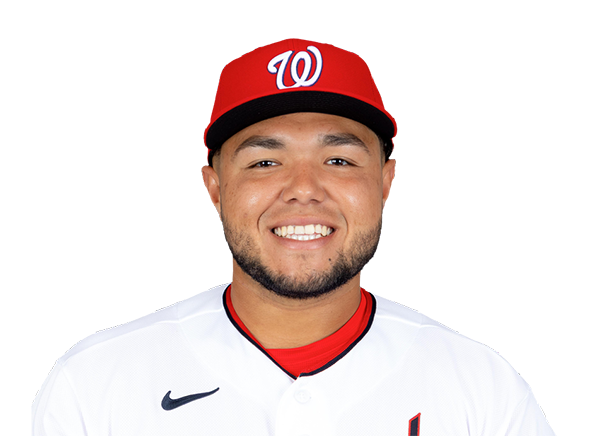 Abimelec Ortiz | 0-3 | 3 | 0 | 0 | 0 | 0 | 1 | 2 | 25 | .205 | .250 | .376 |
 CJ Abrams | 1-4 | 4 | 0 | 1 | 0 | 0 | 0 | 0 | 20 | .264 | .339 | .495 |
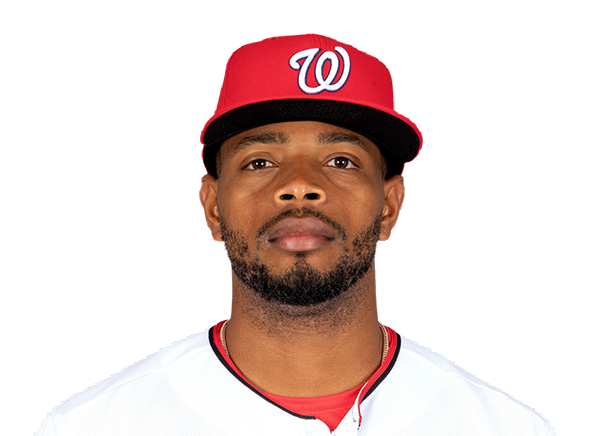 Jose Tena | 0-4 | 4 | 0 | 0 | 0 | 0 | 0 | 3 | 19 | .221 | .303 | .368 |
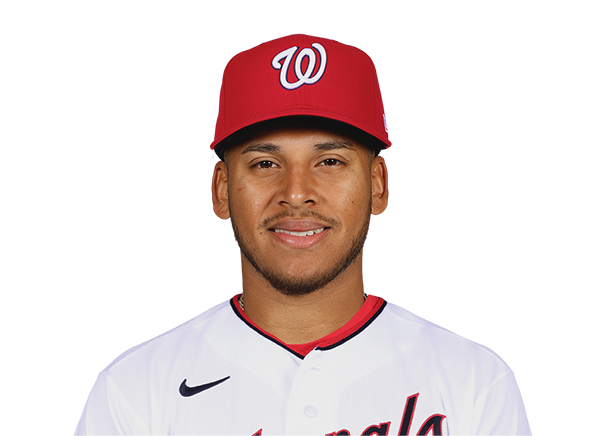 Jorbit Vivas | 0-3 | 3 | 0 | 0 | 0 | 0 | 0 | 1 | 12 | .241 | .333 | .331 |
 Dylan Crews | 1-3 | 3 | 0 | 1 | 0 | 0 | 0 | 1 | 14 | .222 | .290 | .369 |
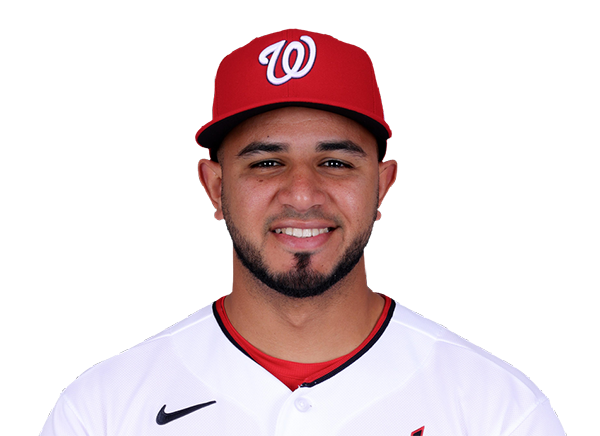 Keibert Ruiz | 0-2 | 2 | 0 | 0 | 0 | 0 | 0 | 0 | 4 | .288 | .325 | .460 |
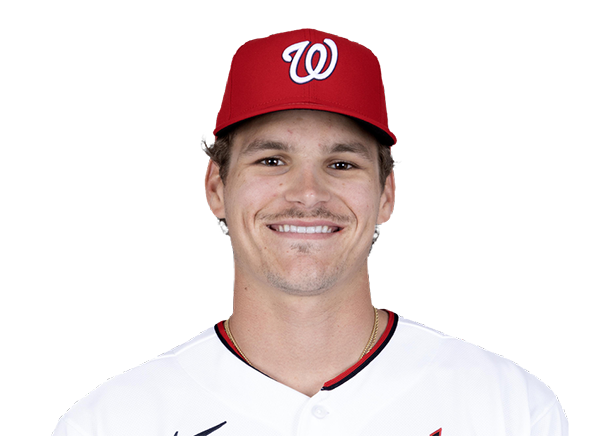 Brady House | 0-1 | 1 | 0 | 0 | 0 | 0 | 0 | 1 | 6 | .239 | .302 | .394 |
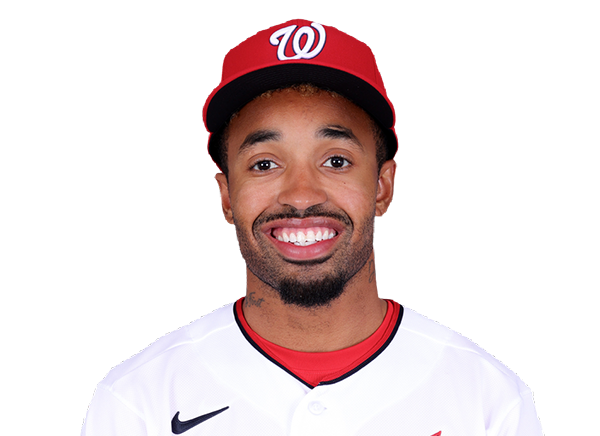 Nasim Nunez | 0-2 | 2 | 0 | 0 | 0 | 0 | 0 | 0 | 6 | .211 | .292 | .245 |
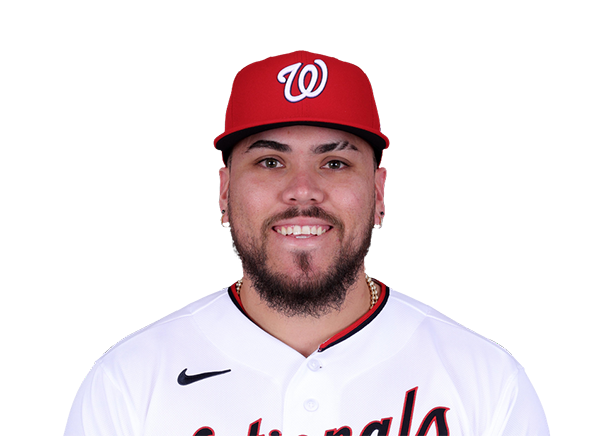 Andres Chaparro | 0-0 | 0 | 0 | 0 | 0 | 0 | 1 | 0 | 5 | .258 | .359 | .517 |
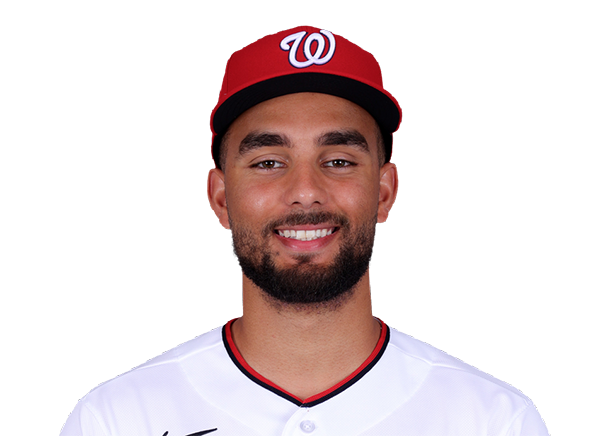 Harry Ford | 0-0 | 0 | 0 | 0 | 0 | 0 | 0 | 0 | 0 | .191 | .308 | .360 |
Philadelphia Phillies
| Player | IP | H | R | ER | BB | K | HR | PC-ST | ERA | PC |
|---|---|---|---|---|---|---|---|---|---|---|
 Zack Wheeler | 7.0 | 4 | 0 | 0 | 1 | 5 | 0 | 91-58 | 2.99 | 91 |
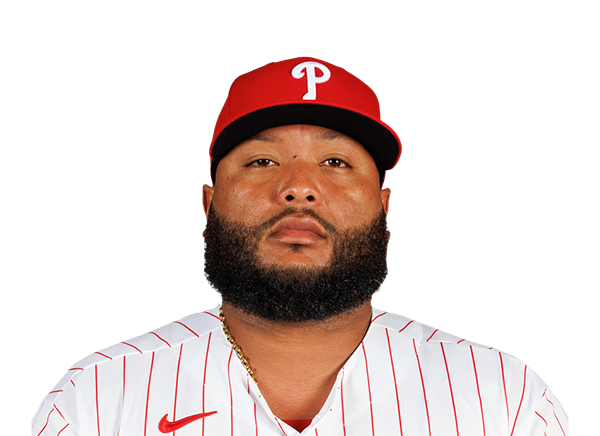 Jose Alvarado | 1.0 | 0 | 0 | 0 | 1 | 1 | 0 | 16-7 | 5.20 | 16 |
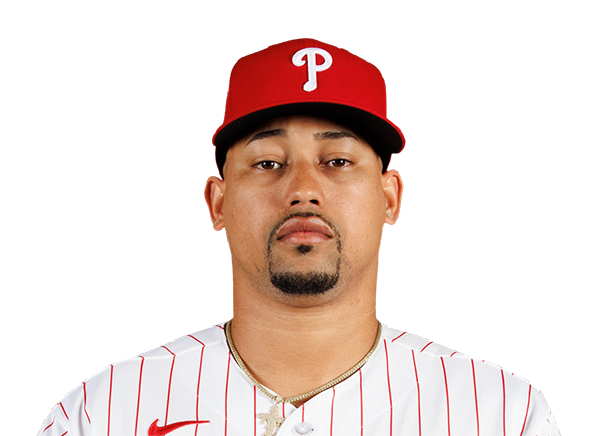 Jhoan Duran | 1.0 | 0 | 0 | 0 | 0 | 2 | 0 | 21-13 | 1.79 | 21 |
Washington Nationals
| Player | IP | H | R | ER | BB | K | HR | PC-ST | ERA | PC |
|---|---|---|---|---|---|---|---|---|---|---|
 Jared Simpson | 0.1 | 1 | 2 | 2 | 4 | 0 | 0 | 26-10 | 10.38 | 26 |
 Riley Cornelio | 2.2 | 0 | 0 | 0 | 2 | 1 | 0 | 34-18 | 4.45 | 34 |
 Will Dion | 2.2 | 2 | 0 | 0 | 1 | 3 | 0 | 45-28 | 3.92 | 45 |
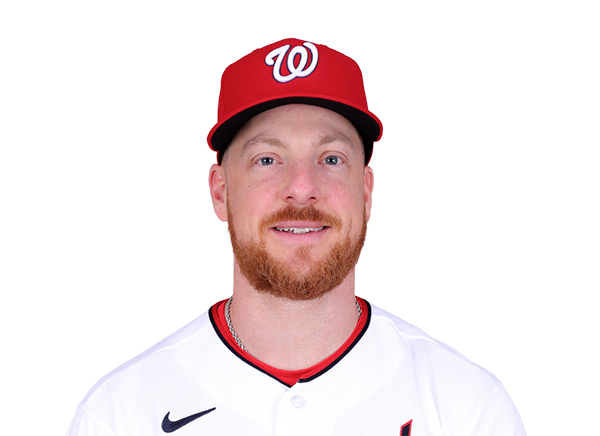 Richard Lovelady | 0.2 | 2 | 1 | 1 | 0 | 1 | 0 | 13-11 | 3.94 | 13 |
 Luis Perales | 2.0 | 0 | 0 | 0 | 5 | 2 | 0 | 49-25 | 9.00 | 49 |
 Yovanny Cruz | 0.2 | 0 | 0 | 0 | 1 | 0 | 0 | 9-5 | 4.26 | 9 |
H2H / Season Series
WSH0–3
PHI
WSH6–3
PHI
PHI7–3
WSH
PHI4–10
WSH
PHI5–0
WSH
PHI6–3
WSH
WSH5–10
PHI
WSH4–5
PHI
WSH9–14
PHI
WSH4–1
PHI
Last 5 Games
| Date | Opponent | Result |
|---|---|---|
| Sep 16 | @ WSH | W3–0 |
| Sep 15 | @ WSH | L3–6 |
| Sep 13 |  @ ATL | W9–4 |
| Sep 12 | @ ATL | L2–12 |
| Sep 11 | @ ATL | L5–6 |
| Date | Opponent | Result |
|---|---|---|
| Sep 16 | vs PHI | L0–3 |
| Sep 15 | vs PHI | W6–3 |
| Sep 13 |  vs LAA | W6–5 |
| Sep 12 | vs LAA | W6–5 |
| Sep 11 | vs LAA | W4–3 |
Standings
American League
| Team | W | L | PCT | GB | DIFF | STRK |
|---|---|---|---|---|---|---|
1 Rays | 92 | 59 | .609 | - | +71 | W5 |
2 Guardians | 78 | 75 | .510 | 15 | -7 | W2 |
3 Astros | 76 | 76 | .500 | 16.5 | -54 | L1 |
4 Yankees | 88 | 64 | .579 | 4.5 | +136 | L1 |
5 Red Sox | 82 | 70 | .539 | 10.5 | +82 | L2 |
6 White Sox | 77 | 75 | .507 | 15.5 | +34 | L2 |
7 Rangers | 76 | 76 | .500 | 16.5 | -38 | W4 |
8 Blue Jays | 76 | 77 | .497 | 17 | -37 | W1 |
9 Orioles | 75 | 78 | .490 | 18 | -26 | W3 |
10 Tigers | 72 | 80 | .474 | 20.5 | +76 | L1 |
11 Twins | 71 | 81 | .467 | 21.5 | -73 | W1 |
12 Mariners | 71 | 82 | .464 | 22 | -56 | W1 |
13 Royals | 67 | 85 | .441 | 25.5 | -93 | W1 |
14 Athletics | 61 | 91 | .401 | 31.5 | -205 | L2 |
| 15Angels | 58 | 94 | .382 | 34.5 | -78 | L1 |
National League
| Team | W | L | PCT | GB | DIFF | STRK |
|---|---|---|---|---|---|---|
1 Brewers | 95 | 57 | .625 | - | +200 | W2 |
2 Dodgers | 92 | 60 | .605 | 3 | +173 | L1 |
| 3Braves | 89 | 64 | .582 | 6.5 | +111 | L1 |
4 Cubs | 85 | 68 | .556 | 10.5 | +143 | W1 |
| 5Phillies | 84 | 68 | .553 | 11 | +31 | W1 |
6 Padres | 83 | 69 | .546 | 12 | +23 | W1 |
7 Diamondbacks | 80 | 73 | .523 | 15.5 | 0 | L2 |
8 Marlins | 76 | 77 | .497 | 19.5 | +8 | W2 |
9 Pirates | 75 | 77 | .493 | 20 | +21 | L2 |
10 Cardinals | 75 | 78 | .490 | 20.5 | -14 | L2 |
11 Reds | 71 | 81 | .467 | 24 | -148 | W1 |
| 12Nationals | 71 | 82 | .464 | 24.5 | +3 | L1 |
13 Mets | 69 | 83 | .454 | 26 | -43 | L4 |
14 Giants | 64 | 89 | .418 | 31.5 | -70 | W2 |
15 Rockies | 56 | 96 | .368 | 39 | -170 | L1 |
PHI
VS
WSH
Pitchers
Zack Wheeler
Catchers
J.T. Realmuto
Infielders
Trea Turner
Luis Arraez
Alec Bohm
Bryson Stott
Outfielders
Bryce Harper
Brandon Marsh
Justin Crawford
Designated Hitters
Kyle Schwarber
Pitchers
Jared Simpson
Catchers
Keibert Ruiz
Infielders
Abimelec Ortiz
CJ Abrams
Jorbit Vivas
Nasim Nunez
Outfielders
James Wood
Daylen Lile
Dylan Crews
Designated Hitters
Jose Tena
Phillies
VS
Nationals
Batting
152
Team Games Played
153
5094
At Bats
5209
1230
Hits
1289
661
Runs Batted In
737
177
Home Runs
200
101
Stolen Bases
166
.241
Batting Average
.247
681
Runs
778
226
Doubles
270
22
Triples
30
2031
Total Bases
2219
487
Walks
528
1250
Strikeouts
1281
.312
On Base Percentage
.323
.399
Slugging Percentage
.426
.711
OBP Pct + SLG Pct
.749
152
Games Played
153
152
Games Started
153
58
Hit By Pitch
68
0.0
Wins Above Replacement
0.0
0.0
Offensive Wins Above Replacement
0.0
19
Caught Stealing
38
1
Is Qualified
1
646.7
Runs Created
742.7
4.3
Runs Created Per 27 Outs
4.9
.085
Walks Per Plate Appearance
.090
0.39
Walk To Strikeout Ratio
0.41
.157
Isolated Power
.179
.269
Secondary Average
.304
3.90
Pitches Per Plate Appearance
3.82
425
Extra Base Hits
500
5703
Plate Appearances
5861
28.8
At Bats Per Home Run
26.0
11
Sacrifice Hit
19
50
Sacrifice Flies
34
Pitching
152
Team Games Played
153
70
Quality Starts
35
84
Wins
71
68
Losses
82
40
Saves
37
70
Holds
74
1274
Hits
1312
598
Earned runs
710
180
Home Runs
204
454
Walks
572
1476
Strikeouts
1197
9.8
Strikeouts Per 9 Innings
7.9
148.3
Pitches Per Start
150.9
1.28
Walks Plus Hits Per Inning Pitched
1.39
3.99
Earned Run Average
4.71
68
Losses
82
1350.1
Innings pitched
1356.0
.553
Win Percentage
.464
63
Save Opportunities
76
.247
Opponent Batting Average
.253
.314
Opponent's On-base pct.
.333
.402
Opponent's Slugging pct.
.422
.715
Opponent's OPB Pct + SLG Pct
.755
5165
At Bats
5187
213
Doubles
241
24
Triples
12
67
Batters Hit
78
85
Stolen Bases
114
152
Games Played
153
2
Complete Games
0
18
Shutouts
5
39
Wild Pitches
58
616
Runs Batted In
744
3
Balks
1
1350.1
Innings pitched
1356.0
9.8
Strikeouts Per 9 Innings
7.9
36
Caught Stealing
33
152
Games Started
153
0.0
Wins Above Replacement
0.0
1
Is Qualified
1
650
Runs
775
598
Earned Runs
710
2075
Total Bases
2189
Fielding
152
Team Games Played
153
1350
Full Innings
1356
5385
Total Chances
5547
4051
Putouts
4068
1257
Assists
1381
77
Errors
98
226
Double Plays
270
0.986
Fielding Percentage
0.982
35.4
Range Factor
36.2
0.0
Zone Rating
0.0
152
Games Played
153
0
Games Started
0
0.0
Defensive Wins Above Replacement
0.0
1
Qualified
1