

Phillies vs Padres Live Score (25 May, 2026)
Game Information
Stage
Standard
Season
2026
First Pitch
Mon, May 25, 6:40 pm
Venue
Petco Park
Location
San Diego, California
Attendance
41,293
Live Situation
3Balls
3Strikes
0Outs
—Pitcher
—At Bat
Pitch Sequence
1
BALL
Four-seam FB
101 MPH
2
STRIKE LOOKING
Splitter
97 MPH
3
STRIKE SWINGING
Splitter
97 MPH
4
BALL
Sweeper
90 MPH
5
BALL
Four-seam FB
100 MPH
6
STRIKE SWINGING
Splitter
98 MPH
Injury Report
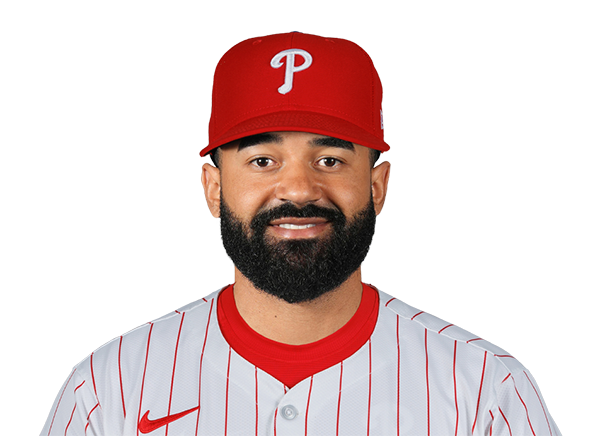
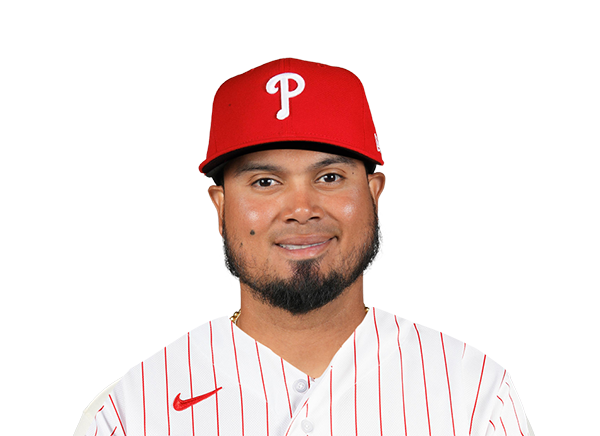





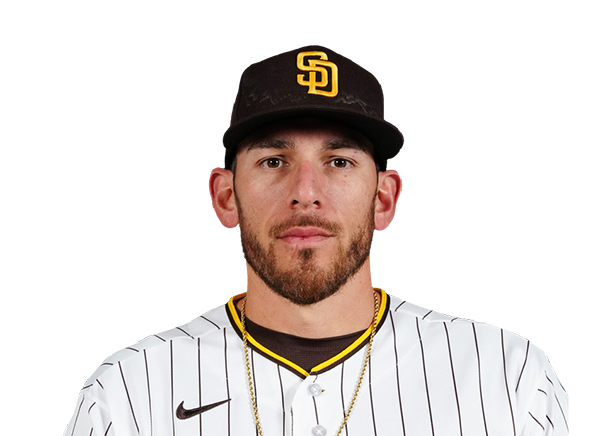
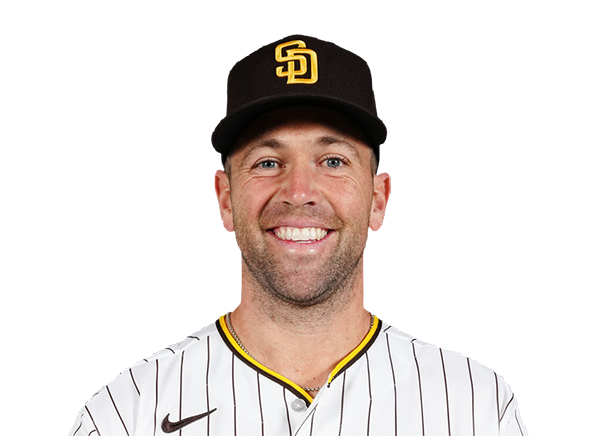
Team Stats
 PHI
SD


3
Runs
0
3
Hits
5
1
Errors
0
2
Home Runs
0
4
Walks
3
7
Strikeouts
10
Player Box Score
Philadelphia Phillies
| Player | H-AB | AB | R | H | RBI | HR | BB | K | #P | AVG | OBP | SLG |
|---|---|---|---|---|---|---|---|---|---|---|---|---|
 Trea Turner | 0-4 | 4 | 0 | 0 | 0 | 0 | 0 | 1 | 12 | .221 | .277 | .332 |
 Kyle Schwarber | 2-3 | 3 | 2 | 2 | 1 | 1 | 1 | 0 | 21 | .233 | .354 | .617 |
 Bryce Harper | 0-3 | 3 | 0 | 0 | 0 | 0 | 1 | 1 | 14 | .269 | .360 | .518 |
 Alec Bohm | 0-3 | 3 | 0 | 0 | 0 | 0 | 1 | 0 | 16 | .210 | .274 | .331 |
 Brandon Marsh | 1-4 | 4 | 1 | 1 | 2 | 1 | 0 | 1 | 18 | .318 | .349 | .475 |
 Bryson Stott | 0-2 | 2 | 0 | 0 | 0 | 0 | 1 | 0 | 12 | .236 | .287 | .400 |
 Adolis Garcia | 0-3 | 3 | 0 | 0 | 0 | 0 | 0 | 2 | 12 | .205 | .289 | .319 |
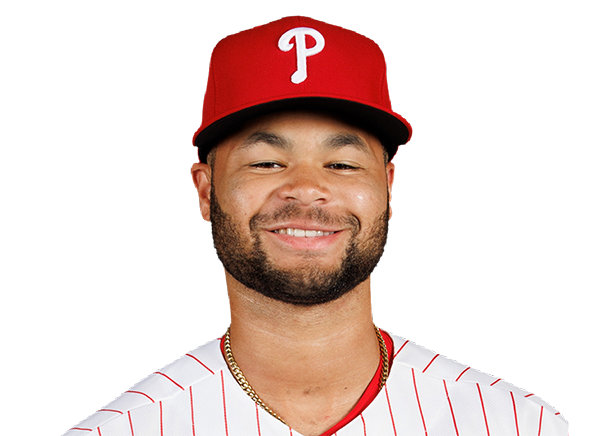 Justin Crawford | 0-3 | 3 | 0 | 0 | 0 | 0 | 0 | 1 | 12 | .235 | .304 | .346 |
 Rafael Marchan | 0-3 | 3 | 0 | 0 | 0 | 0 | 0 | 1 | 9 | .082 | .125 | .131 |
San Diego Padres
| Player | H-AB | AB | R | H | RBI | HR | BB | K | #P | AVG | OBP | SLG |
|---|---|---|---|---|---|---|---|---|---|---|---|---|
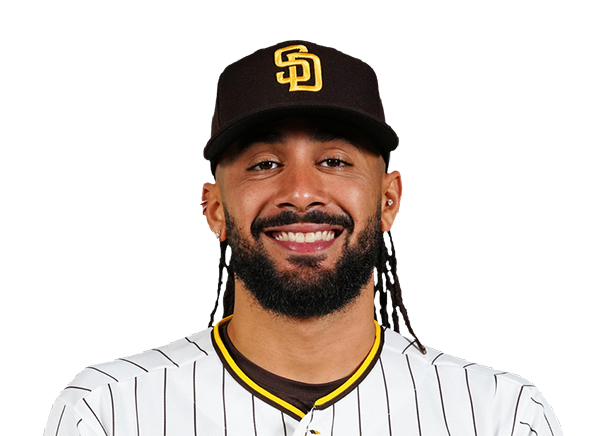 Fernando Tatis Jr. | 2-2 | 2 | 0 | 2 | 0 | 0 | 2 | 0 | 19 | .255 | .338 | .297 |
 Miguel Andujar | 1-3 | 3 | 0 | 1 | 0 | 0 | 1 | 0 | 22 | .281 | .308 | .484 |
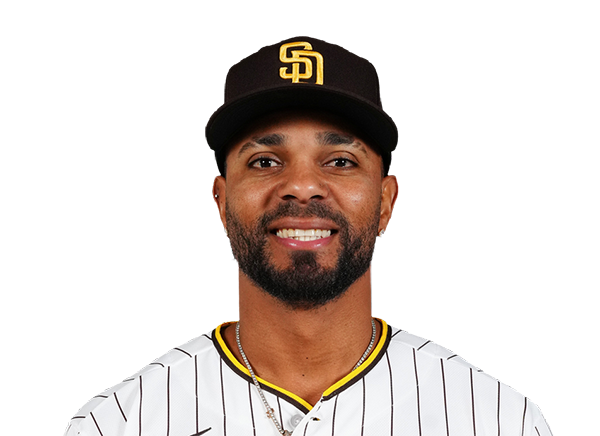 Xander Bogaerts | 0-4 | 4 | 0 | 0 | 0 | 0 | 0 | 0 | 16 | .245 | .314 | .375 |
 Manny Machado | 0-4 | 4 | 0 | 0 | 0 | 0 | 0 | 2 | 15 | .170 | .265 | .330 |
 Jackson Merrill | 0-4 | 4 | 0 | 0 | 0 | 0 | 0 | 3 | 20 | .198 | .272 | .316 |
 Nick Castellanos | 0-4 | 4 | 0 | 0 | 0 | 0 | 0 | 0 | 18 | .183 | .217 | .339 |
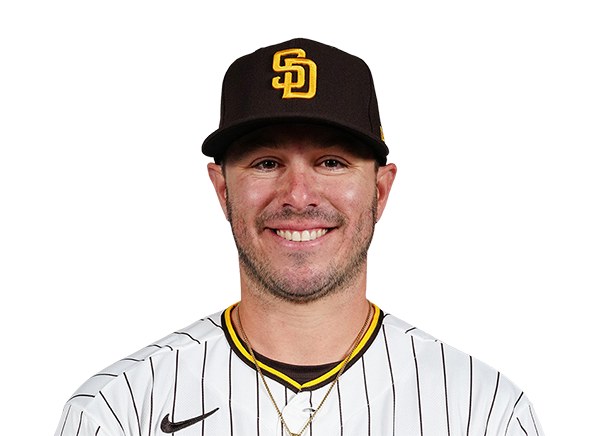 Ty France | 2-4 | 4 | 0 | 2 | 0 | 0 | 0 | 2 | 17 | .289 | .319 | .533 |
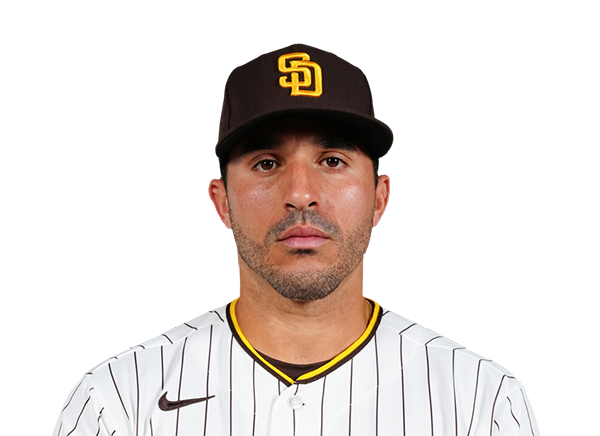 Ramon Laureano | 0-4 | 4 | 0 | 0 | 0 | 0 | 0 | 2 | 20 | .208 | .289 | .369 |
 Rodolfo Duran | 0-2 | 2 | 0 | 0 | 0 | 0 | 0 | 1 | 10 | .100 | .250 | .250 |
Philadelphia Phillies
| Player | IP | H | R | ER | BB | K | HR | PC-ST | ERA | PC |
|---|---|---|---|---|---|---|---|---|---|---|
 Jesus Luzardo | 6.0 | 4 | 0 | 0 | 2 | 6 | 0 | 104-64 | 4.38 | 104 |
 Orion Kerkering | 1.0 | 0 | 0 | 0 | 0 | 2 | 0 | 14-10 | 2.33 | 14 |
 Brad Keller | 1.0 | 0 | 0 | 0 | 1 | 1 | 0 | 22-11 | 3.57 | 22 |
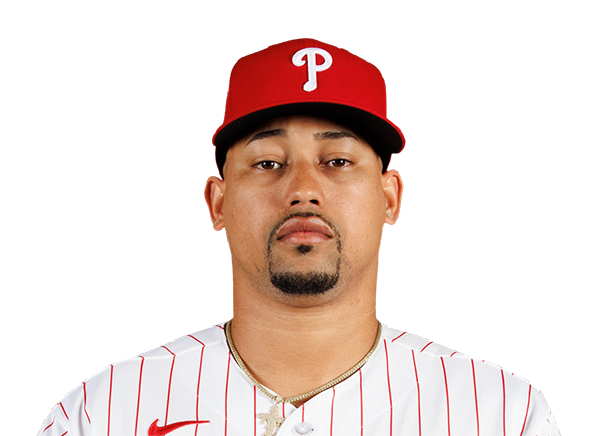 Jhoan Duran | 1.0 | 1 | 0 | 0 | 0 | 1 | 0 | 17-9 | 1.72 | 17 |
San Diego Padres
| Player | IP | H | R | ER | BB | K | HR | PC-ST | ERA | PC |
|---|---|---|---|---|---|---|---|---|---|---|
 Griffin Canning | 6.2 | 3 | 3 | 3 | 3 | 5 | 2 | 97-58 | 7.54 | 97 |
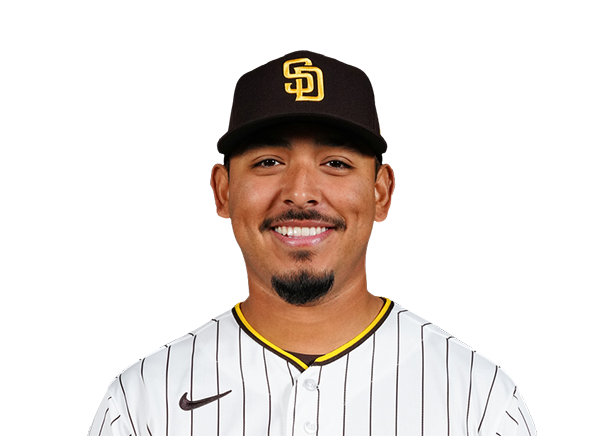 Jeremiah Estrada | 0.1 | 0 | 0 | 0 | 0 | 1 | 0 | 4-4 | 3.18 | 4 |
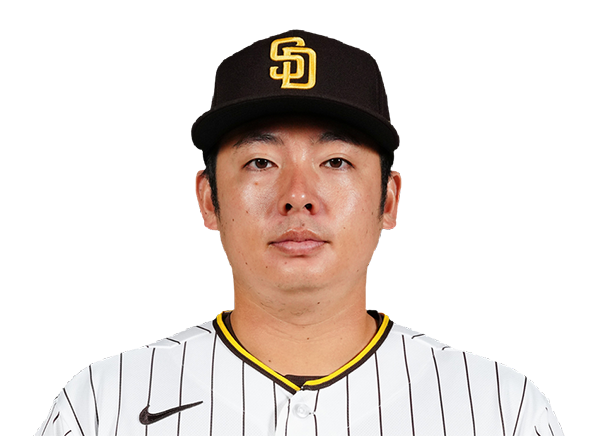 Yuki Matsui | 2.0 | 0 | 0 | 0 | 1 | 1 | 0 | 25-15 | 0.00 | 25 |
H2H / Season Series
PHI6–4
SD
PHI3–2
SD
PHI3–2
SD
SD0–3
PHI
SD3–4
PHI
SD0–3
PHI
Last 5 Games
| Date | Opponent | Result |
|---|---|---|
| Aug 22 |  vs STL | W12–3 |
| Aug 21 | vs STL | W7–6 |
| Aug 19 |  vs MIA | W4–1 |
| Aug 18 | vs MIA | W6–4 |
| Aug 17 | vs MIA | W6–5 |
| Date | Opponent | Result |
|---|---|---|
| Aug 22 |  vs MIN | W7–5 |
| Aug 21 | vs MIN | W6–2 |
| Aug 19 |  @ NYM | L2–4 |
| Aug 18 | @ NYM | W5–2 |
| Aug 17 | @ NYM | L1–2 |
Standings
American League
| Team | W | L | PCT | GB | DIFF | STRK |
|---|---|---|---|---|---|---|
1 Rays | 76 | 53 | .589 | - | +42 | L3 |
2 White Sox | 67 | 62 | .519 | 9 | +42 | L1 |
3 Astros | 65 | 65 | .500 | 11.5 | -43 | L1 |
4 Yankees | 73 | 56 | .566 | 3 | +95 | L1 |
5 Red Sox | 70 | 59 | .543 | 6 | +98 | W2 |
6 Rangers | 64 | 66 | .492 | 12.5 | -48 | L1 |
7 Guardians | 64 | 66 | .492 | 12.5 | -14 | W3 |
8 Blue Jays | 64 | 67 | .489 | 13 | -50 | W1 |
| 9Twins | 63 | 67 | .485 | 13.5 | -47 | L2 |
10 Orioles | 63 | 67 | .485 | 13.5 | -33 | W2 |
11 Mariners | 62 | 68 | .477 | 14.5 | -44 | W2 |
12 Tigers | 61 | 68 | .473 | 15 | +77 | L4 |
13 Royals | 57 | 74 | .435 | 20 | -95 | W7 |
14 Angels | 52 | 78 | .400 | 24.5 | -68 | W1 |
15 Athletics | 50 | 80 | .385 | 26.5 | -188 | W1 |
National League
| Team | W | L | PCT | GB | DIFF | STRK |
|---|---|---|---|---|---|---|
1 Brewers | 81 | 49 | .623 | - | +163 | W3 |
2 Dodgers | 79 | 51 | .608 | 2 | +147 | W5 |
3 Braves | 75 | 55 | .577 | 6 | +108 | L2 |
4 Cubs | 74 | 56 | .569 | 7 | +98 | L3 |
| 5Phillies | 72 | 58 | .554 | 9 | +25 | W8 |
| 6Padres | 70 | 60 | .538 | 11 | +9 | W2 |
7 Diamondbacks | 68 | 62 | .523 | 13 | +7 | L1 |
| 8Marlins | 66 | 64 | .508 | 15 | +17 | W2 |
| 9Cardinals | 66 | 65 | .504 | 15.5 | 0 | L2 |
10 Pirates | 63 | 68 | .481 | 18.5 | +29 | L2 |
11 Reds | 62 | 68 | .477 | 19 | -92 | W1 |
12 Nationals | 61 | 70 | .466 | 20.5 | +14 | L3 |
| 13Mets | 59 | 71 | .454 | 22 | -39 | W1 |
14 Giants | 52 | 77 | .403 | 28.5 | -79 | L3 |
15 Rockies | 50 | 79 | .388 | 30.5 | -131 | L5 |
PHI
VS
SD
Pitchers
Jesus Luzardo
Orion Kerkering
Brad Keller
Jhoan Duran
Catchers
Rafael Marchan
Infielders
Trea Turner
Bryce Harper
Alec Bohm
Bryson Stott
Outfielders
Brandon Marsh
Adolis Garcia
Justin Crawford
Designated Hitters
Kyle Schwarber
Pitchers
Griffin Canning
Jeremiah Estrada
Yuki Matsui
Catchers
Rodolfo Duran
Infielders
Fernando Tatis Jr.
Xander Bogaerts
Manny Machado
Ty France
Outfielders
Jackson Merrill
Nick Castellanos
Ramon Laureano
Designated Hitters
Miguel Andujar
Phillies
VS
Padres
Batting
130
Team Games Played
130
4358
At Bats
4278
1059
Hits
1020
574
Runs Batted In
536
157
Home Runs
145
95
Stolen Bases
124
.243
Batting Average
.238
593
Runs
556
188
Doubles
189
21
Triples
11
1760
Total Bases
1666
417
Walks
446
1090
Strikeouts
1056
.314
On Base Percentage
.315
.404
Slugging Percentage
.389
.718
OBP Pct + SLG Pct
.705
130
Games Played
130
130
Games Started
130
53
Hit By Pitch
51
0.0
Wins Above Replacement
0.0
0.0
Offensive Wins Above Replacement
0.0
16
Caught Stealing
33
1
Is Qualified
1
567.2
Runs Created
535.6
4.4
Runs Created Per 27 Outs
4.2
.085
Walks Per Plate Appearance
.092
0.38
Walk To Strikeout Ratio
0.42
.161
Isolated Power
.151
.275
Secondary Average
.277
3.89
Pitches Per Plate Appearance
3.92
366
Extra Base Hits
345
4888
Plate Appearances
4831
27.8
At Bats Per Home Run
29.5
11
Sacrifice Hit
19
46
Sacrifice Flies
35
Pitching
130
Team Games Played
130
56
Quality Starts
28
72
Wins
70
58
Losses
60
35
Saves
39
57
Holds
81
1110
Hits
1047
527
Earned runs
515
153
Home Runs
143
393
Walks
444
1281
Strikeouts
1046
10.0
Strikeouts Per 9 Innings
8.2
149.4
Pitches Per Start
146.6
1.30
Walks Plus Hits Per Inning Pitched
1.30
4.11
Earned Run Average
4.04
58
Losses
60
1154.2
Innings pitched
1148.0
.554
Win Percentage
.538
52
Save Opportunities
54
.250
Opponent Batting Average
.243
.317
Opponent's On-base pct.
.319
.406
Opponent's Slugging pct.
.393
.723
Opponent's OPB Pct + SLG Pct
.712
4440
At Bats
4317
187
Doubles
189
23
Triples
16
57
Batters Hit
52
76
Stolen Bases
81
130
Games Played
130
1
Complete Games
0
15
Shutouts
9
32
Wild Pitches
34
541
Runs Batted In
529
3
Balks
3
1154.2
Innings pitched
1148.0
10.0
Strikeouts Per 9 Innings
8.2
34
Caught Stealing
40
130
Games Started
130
0.0
Wins Above Replacement
0.0
1
Is Qualified
1
568
Runs
547
527
Earned Runs
515
1802
Total Bases
1697
Fielding
130
Team Games Played
130
1155
Full Innings
1148
4596
Total Chances
4640
3464
Putouts
3444
1066
Assists
1141
66
Errors
55
188
Double Plays
189
0.986
Fielding Percentage
0.988
35.3
Range Factor
35.9
0.0
Zone Rating
0.0
130
Games Played
130
0
Games Started
0
0.0
Defensive Wins Above Replacement
0.0
1
Qualified
1