

Phillies vs Twins Live Score (15 Aug, 2026)
Game Information
Stage
Standard
Season
2026
First Pitch
Sat, Aug 15, 7:10 pm
Venue
Target Field
Location
Minneapolis, Minnesota
Attendance
29,218
Live Situation
1Balls
2Strikes
0Outs
—Pitcher
—At Bat
Pitch Sequence
1
STRIKE FOUL
Sinker
94 MPH
2
STRIKE FOUL
Cutter
90 MPH
3
BALL
Sinker
96 MPH
4
BALL IN PLAY
Sweeper
83 MPH
Injury Report

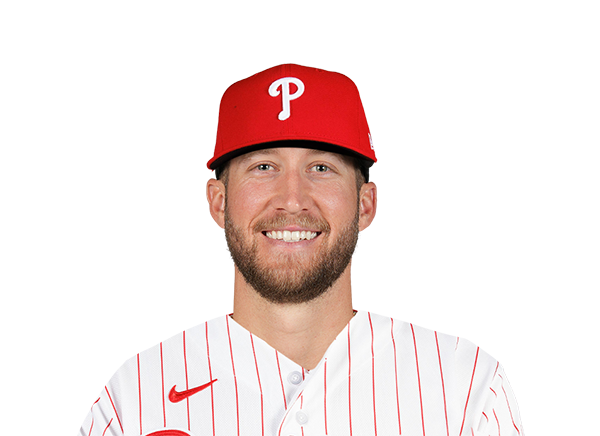
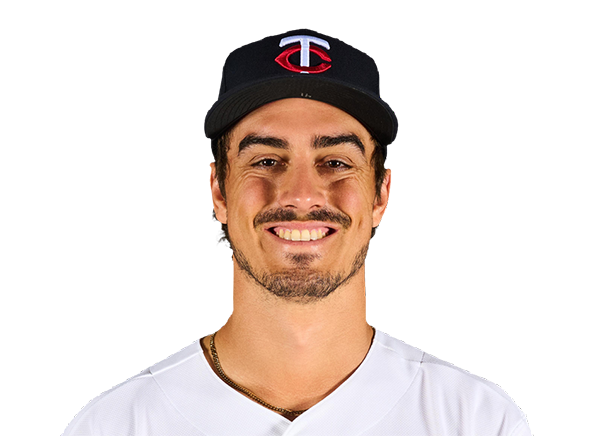
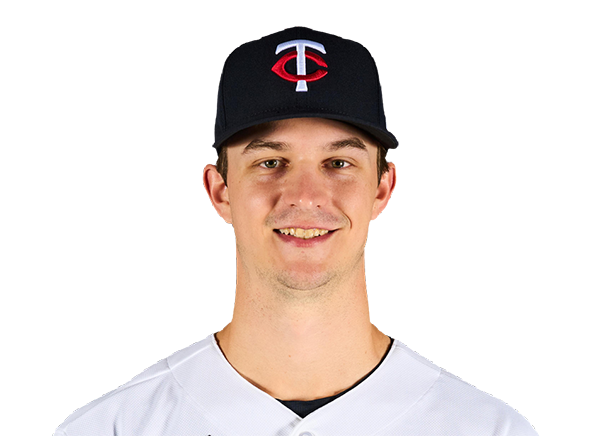
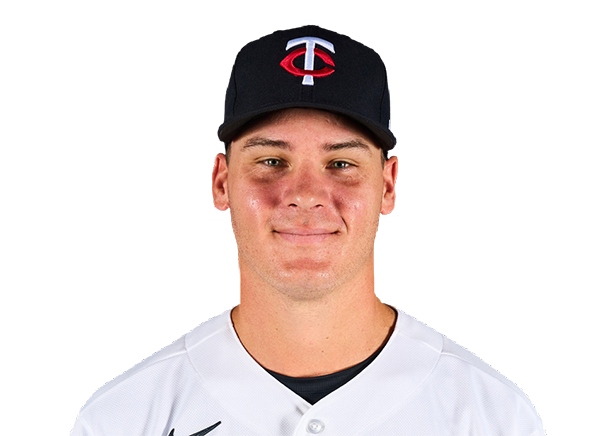
Team Stats
 PHI
MIN


9
Runs
1
13
Hits
9
0
Errors
0
1
Home Runs
0
6
Walks
4
8
Strikeouts
14
Player Box Score
Philadelphia Phillies
| Player | H-AB | AB | R | H | RBI | HR | BB | K | #P | AVG | OBP | SLG |
|---|---|---|---|---|---|---|---|---|---|---|---|---|
 Kyle Schwarber | 0-5 | 5 | 0 | 0 | 0 | 0 | 0 | 2 | 18 | .247 | .368 | .538 |
 Trea Turner | 1-3 | 3 | 1 | 1 | 0 | 0 | 1 | 2 | 14 | .247 | .298 | .398 |
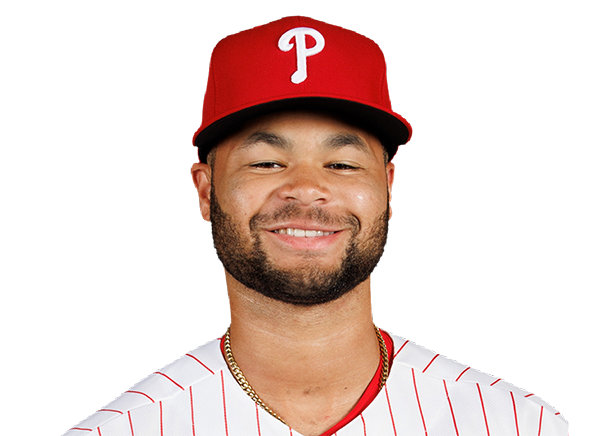 Justin Crawford | 0-1 | 1 | 0 | 0 | 0 | 0 | 0 | 0 | 1 | .263 | .311 | .350 |
 Bryce Harper | 2-4 | 4 | 1 | 2 | 0 | 0 | 1 | 1 | 21 | .256 | .375 | .495 |
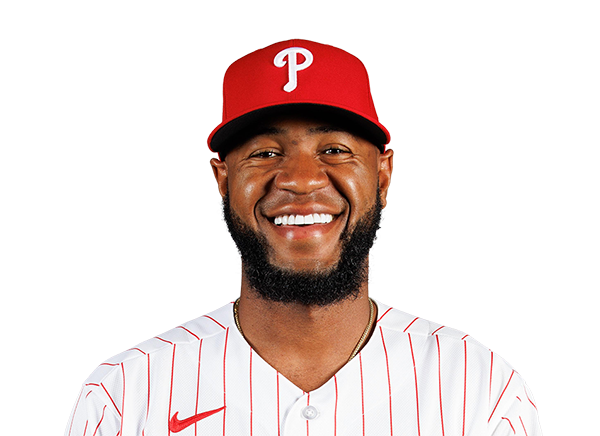 Bryan De La Cruz | 0-0 | 0 | 0 | 0 | 0 | 0 | 0 | 0 | 0 | .321 | .382 | .571 |
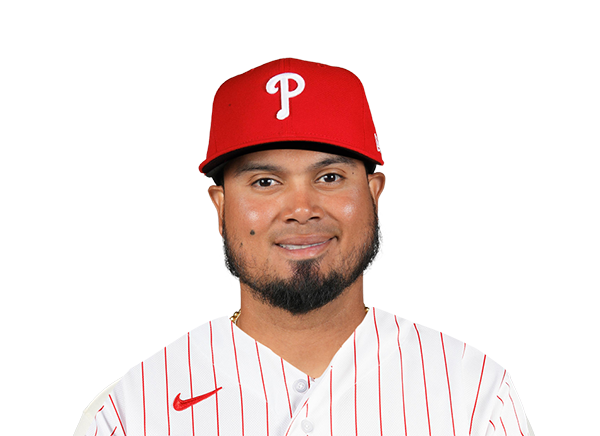 Luis Arraez | 1-4 | 4 | 2 | 1 | 1 | 0 | 1 | 0 | 14 | .245 | .269 | .367 |
 Alec Bohm | 5-5 | 5 | 2 | 5 | 1 | 0 | 0 | 0 | 21 | .239 | .298 | .376 |
 Edmundo Sosa | 1-4 | 4 | 1 | 1 | 2 | 0 | 1 | 0 | 16 | .219 | .263 | .344 |
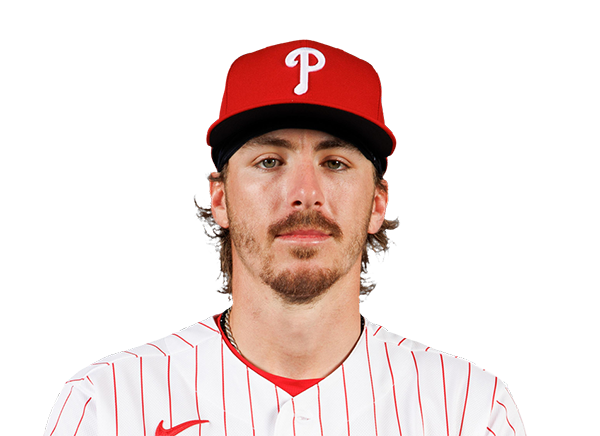 Bryson Stott | 1-3 | 3 | 1 | 1 | 3 | 1 | 2 | 0 | 24 | .266 | .341 | .422 |
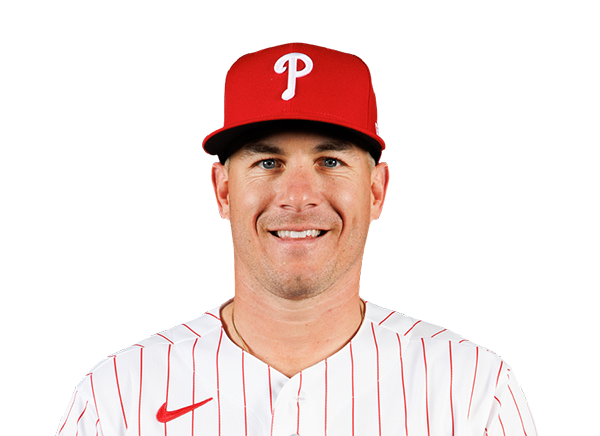 J.T. Realmuto | 1-3 | 3 | 1 | 1 | 2 | 0 | 0 | 1 | 17 | .218 | .290 | .342 |
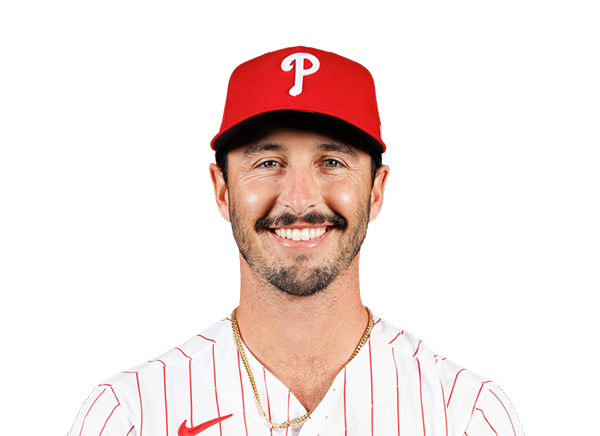 Garrett Stubbs | 0-0 | 0 | 0 | 0 | 0 | 0 | 0 | 0 | 0 | .122 | .196 | .122 |
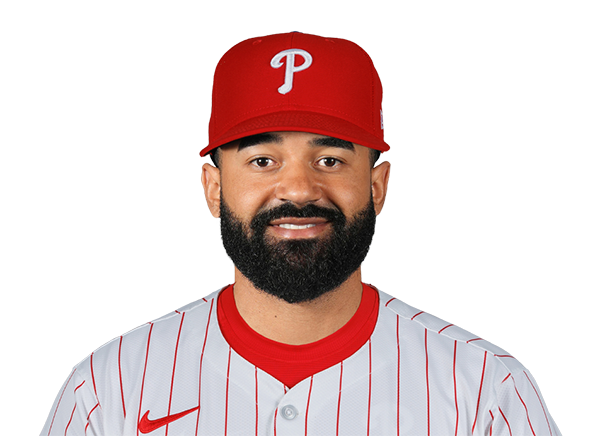 Derek Hill | 1-5 | 5 | 0 | 1 | 0 | 0 | 0 | 2 | 16 | .250 | .284 | .452 |
Minnesota Twins
| Player | H-AB | AB | R | H | RBI | HR | BB | K | #P | AVG | OBP | SLG |
|---|---|---|---|---|---|---|---|---|---|---|---|---|
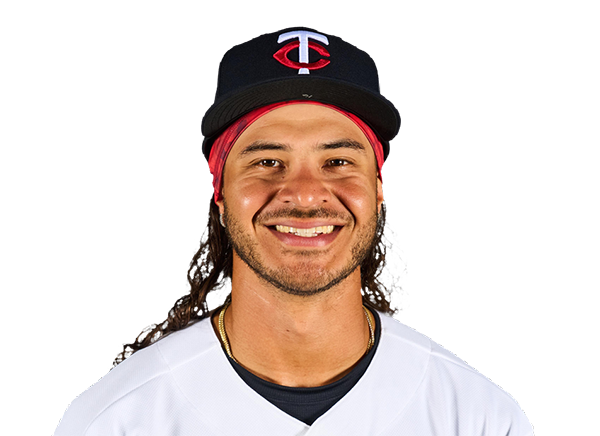 Austin Martin | 1-5 | 5 | 0 | 1 | 0 | 0 | 0 | 2 | 19 | .241 | .352 | .333 |
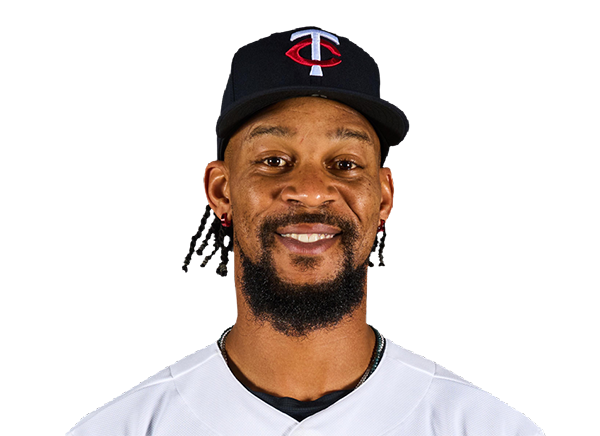 Byron Buxton | 0-3 | 3 | 0 | 0 | 0 | 0 | 2 | 2 | 22 | .260 | .321 | .538 |
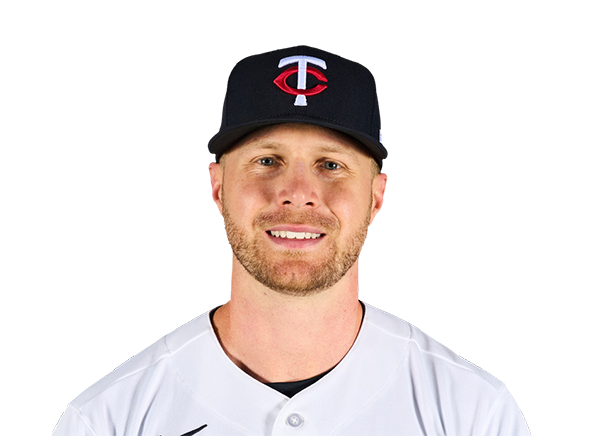 Ryan Jeffers | 1-4 | 4 | 1 | 1 | 0 | 0 | 1 | 1 | 24 | .286 | .391 | .495 |
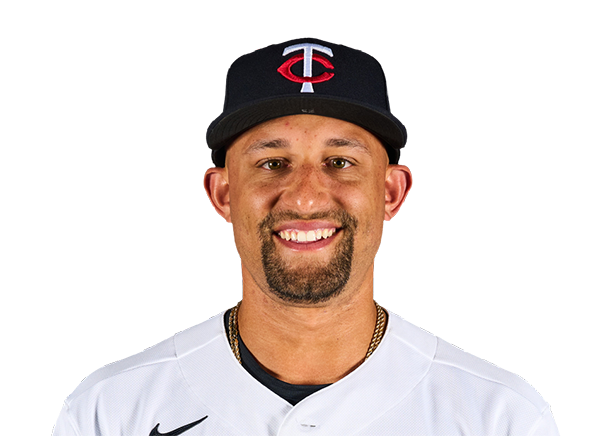 Royce Lewis | 1-4 | 4 | 0 | 1 | 1 | 0 | 0 | 2 | 9 | .242 | .312 | .428 |
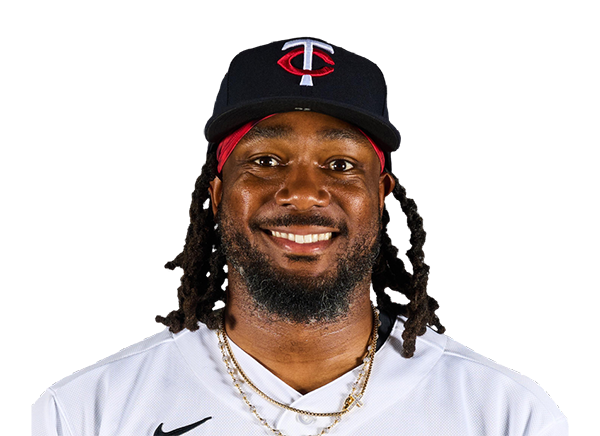 Josh Bell | 1-4 | 4 | 0 | 1 | 0 | 0 | 0 | 0 | 18 | .253 | .315 | .421 |
 Luke Keaschall | 2-4 | 4 | 0 | 2 | 0 | 0 | 0 | 1 | 12 | .268 | .363 | .375 |
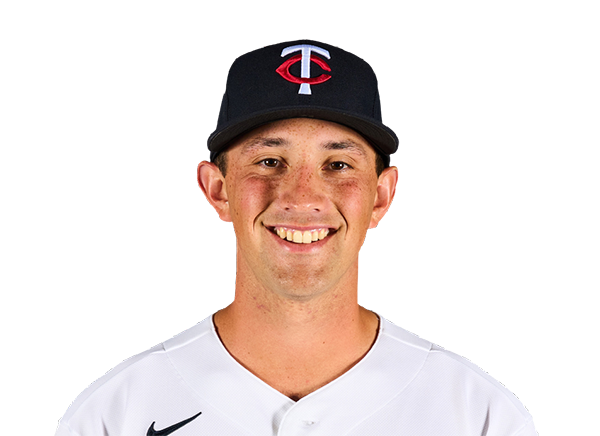 Brooks Lee | 1-4 | 4 | 0 | 1 | 0 | 0 | 0 | 2 | 15 | .245 | .300 | .419 |
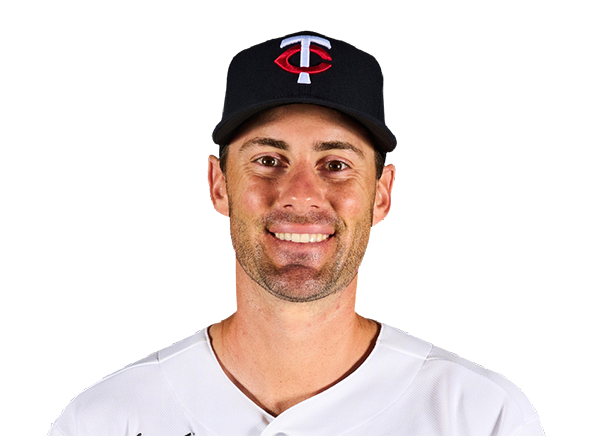 Ryan Kreidler | 0-3 | 3 | 0 | 0 | 0 | 0 | 1 | 3 | 16 | .228 | .281 | .371 |
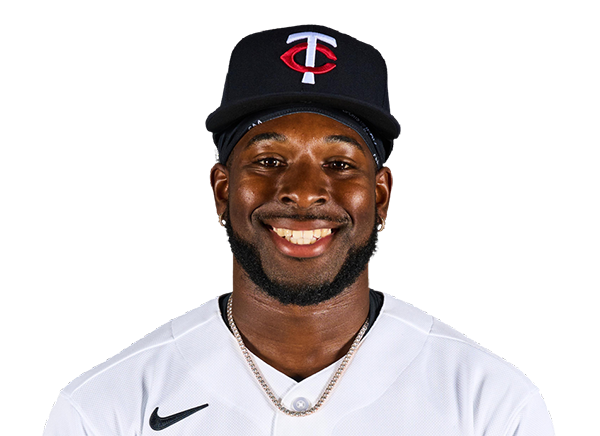 Kaelen Culpepper | 2-4 | 4 | 0 | 2 | 0 | 0 | 0 | 1 | 14 | .238 | .320 | .429 |
Philadelphia Phillies
| Player | IP | H | R | ER | BB | K | HR | PC-ST | ERA | PC |
|---|---|---|---|---|---|---|---|---|---|---|
 Jesus Luzardo | 6.2 | 7 | 1 | 1 | 2 | 9 | 0 | 109-70 | 3.23 | 109 |
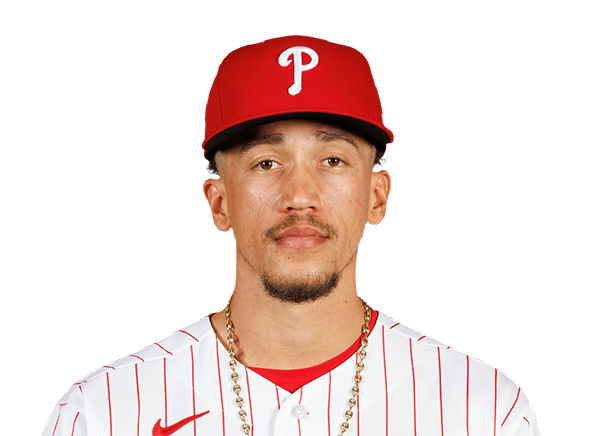 Alex McFarlane | 1.1 | 1 | 0 | 0 | 1 | 3 | 0 | 22-14 | 2.70 | 22 |
 Chase Shugart | 1.0 | 1 | 0 | 0 | 1 | 2 | 0 | 18-12 | 4.61 | 18 |
Minnesota Twins
| Player | IP | H | R | ER | BB | K | HR | PC-ST | ERA | PC |
|---|---|---|---|---|---|---|---|---|---|---|
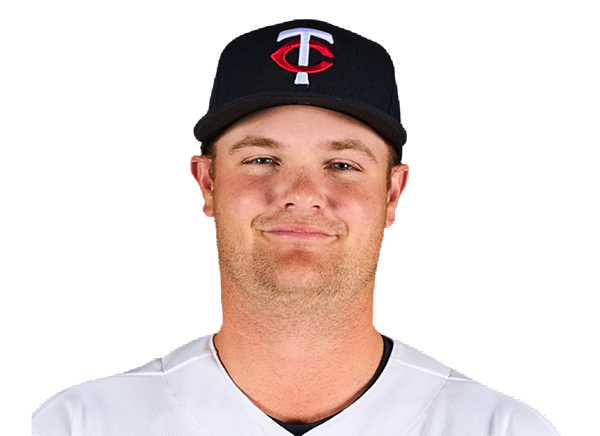 Connor Prielipp | 5.0 | 8 | 8 | 8 | 4 | 6 | 1 | 94-58 | 5.34 | 94 |
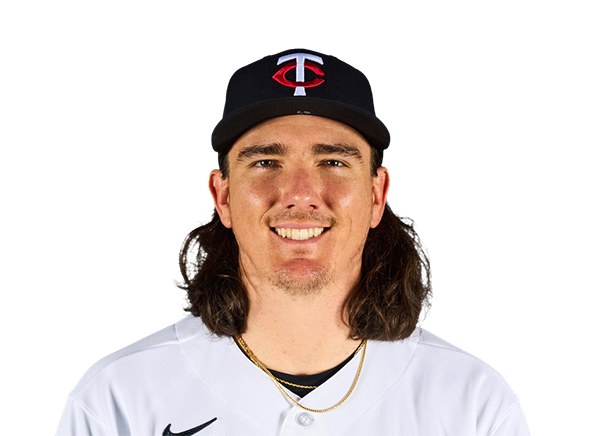 Kody Funderburk | 1.0 | 2 | 0 | 0 | 0 | 1 | 0 | 16-10 | 2.77 | 16 |
 Andrew Morris | 1.0 | 1 | 0 | 0 | 1 | 1 | 0 | 23-15 | 2.98 | 23 |
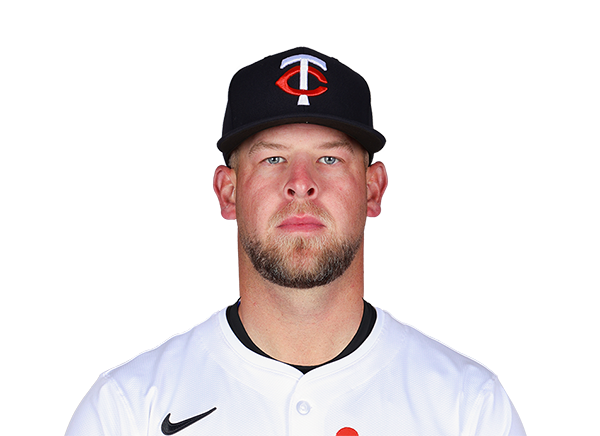 A.J. Minter | 1.0 | 1 | 0 | 0 | 0 | 0 | 0 | 12-10 | 2.17 | 12 |
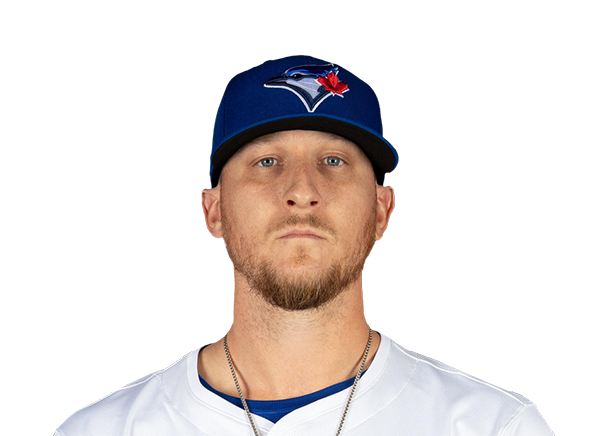 Jeff Hoffman | 1.0 | 1 | 1 | 1 | 1 | 0 | 0 | 17-9 | 3.91 | 17 |
H2H / Season Series
MIN5–7
PHI
MIN1–9
PHI
MIN1–7
PHI
PHI2–0
MIN
MIN7–6
PHI
Last 5 Games
| Date | Opponent | Result |
|---|---|---|
| Aug 22 |  vs STL | W12–3 |
| Aug 21 | vs STL | W7–6 |
| Aug 19 |  vs MIA | W4–1 |
| Aug 18 | vs MIA | W6–4 |
| Aug 17 | vs MIA | W6–5 |
| Date | Opponent | Result |
|---|---|---|
| Aug 22 |  @ SD | L5–7 |
| Aug 21 | @ SD | L2–6 |
| Aug 19 |  vs ATL | W6–4 |
| Aug 18 | vs ATL | W4–1 |
| Aug 17 | vs ATL | W4–2 |
Standings
American League
| Team | W | L | PCT | GB | DIFF | STRK |
|---|---|---|---|---|---|---|
1 Rays | 76 | 53 | .589 | - | +42 | L3 |
2 White Sox | 67 | 62 | .519 | 9 | +42 | L1 |
3 Astros | 65 | 65 | .500 | 11.5 | -43 | L1 |
4 Yankees | 73 | 56 | .566 | 3 | +95 | L1 |
5 Red Sox | 70 | 59 | .543 | 6 | +98 | W2 |
6 Rangers | 64 | 66 | .492 | 12.5 | -48 | L1 |
7 Guardians | 64 | 66 | .492 | 12.5 | -14 | W3 |
8 Blue Jays | 64 | 67 | .489 | 13 | -50 | W1 |
| 9Twins | 63 | 67 | .485 | 13.5 | -47 | L2 |
10 Orioles | 63 | 67 | .485 | 13.5 | -33 | W2 |
11 Mariners | 62 | 68 | .477 | 14.5 | -44 | W2 |
12 Tigers | 61 | 68 | .473 | 15 | +77 | L4 |
13 Royals | 57 | 74 | .435 | 20 | -95 | W7 |
14 Angels | 52 | 78 | .400 | 24.5 | -68 | W1 |
15 Athletics | 50 | 80 | .385 | 26.5 | -188 | W1 |
National League
| Team | W | L | PCT | GB | DIFF | STRK |
|---|---|---|---|---|---|---|
1 Brewers | 81 | 49 | .623 | - | +163 | W3 |
2 Dodgers | 79 | 51 | .608 | 2 | +147 | W5 |
| 3Braves | 75 | 55 | .577 | 6 | +108 | L2 |
4 Cubs | 74 | 56 | .569 | 7 | +98 | L3 |
| 5Phillies | 72 | 58 | .554 | 9 | +25 | W8 |
| 6Padres | 70 | 60 | .538 | 11 | +9 | W2 |
7 Diamondbacks | 68 | 62 | .523 | 13 | +7 | L1 |
| 8Marlins | 66 | 64 | .508 | 15 | +17 | W2 |
| 9Cardinals | 66 | 65 | .504 | 15.5 | 0 | L2 |
10 Pirates | 63 | 68 | .481 | 18.5 | +29 | L2 |
11 Reds | 62 | 68 | .477 | 19 | -92 | W1 |
12 Nationals | 61 | 70 | .466 | 20.5 | +14 | L3 |
13 Mets | 59 | 71 | .454 | 22 | -39 | W1 |
14 Giants | 52 | 77 | .403 | 28.5 | -79 | L3 |
15 Rockies | 50 | 79 | .388 | 30.5 | -131 | L5 |
PHI
VS
MIN
Pitchers
Jesus Luzardo
Alex McFarlane
Chase Shugart
Catchers
J.T. Realmuto
Garrett Stubbs
Infielders
Trea Turner
Luis Arraez
Alec Bohm
Edmundo Sosa
Bryson Stott
Outfielders
Justin Crawford
Bryce Harper
Bryan De La Cruz
Derek Hill
Designated Hitters
Kyle Schwarber
Pitchers
Connor Prielipp
Kody Funderburk
Andrew Morris
A.J. Minter
Jeff Hoffman
Catchers
Ryan Jeffers
Infielders
Royce Lewis
Brooks Lee
Ryan Kreidler
Kaelen Culpepper
Outfielders
Austin Martin
Byron Buxton
Luke Keaschall
Designated Hitters
Josh Bell
Phillies
VS
Twins
Batting
123
Team Games Played
123
4118
At Bats
4147
980
Hits
1016
523
Runs Batted In
544
152
Home Runs
144
95
Stolen Bases
73
.238
Batting Average
.245
542
Runs
572
172
Doubles
199
19
Triples
18
1646
Total Bases
1683
390
Walks
403
1054
Strikeouts
998
.309
On Base Percentage
.319
.400
Slugging Percentage
.406
.709
OBP Pct + SLG Pct
.725
123
Games Played
123
123
Games Started
123
51
Hit By Pitch
66
0.0
Wins Above Replacement
0.0
0.0
Offensive Wins Above Replacement
0.0
15
Caught Stealing
30
1
Is Qualified
1
523.1
Runs Created
547.4
4.3
Runs Created Per 27 Outs
4.5
.085
Walks Per Plate Appearance
.086
0.37
Walk To Strikeout Ratio
0.40
.162
Isolated Power
.161
.276
Secondary Average
.268
3.90
Pitches Per Plate Appearance
3.87
343
Extra Base Hits
361
4610
Plate Appearances
4659
27.1
At Bats Per Home Run
28.8
8
Sacrifice Hit
6
40
Sacrifice Flies
36
Pitching
123
Team Games Played
123
52
Quality Starts
43
65
Wins
60
58
Losses
63
31
Saves
34
49
Holds
80
1049
Hits
1049
506
Earned runs
557
145
Home Runs
144
373
Walks
449
1208
Strikeouts
1014
10.0
Strikeouts Per 9 Innings
8.4
149.1
Pitches Per Start
149.9
1.30
Walks Plus Hits Per Inning Pitched
1.38
4.18
Earned Run Average
4.62
58
Losses
63
1090.2
Innings pitched
1085.2
.528
Win Percentage
.488
47
Save Opportunities
46
.250
Opponent Batting Average
.252
.317
Opponent's On-base pct.
.330
.407
Opponent's Slugging pct.
.414
.724
Opponent's OPB Pct + SLG Pct
.744
4194
At Bats
4164
178
Doubles
212
22
Triples
15
55
Batters Hit
55
75
Stolen Bases
108
123
Games Played
123
1
Complete Games
1
15
Shutouts
3
30
Wild Pitches
33
517
Runs Batted In
583
3
Balks
5
1090.2
Innings pitched
1085.2
10.0
Strikeouts Per 9 Innings
8.4
32
Caught Stealing
19
123
Games Started
123
0.0
Wins Above Replacement
0.0
1
Is Qualified
1
543
Runs
610
506
Earned Runs
557
1706
Total Bases
1723
Fielding
123
Team Games Played
123
1091
Full Innings
1086
4341
Total Chances
4253
3272
Putouts
3257
1007
Assists
938
62
Errors
58
172
Double Plays
199
0.986
Fielding Percentage
0.986
35.3
Range Factor
34.8
0.0
Zone Rating
0.0
123
Games Played
123
0
Games Started
0
0.0
Defensive Wins Above Replacement
0.0
1
Qualified
1