

Phillies vs Twins Live Score (16 Aug, 2026)
Game Information
Stage
Standard
Season
2026
First Pitch
Sun, Aug 16, 2:10 pm
Venue
Target Field
Location
Minneapolis, Minnesota
Attendance
29,614
Live Situation
2Balls
3Strikes
0Outs
—Pitcher
—At Bat
Pitch Sequence
1
STRIKE FOUL
Splitter
99 MPH
2
STRIKE SWINGING
Sweeper
90 MPH
3
BALL
Sweeper
91 MPH
4
BALL
Splitter
98 MPH
5
STRIKE SWINGING
Sweeper
91 MPH
Injury Report



Team Stats
 PHI
MIN


7
Runs
5
9
Hits
7
0
Errors
1
1
Home Runs
2
3
Walks
5
7
Strikeouts
9
Player Box Score
Philadelphia Phillies
| Player | H-AB | AB | R | H | RBI | HR | BB | K | #P | AVG | OBP | SLG |
|---|---|---|---|---|---|---|---|---|---|---|---|---|
 Kyle Schwarber | 1-4 | 4 | 1 | 1 | 0 | 0 | 1 | 1 | 23 | .247 | .368 | .537 |
 Bryson Stott | 1-5 | 5 | 1 | 1 | 0 | 0 | 0 | 0 | 29 | .265 | .340 | .419 |
 Bryce Harper | 1-4 | 4 | 2 | 1 | 0 | 0 | 1 | 0 | 19 | .256 | .375 | .493 |
 Luis Arraez | 1-4 | 4 | 0 | 1 | 1 | 0 | 0 | 0 | 14 | .245 | .268 | .377 |
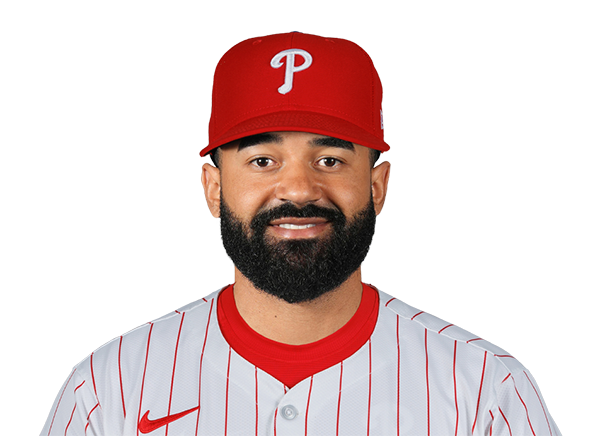 Derek Hill | 0-0 | 0 | 1 | 0 | 0 | 0 | 0 | 0 | 0 | .250 | .284 | .452 |
 Alec Bohm | 2-4 | 4 | 2 | 2 | 4 | 1 | 0 | 1 | 10 | .242 | .300 | .384 |
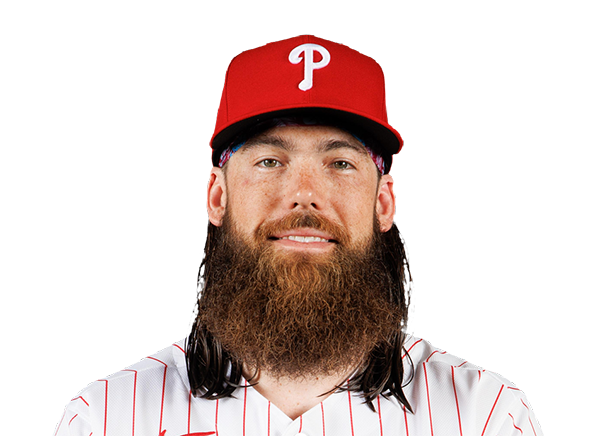 Brandon Marsh | 0-3 | 3 | 0 | 0 | 0 | 0 | 1 | 1 | 10 | .274 | .320 | .440 |
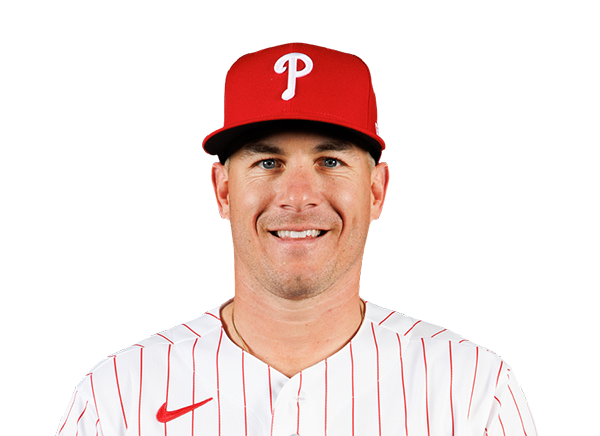 J.T. Realmuto | 0-4 | 4 | 0 | 0 | 0 | 0 | 0 | 2 | 17 | .215 | .287 | .338 |
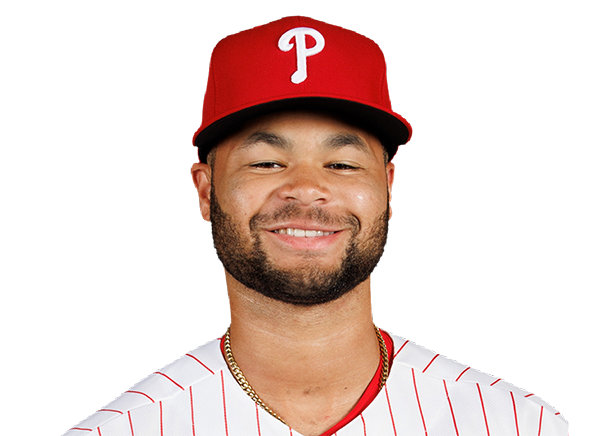 Justin Crawford | 1-2 | 2 | 0 | 1 | 0 | 0 | 0 | 0 | 3 | .265 | .312 | .354 |
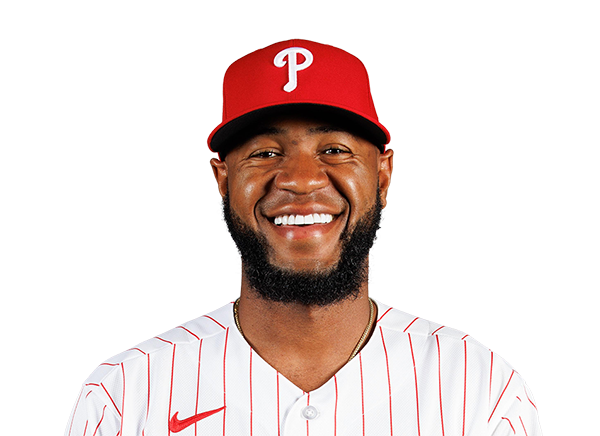 Bryan De La Cruz | 1-2 | 2 | 0 | 1 | 2 | 0 | 0 | 0 | 11 | .333 | .389 | .567 |
 Edmundo Sosa | 1-4 | 4 | 0 | 1 | 0 | 0 | 0 | 2 | 15 | .219 | .262 | .353 |
Minnesota Twins
| Player | H-AB | AB | R | H | RBI | HR | BB | K | #P | AVG | OBP | SLG |
|---|---|---|---|---|---|---|---|---|---|---|---|---|
 Trevor Larnach | 1-3 | 3 | 0 | 1 | 0 | 0 | 1 | 0 | 17 | .273 | .359 | .429 |
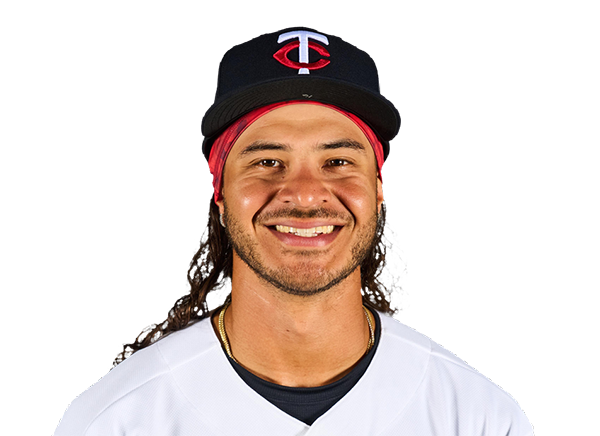 Austin Martin | 0-0 | 0 | 0 | 0 | 0 | 0 | 0 | 0 | 0 | .241 | .352 | .333 |
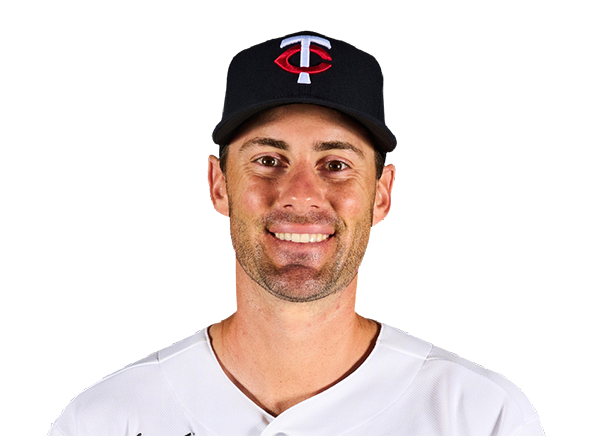 Ryan Kreidler | 0-0 | 0 | 0 | 0 | 0 | 0 | 0 | 0 | 0 | .228 | .281 | .371 |
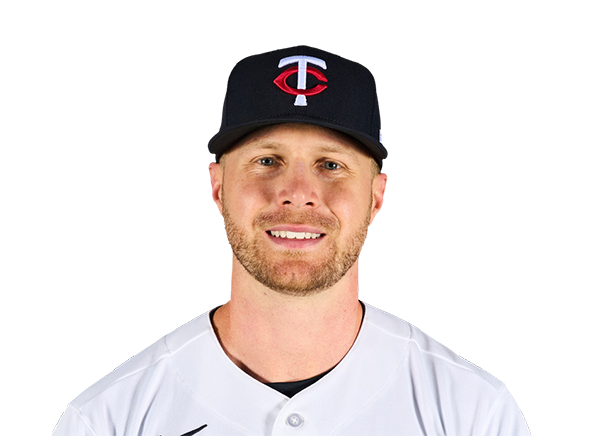 Ryan Jeffers | 0-1 | 1 | 0 | 0 | 0 | 0 | 0 | 1 | 7 | .284 | .390 | .493 |
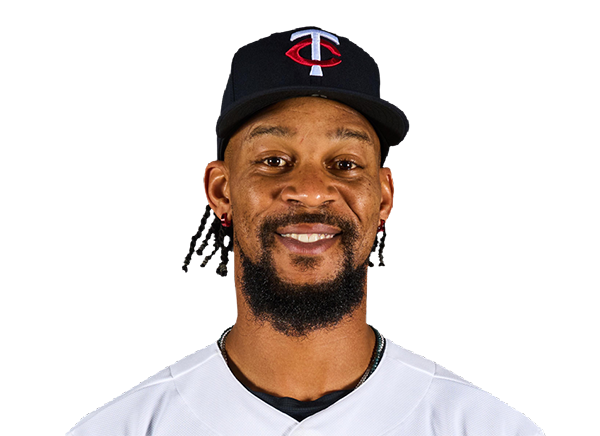 Byron Buxton | 0-5 | 5 | 0 | 0 | 0 | 0 | 0 | 3 | 20 | .257 | .316 | .531 |
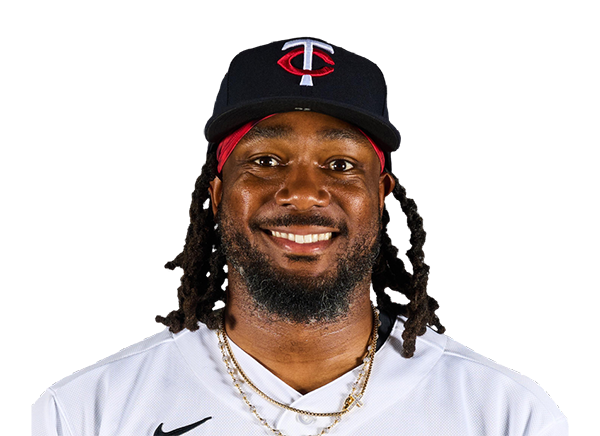 Josh Bell | 1-4 | 4 | 1 | 1 | 0 | 0 | 0 | 1 | 18 | .253 | .315 | .420 |
 Kody Clemens | 2-4 | 4 | 2 | 2 | 1 | 1 | 0 | 1 | 16 | .230 | .287 | .463 |
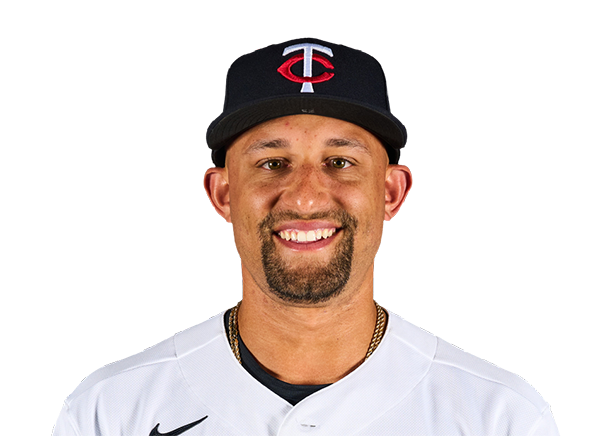 Royce Lewis | 1-2 | 2 | 1 | 1 | 0 | 0 | 2 | 0 | 22 | .243 | .317 | .429 |
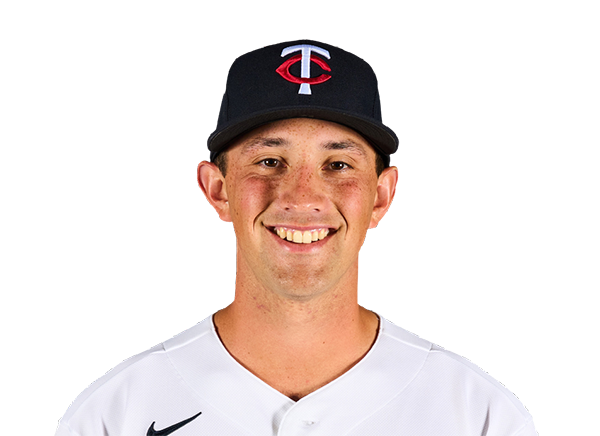 Brooks Lee | 1-4 | 4 | 1 | 1 | 4 | 1 | 0 | 1 | 19 | .245 | .300 | .424 |
 Luke Keaschall | 0-3 | 3 | 0 | 0 | 0 | 0 | 0 | 2 | 12 | .266 | .362 | .372 |
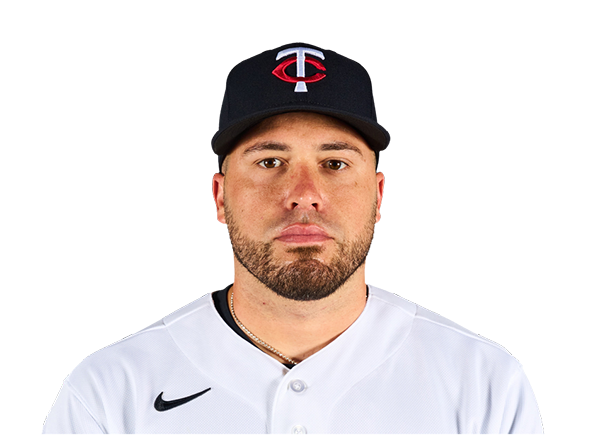 Victor Caratini | 0-3 | 3 | 0 | 0 | 0 | 0 | 1 | 0 | 13 | .227 | .317 | .333 |
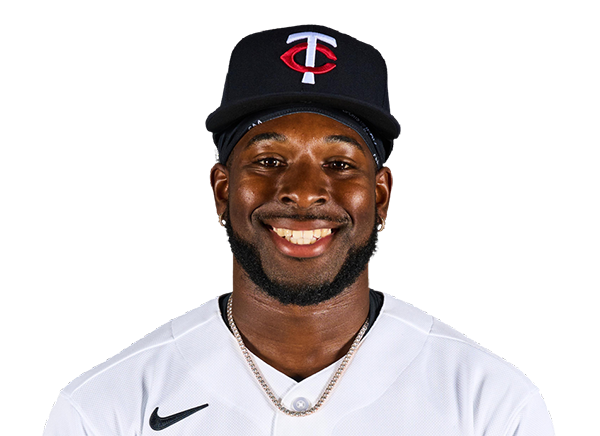 Kaelen Culpepper | 1-3 | 3 | 0 | 1 | 0 | 0 | 1 | 0 | 23 | .250 | .345 | .417 |
Philadelphia Phillies
| Player | IP | H | R | ER | BB | K | HR | PC-ST | ERA | PC |
|---|---|---|---|---|---|---|---|---|---|---|
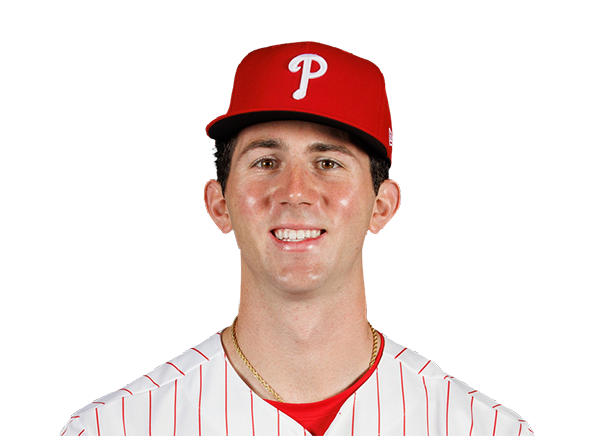 Andrew Painter | 5.0 | 6 | 5 | 5 | 3 | 2 | 2 | 94-58 | 6.43 | 94 |
 Tim Mayza | 1.0 | 0 | 0 | 0 | 0 | 2 | 0 | 14-11 | 3.51 | 14 |
 Orion Kerkering | 1.0 | 0 | 0 | 0 | 0 | 0 | 0 | 12-7 | 3.72 | 12 |
 Jonathan Bowlan | 1.0 | 0 | 0 | 0 | 1 | 2 | 0 | 14-10 | 2.62 | 14 |
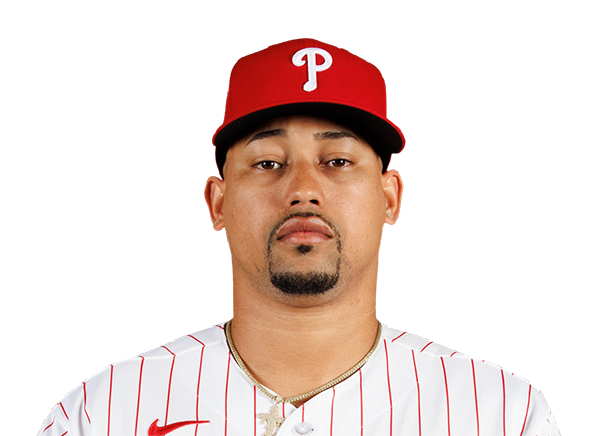 Jhoan Duran | 1.0 | 1 | 0 | 0 | 1 | 3 | 0 | 33-19 | 1.66 | 33 |
Minnesota Twins
| Player | IP | H | R | ER | BB | K | HR | PC-ST | ERA | PC |
|---|---|---|---|---|---|---|---|---|---|---|
 Dean Kremer | 5.1 | 5 | 4 | 4 | 2 | 6 | 1 | 89-52 | 5.40 | 89 |
 Kody Funderburk | 0.2 | 0 | 0 | 0 | 0 | 0 | 0 | 4-3 | 2.72 | 4 |
 A.J. Minter | 1.0 | 0 | 0 | 0 | 0 | 1 | 0 | 14-9 | 2.10 | 14 |
 Andrew Morris | 1.0 | 4 | 3 | 3 | 1 | 0 | 0 | 28-18 | 3.39 | 28 |
 Taylor Rogers | 1.0 | 0 | 0 | 0 | 0 | 0 | 0 | 16-10 | 5.00 | 16 |
H2H / Season Series
MIN5–7
PHI
MIN1–9
PHI
MIN1–7
PHI
PHI2–0
MIN
MIN7–6
PHI
Last 5 Games
| Date | Opponent | Result |
|---|---|---|
| Aug 22 |  vs STL | W12–3 |
| Aug 21 | vs STL | W7–6 |
| Aug 19 |  vs MIA | W4–1 |
| Aug 18 | vs MIA | W6–4 |
| Aug 17 | vs MIA | W6–5 |
| Date | Opponent | Result |
|---|---|---|
| Aug 22 |  @ SD | L5–7 |
| Aug 21 | @ SD | L2–6 |
| Aug 19 |  vs ATL | W6–4 |
| Aug 18 | vs ATL | W4–1 |
| Aug 17 | vs ATL | W4–2 |
Standings
American League
| Team | W | L | PCT | GB | DIFF | STRK |
|---|---|---|---|---|---|---|
1 Rays | 76 | 53 | .589 | - | +42 | L3 |
2 White Sox | 67 | 62 | .519 | 9 | +42 | L1 |
3 Astros | 65 | 65 | .500 | 11.5 | -43 | L1 |
4 Yankees | 73 | 56 | .566 | 3 | +95 | L1 |
5 Red Sox | 70 | 59 | .543 | 6 | +98 | W2 |
6 Rangers | 64 | 66 | .492 | 12.5 | -48 | L1 |
7 Guardians | 64 | 66 | .492 | 12.5 | -14 | W3 |
8 Blue Jays | 64 | 67 | .489 | 13 | -50 | W1 |
| 9Twins | 63 | 67 | .485 | 13.5 | -47 | L2 |
10 Orioles | 63 | 67 | .485 | 13.5 | -33 | W2 |
11 Mariners | 62 | 68 | .477 | 14.5 | -44 | W2 |
12 Tigers | 61 | 68 | .473 | 15 | +77 | L4 |
13 Royals | 57 | 74 | .435 | 20 | -95 | W7 |
14 Angels | 52 | 78 | .400 | 24.5 | -68 | W1 |
15 Athletics | 50 | 80 | .385 | 26.5 | -188 | W1 |
National League
| Team | W | L | PCT | GB | DIFF | STRK |
|---|---|---|---|---|---|---|
1 Brewers | 81 | 49 | .623 | - | +163 | W3 |
2 Dodgers | 79 | 51 | .608 | 2 | +147 | W5 |
| 3Braves | 75 | 55 | .577 | 6 | +108 | L2 |
4 Cubs | 74 | 56 | .569 | 7 | +98 | L3 |
| 5Phillies | 72 | 58 | .554 | 9 | +25 | W8 |
| 6Padres | 70 | 60 | .538 | 11 | +9 | W2 |
7 Diamondbacks | 68 | 62 | .523 | 13 | +7 | L1 |
| 8Marlins | 66 | 64 | .508 | 15 | +17 | W2 |
| 9Cardinals | 66 | 65 | .504 | 15.5 | 0 | L2 |
10 Pirates | 63 | 68 | .481 | 18.5 | +29 | L2 |
11 Reds | 62 | 68 | .477 | 19 | -92 | W1 |
12 Nationals | 61 | 70 | .466 | 20.5 | +14 | L3 |
13 Mets | 59 | 71 | .454 | 22 | -39 | W1 |
14 Giants | 52 | 77 | .403 | 28.5 | -79 | L3 |
15 Rockies | 50 | 79 | .388 | 30.5 | -131 | L5 |
PHI
VS
MIN
Pitchers
Andrew Painter
Tim Mayza
Orion Kerkering
Jonathan Bowlan
Jhoan Duran
Catchers
J.T. Realmuto
Infielders
Bryson Stott
Bryce Harper
Luis Arraez
Alec Bohm
Edmundo Sosa
Outfielders
Derek Hill
Brandon Marsh
Justin Crawford
Bryan De La Cruz
Designated Hitters
Kyle Schwarber
Pitchers
Dean Kremer
Kody Funderburk
A.J. Minter
Andrew Morris
Taylor Rogers
Catchers
Victor Caratini
Infielders
Ryan Kreidler
Royce Lewis
Brooks Lee
Kaelen Culpepper
Outfielders
Trevor Larnach
Austin Martin
Byron Buxton
Kody Clemens
Luke Keaschall
Designated Hitters
Josh Bell
Other Players
Ryan Jeffers
Phillies
VS
Twins
Batting
130
Team Games Played
130
4358
At Bats
4379
1059
Hits
1074
574
Runs Batted In
571
157
Home Runs
150
95
Stolen Bases
74
.243
Batting Average
.245
593
Runs
599
188
Doubles
212
21
Triples
19
1760
Total Bases
1774
417
Walks
422
1090
Strikeouts
1045
.314
On Base Percentage
.319
.404
Slugging Percentage
.405
.718
OBP Pct + SLG Pct
.724
130
Games Played
130
130
Games Started
130
53
Hit By Pitch
71
0.0
Wins Above Replacement
0.0
0.0
Offensive Wins Above Replacement
0.0
16
Caught Stealing
31
1
Is Qualified
1
567.2
Runs Created
576.1
4.4
Runs Created Per 27 Outs
4.5
.085
Walks Per Plate Appearance
.086
0.38
Walk To Strikeout Ratio
0.40
.161
Isolated Power
.160
.275
Secondary Average
.266
3.89
Pitches Per Plate Appearance
3.86
366
Extra Base Hits
381
4888
Plate Appearances
4916
27.8
At Bats Per Home Run
29.2
11
Sacrifice Hit
7
46
Sacrifice Flies
36
Pitching
130
Team Games Played
130
56
Quality Starts
43
72
Wins
63
58
Losses
67
35
Saves
37
57
Holds
89
1110
Hits
1110
527
Earned runs
592
153
Home Runs
149
393
Walks
473
1281
Strikeouts
1076
10.0
Strikeouts Per 9 Innings
8.4
149.4
Pitches Per Start
150.0
1.30
Walks Plus Hits Per Inning Pitched
1.38
4.11
Earned Run Average
4.65
58
Losses
67
1154.2
Innings pitched
1146.2
.554
Win Percentage
.485
52
Save Opportunities
52
.250
Opponent Batting Average
.252
.317
Opponent's On-base pct.
.330
.406
Opponent's Slugging pct.
.412
.723
Opponent's OPB Pct + SLG Pct
.742
4440
At Bats
4401
187
Doubles
226
23
Triples
16
57
Batters Hit
55
76
Stolen Bases
109
130
Games Played
130
1
Complete Games
1
15
Shutouts
3
32
Wild Pitches
34
541
Runs Batted In
617
3
Balks
6
1154.2
Innings pitched
1146.2
10.0
Strikeouts Per 9 Innings
8.4
34
Caught Stealing
19
130
Games Started
130
0.0
Wins Above Replacement
0.0
1
Is Qualified
1
568
Runs
646
527
Earned Runs
592
1802
Total Bases
1815
Fielding
130
Team Games Played
130
1155
Full Innings
1147
4596
Total Chances
4492
3464
Putouts
3440
1066
Assists
991
66
Errors
61
188
Double Plays
212
0.986
Fielding Percentage
0.986
35.3
Range Factor
34.8
0.0
Zone Rating
0.0
130
Games Played
130
0
Games Started
0
0.0
Defensive Wins Above Replacement
0.0
1
Qualified
1