

Pirates vs Cardinals Live Score (21 May, 2026)
Game Information
Stage
Standard
Season
2026
First Pitch
Thu, May 21, 1:15 pm
Venue
Busch Stadium
Location
St. Louis, Missouri
Attendance
27,705
Live Situation
0Balls
0Strikes
0Outs
—Pitcher
—At Bat
Pitch Sequence
1
BALL IN PLAY
Changeup
92 MPH
Injury Report





Team Stats
 PIT
STL


6
Runs
2
10
Hits
8
0
Errors
0
2
Home Runs
1
2
Walks
2
9
Strikeouts
11
Player Box Score
Pittsburgh Pirates
| Player | H-AB | AB | R | H | RBI | HR | BB | K | #P | AVG | OBP | SLG |
|---|---|---|---|---|---|---|---|---|---|---|---|---|
 Oneil Cruz | 1-5 | 5 | 1 | 1 | 0 | 0 | 0 | 3 | 20 | .257 | .324 | .455 |
 Brandon Lowe | 2-4 | 4 | 1 | 2 | 1 | 1 | 1 | 0 | 18 | .256 | .348 | .558 |
 Bryan Reynolds | 0-5 | 5 | 0 | 0 | 1 | 0 | 0 | 3 | 14 | .244 | .372 | .378 |
 Spencer Horwitz | 1-3 | 3 | 1 | 1 | 0 | 0 | 1 | 0 | 19 | .277 | .384 | .431 |
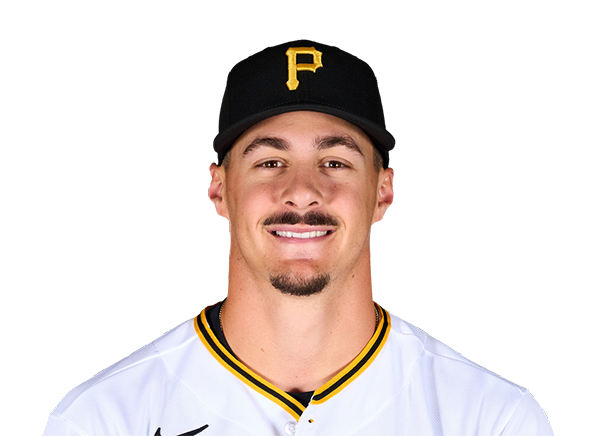 Konnor Griffin | 1-4 | 4 | 2 | 1 | 0 | 0 | 0 | 0 | 8 | .278 | .331 | .407 |
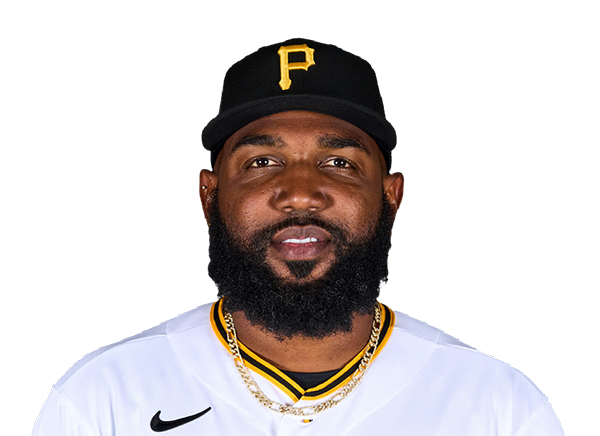 Marcell Ozuna | 2-4 | 4 | 0 | 2 | 2 | 0 | 0 | 0 | 15 | .187 | .280 | .310 |
 Jake Mangum | 1-4 | 4 | 0 | 1 | 1 | 0 | 0 | 1 | 14 | .259 | .330 | .282 |
 Jared Triolo | 1-4 | 4 | 0 | 1 | 0 | 0 | 0 | 1 | 13 | .259 | .306 | .293 |
 Henry Davis | 1-3 | 3 | 1 | 1 | 1 | 1 | 0 | 1 | 14 | .143 | .250 | .265 |
St. Louis Cardinals
| Player | H-AB | AB | R | H | RBI | HR | BB | K | #P | AVG | OBP | SLG |
|---|---|---|---|---|---|---|---|---|---|---|---|---|
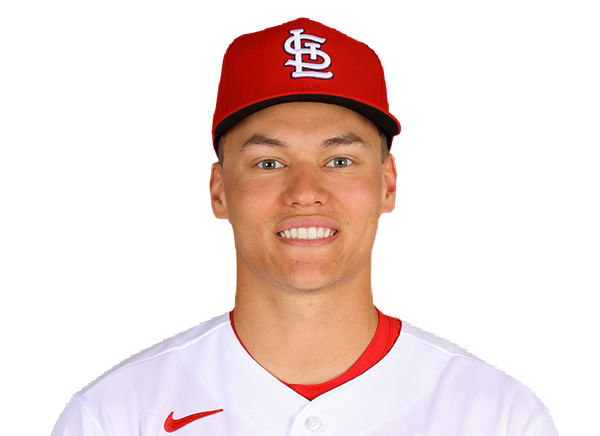 JJ Wetherholt | 0-4 | 4 | 0 | 0 | 0 | 0 | 0 | 2 | 25 | .239 | .357 | .413 |
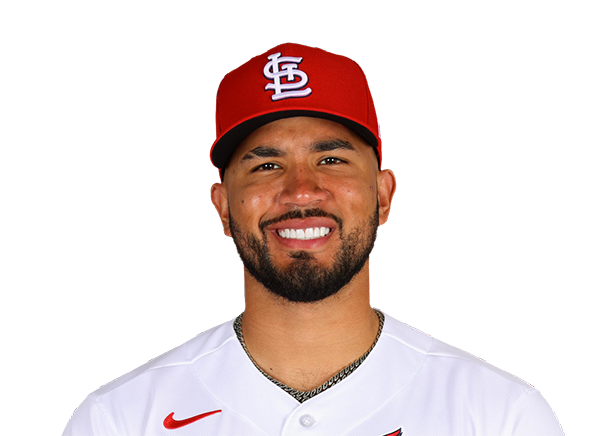 Ivan Herrera | 2-4 | 4 | 2 | 2 | 1 | 1 | 0 | 2 | 15 | .262 | .386 | .426 |
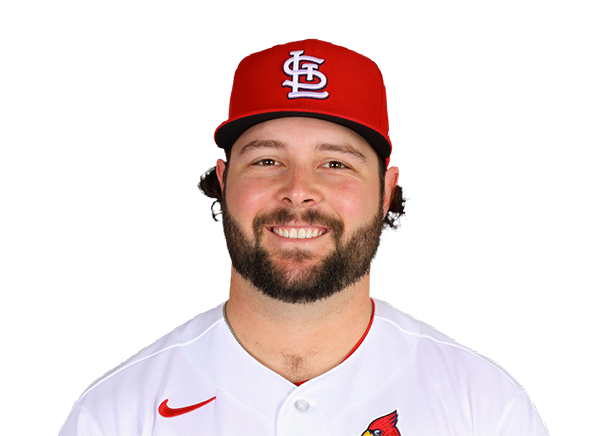 Alec Burleson | 2-4 | 4 | 0 | 2 | 0 | 0 | 0 | 2 | 15 | .290 | .359 | .468 |
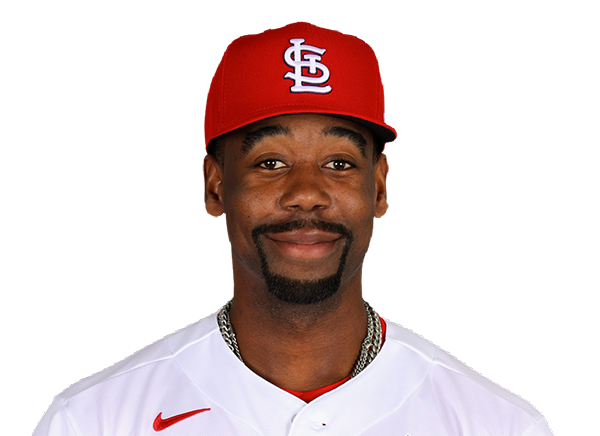 Jordan Walker | 1-4 | 4 | 0 | 1 | 1 | 0 | 0 | 1 | 12 | .295 | .366 | .563 |
 Nolan Gorman | 0-4 | 4 | 0 | 0 | 0 | 0 | 0 | 3 | 14 | .228 | .313 | .367 |
 Masyn Winn | 0-2 | 2 | 0 | 0 | 0 | 0 | 2 | 1 | 18 | .245 | .328 | .340 |
 Jose Fermin | 1-4 | 4 | 0 | 1 | 0 | 0 | 0 | 0 | 10 | .218 | .302 | .327 |
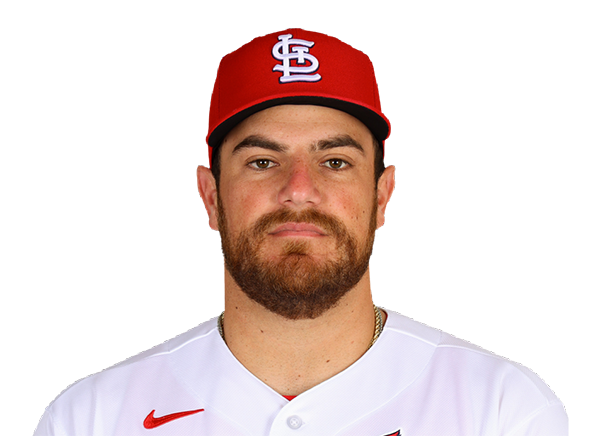 Pedro Pages | 2-4 | 4 | 0 | 2 | 0 | 0 | 0 | 0 | 18 | .219 | .265 | .362 |
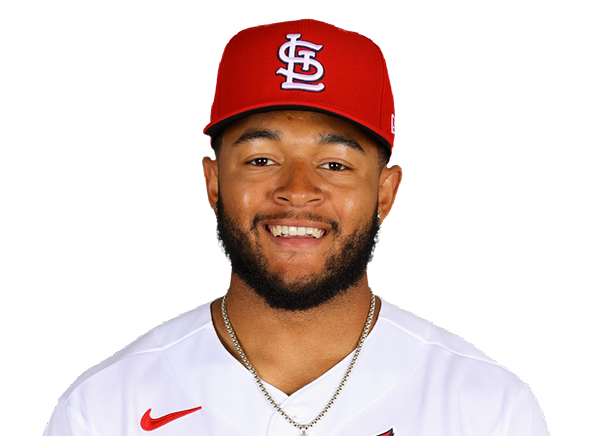 Victor Scott II | 0-3 | 3 | 0 | 0 | 0 | 0 | 0 | 0 | 8 | .185 | .240 | .261 |
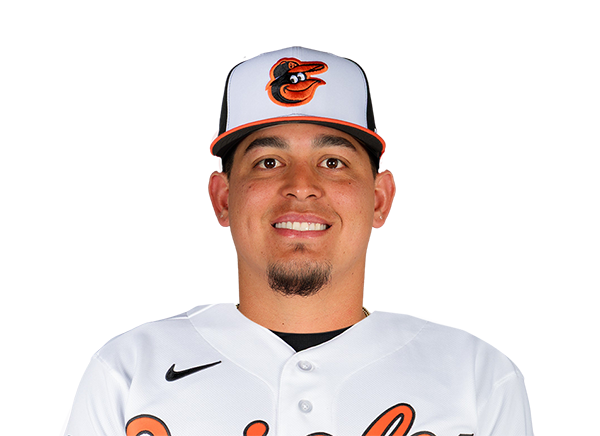 Yohel Pozo | 0-1 | 1 | 0 | 0 | 0 | 0 | 0 | 0 | 1 | .250 | .250 | .286 |
Pittsburgh Pirates
| Player | IP | H | R | ER | BB | K | HR | PC-ST | ERA | PC |
|---|---|---|---|---|---|---|---|---|---|---|
 Braxton Ashcraft | 7.0 | 4 | 1 | 1 | 2 | 9 | 1 | 98-68 | 2.89 | 98 |
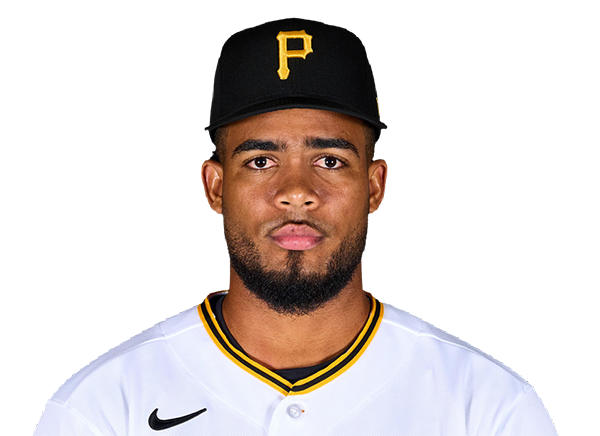 Wilber Dotel | 1.0 | 3 | 1 | 1 | 0 | 2 | 0 | 30-21 | 2.35 | 30 |
 Mason Montgomery | 1.0 | 1 | 0 | 0 | 0 | 0 | 0 | 8-7 | 3.79 | 8 |
St. Louis Cardinals
| Player | IP | H | R | ER | BB | K | HR | PC-ST | ERA | PC |
|---|---|---|---|---|---|---|---|---|---|---|
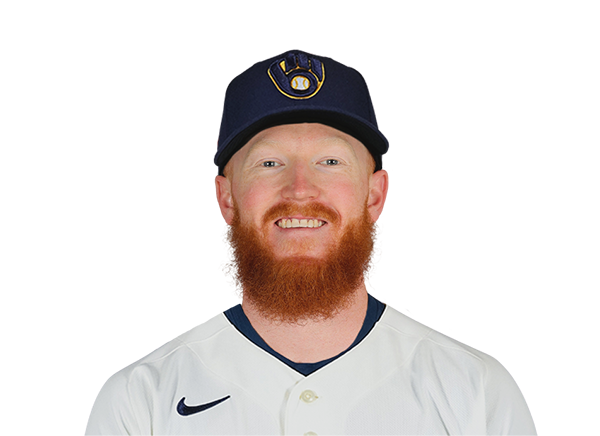 Dustin May | 5.1 | 6 | 4 | 4 | 2 | 7 | 1 | 91-62 | 5.00 | 91 |
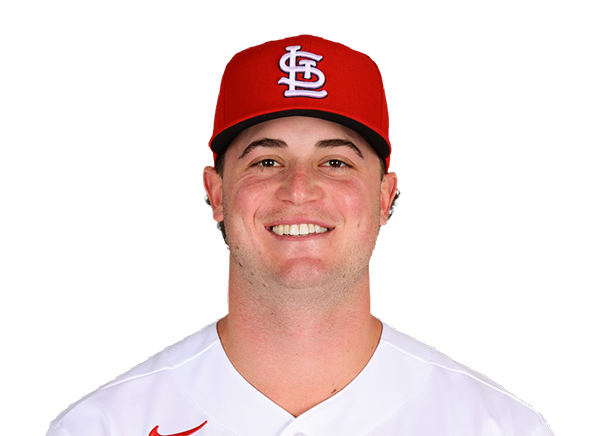 Gordon Graceffo | 0.2 | 0 | 0 | 0 | 0 | 0 | 0 | 2-2 | 1.69 | 2 |
 Justin Bruihl | 0.2 | 3 | 2 | 2 | 0 | 0 | 1 | 16-11 | 5.24 | 16 |
 Matt Svanson | 1.1 | 1 | 0 | 0 | 0 | 1 | 0 | 19-13 | 9.12 | 19 |
 Matt Pushard | 1.0 | 0 | 0 | 0 | 0 | 1 | 0 | 7-6 | 6.23 | 7 |
H2H / Season Series
STL2–6
PIT
STL0–7
PIT
STL9–6
PIT
PIT5–10
STL
PIT4–5
STL
PIT7–11
STL
PIT2–4
STL
PIT2–3
STL
STL1–6
PIT
Last 5 Games
| Date | Opponent | Result |
|---|---|---|
| Aug 22 |  @ LAD | L3–4 |
| Aug 21 | @ LAD | L4–5 |
| Aug 19 |  vs DET | W4–3 |
| Aug 18 | vs DET | W4–1 |
| Aug 17 | vs DET | L5–8 |
| Date | Opponent | Result |
|---|---|---|
| Aug 22 |  @ PHI | L3–12 |
| Aug 21 | @ PHI | L6–7 |
| Aug 20 |  @ CIN | W10–9 |
| Aug 19 | @ CIN | L4–5 |
| Aug 18 | @ CIN | W3–0 |
Standings
American League
| Team | W | L | PCT | GB | DIFF | STRK |
|---|---|---|---|---|---|---|
1 Rays | 76 | 53 | .589 | - | +42 | L3 |
2 White Sox | 67 | 62 | .519 | 9 | +42 | L1 |
3 Astros | 65 | 65 | .500 | 11.5 | -43 | L1 |
4 Yankees | 73 | 56 | .566 | 3 | +95 | L1 |
5 Red Sox | 70 | 59 | .543 | 6 | +98 | W2 |
6 Rangers | 64 | 66 | .492 | 12.5 | -48 | L1 |
7 Guardians | 64 | 66 | .492 | 12.5 | -14 | W3 |
8 Blue Jays | 64 | 67 | .489 | 13 | -50 | W1 |
9 Twins | 63 | 66 | .488 | 13 | -45 | L1 |
10 Orioles | 63 | 67 | .485 | 13.5 | -33 | W2 |
11 Mariners | 62 | 68 | .477 | 14.5 | -44 | W2 |
| 12Tigers | 61 | 68 | .473 | 15 | +77 | L4 |
13 Royals | 57 | 74 | .435 | 20 | -95 | W7 |
14 Angels | 52 | 78 | .400 | 24.5 | -68 | W1 |
15 Athletics | 50 | 80 | .385 | 26.5 | -188 | W1 |
National League
| Team | W | L | PCT | GB | DIFF | STRK |
|---|---|---|---|---|---|---|
1 Brewers | 81 | 49 | .623 | - | +163 | W3 |
| 2Dodgers | 79 | 51 | .608 | 2 | +147 | W5 |
3 Braves | 75 | 55 | .577 | 6 | +108 | L2 |
4 Cubs | 74 | 56 | .569 | 7 | +98 | L3 |
| 5Phillies | 72 | 58 | .554 | 9 | +25 | W8 |
6 Padres | 69 | 60 | .535 | 11.5 | +7 | W1 |
7 Diamondbacks | 68 | 62 | .523 | 13 | +7 | L1 |
8 Marlins | 66 | 64 | .508 | 15 | +17 | W2 |
| 9Cardinals | 66 | 65 | .504 | 15.5 | 0 | L2 |
| 10Pirates | 63 | 68 | .481 | 18.5 | +29 | L2 |
| 11Reds | 62 | 68 | .477 | 19 | -92 | W1 |
12 Nationals | 61 | 70 | .466 | 20.5 | +14 | L3 |
13 Mets | 59 | 71 | .454 | 22 | -39 | W1 |
14 Giants | 52 | 77 | .403 | 28.5 | -79 | L3 |
15 Rockies | 50 | 79 | .388 | 30.5 | -131 | L5 |
PIT
VS
STL
Pitchers
Braxton Ashcraft
Wilber Dotel
Mason Montgomery
Catchers
Henry Davis
Infielders
Brandon Lowe
Spencer Horwitz
Konnor Griffin
Jared Triolo
Outfielders
Oneil Cruz
Bryan Reynolds
Jake Mangum
Designated Hitters
Marcell Ozuna
Pitchers
Dustin May
Gordon Graceffo
Justin Bruihl
Matt Svanson
Matt Pushard
Catchers
Pedro Pages
Infielders
JJ Wetherholt
Alec Burleson
Nolan Gorman
Masyn Winn
Outfielders
Jordan Walker
Jose Fermin
Victor Scott II
Designated Hitters
Ivan Herrera
Other Players
Yohel Pozo
Pirates
VS
Cardinals
Batting
130
Team Games Played
130
4482
At Bats
4364
1144
Hits
1052
620
Runs Batted In
563
156
Home Runs
135
108
Stolen Bases
80
.255
Batting Average
.241
650
Runs
578
201
Doubles
186
13
Triples
13
1839
Total Bases
1669
463
Walks
426
1222
Strikeouts
1012
.332
On Base Percentage
.318
.410
Slugging Percentage
.382
.743
OBP Pct + SLG Pct
.700
130
Games Played
130
130
Games Started
130
69
Hit By Pitch
83
0.0
Wins Above Replacement
0.0
0.0
Offensive Wins Above Replacement
0.0
20
Caught Stealing
22
1
Is Qualified
1
623.8
Runs Created
541.6
4.8
Runs Created Per 27 Outs
4.2
.092
Walks Per Plate Appearance
.086
0.38
Walk To Strikeout Ratio
0.42
.155
Isolated Power
.141
.278
Secondary Average
.252
3.91
Pitches Per Plate Appearance
3.86
370
Extra Base Hits
334
5054
Plate Appearances
4936
28.7
At Bats Per Home Run
32.3
7
Sacrifice Hit
19
30
Sacrifice Flies
42
Pitching
130
Team Games Played
130
39
Quality Starts
47
63
Wins
66
67
Losses
64
25
Saves
38
51
Holds
84
1057
Hits
1100
553
Earned runs
523
134
Home Runs
126
478
Walks
442
1210
Strikeouts
1006
9.4
Strikeouts Per 9 Innings
7.8
150.9
Pitches Per Start
148.8
1.32
Walks Plus Hits Per Inning Pitched
1.33
4.29
Earned Run Average
4.06
67
Losses
64
1160.1
Innings pitched
1159.1
.485
Win Percentage
.508
45
Save Opportunities
62
.240
Opponent Batting Average
.251
.322
Opponent's On-base pct.
.325
.391
Opponent's Slugging pct.
.392
.713
Opponent's OPB Pct + SLG Pct
.717
4406
At Bats
4389
236
Doubles
222
13
Triples
11
70
Batters Hit
58
79
Stolen Bases
89
130
Games Played
130
1
Complete Games
1
7
Shutouts
9
44
Wild Pitches
52
582
Runs Batted In
541
4
Balks
3
1160.1
Innings pitched
1159.1
9.4
Strikeouts Per 9 Innings
7.8
27
Caught Stealing
21
130
Games Started
130
0.0
Wins Above Replacement
0.0
1
Is Qualified
1
620
Runs
569
553
Earned Runs
523
1721
Total Bases
1722
Fielding
130
Team Games Played
130
1160
Full Innings
1159
4582
Total Chances
4752
3481
Putouts
3478
1019
Assists
1219
82
Errors
55
201
Double Plays
186
0.982
Fielding Percentage
0.988
34.9
Range Factor
36.5
0.0
Zone Rating
0.0
130
Games Played
130
0
Games Started
0
0.0
Defensive Wins Above Replacement
0.0
1
Qualified
1