

Pirates vs Mets Live Score (26 Mar, 2026)
Game Information
Stage
Standard
Season
2026
First Pitch
Thu, Mar 26, 1:15 pm
Venue
Citi Field
Location
Queens, New York
Attendance
41,449
Live Situation
1Balls
3Strikes
0Outs
—Pitcher
—At Bat
Pitch Sequence
1
BALL
Sweeper
79 MPH
2
STRIKE SWINGING
Splitter
86 MPH
3
STRIKE SWINGING
Splitter
87 MPH
4
STRIKE FOUL
Splitter
86 MPH
5
STRIKE SWINGING
Splitter
86 MPH
Injury Report
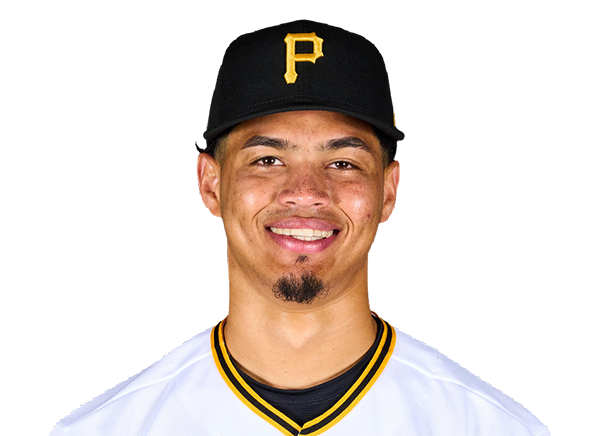
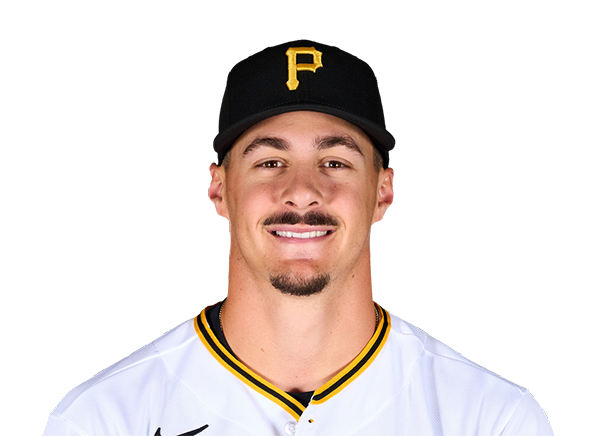

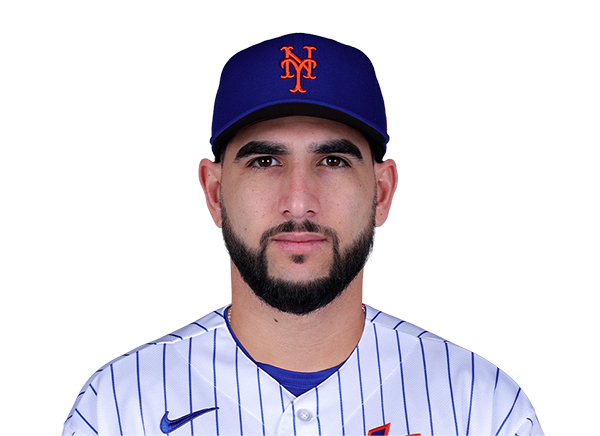
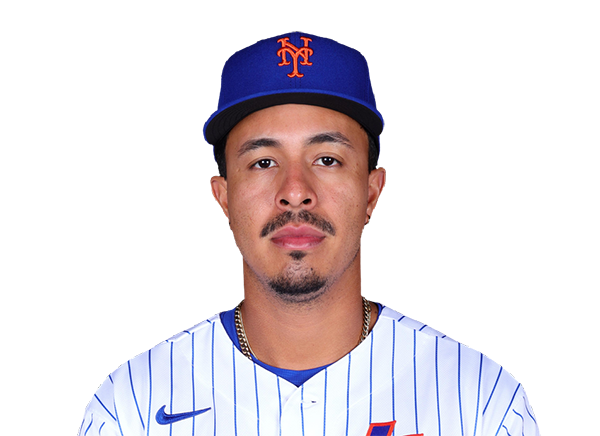
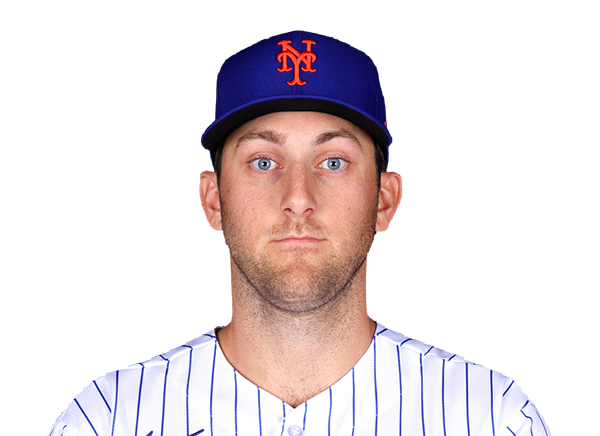
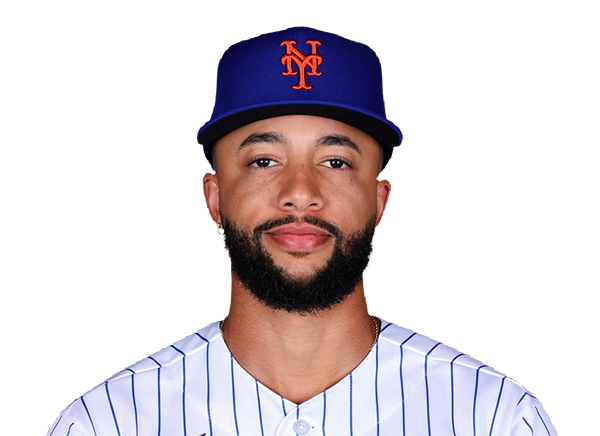
Team Stats
 PIT
NYM


7
Runs
11
10
Hits
11
1
Errors
0
3
Home Runs
2
0
Walks
9
10
Strikeouts
10
Player Box Score
Pittsburgh Pirates
| Player | H-AB | AB | R | H | RBI | HR | BB | K | #P | AVG | OBP | SLG |
|---|---|---|---|---|---|---|---|---|---|---|---|---|
 Oneil Cruz | 1-5 | 5 | 1 | 1 | 0 | 0 | 0 | 3 | 27 | .200 | .200 | .200 |
 Brandon Lowe | 2-4 | 4 | 2 | 2 | 3 | 2 | 0 | 0 | 14 | .500 | .500 | 2.000 |
 Bryan Reynolds | 1-4 | 4 | 0 | 1 | 0 | 0 | 0 | 2 | 15 | .250 | .250 | .250 |
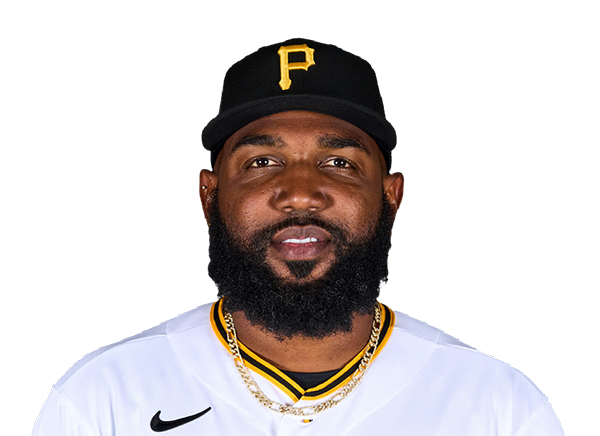 Marcell Ozuna | 0-4 | 4 | 0 | 0 | 0 | 0 | 0 | 1 | 18 | .000 | .000 | .000 |
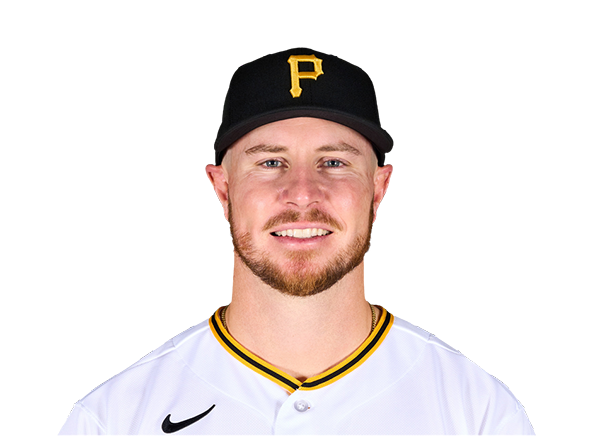 Ryan O'Hearn | 2-4 | 4 | 2 | 2 | 1 | 1 | 0 | 1 | 17 | .500 | .500 | 1.250 |
 Jared Triolo | 1-4 | 4 | 1 | 1 | 0 | 0 | 0 | 1 | 15 | .250 | .250 | .500 |
 Spencer Horwitz | 0-4 | 4 | 0 | 0 | 0 | 0 | 0 | 1 | 12 | .000 | .000 | .000 |
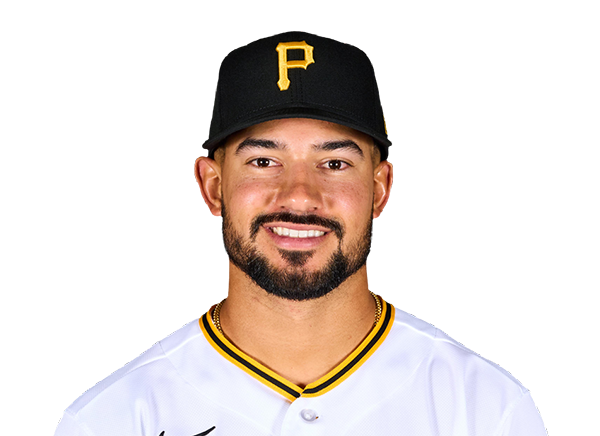 Nick Gonzales | 2-4 | 4 | 1 | 2 | 2 | 0 | 0 | 1 | 12 | .500 | .500 | .750 |
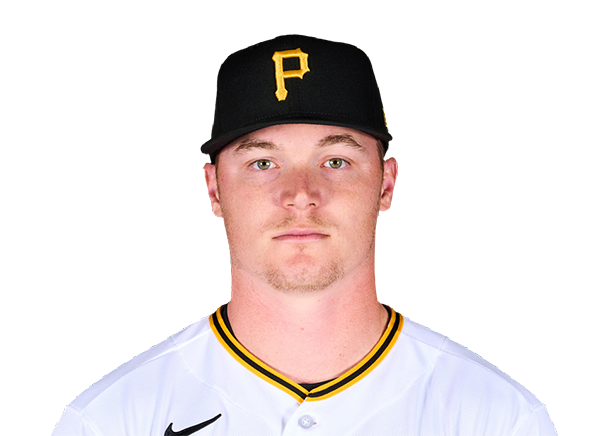 Henry Davis | 1-4 | 4 | 0 | 1 | 1 | 0 | 0 | 0 | 9 | .250 | .250 | .500 |
New York Mets
| Player | H-AB | AB | R | H | RBI | HR | BB | K | #P | AVG | OBP | SLG |
|---|---|---|---|---|---|---|---|---|---|---|---|---|
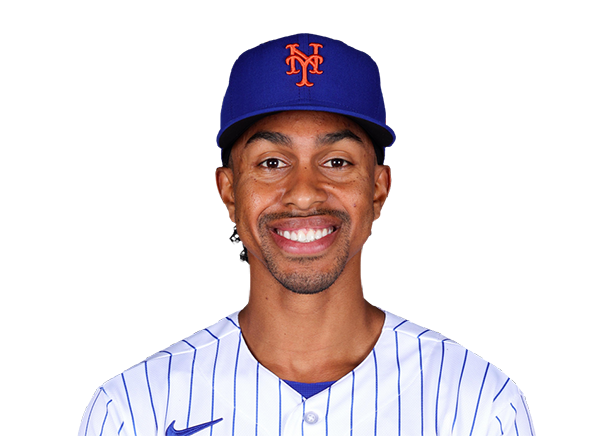 Francisco Lindor | 0-2 | 2 | 3 | 0 | 0 | 0 | 3 | 0 | 25 | .000 | .600 | .000 |
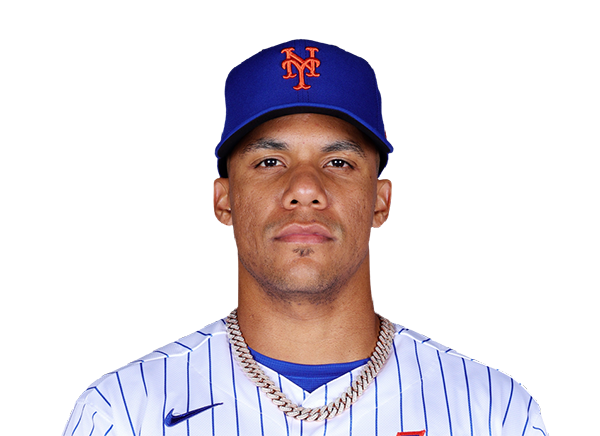 Juan Soto | 2-4 | 4 | 1 | 2 | 1 | 0 | 1 | 0 | 20 | .500 | .600 | .500 |
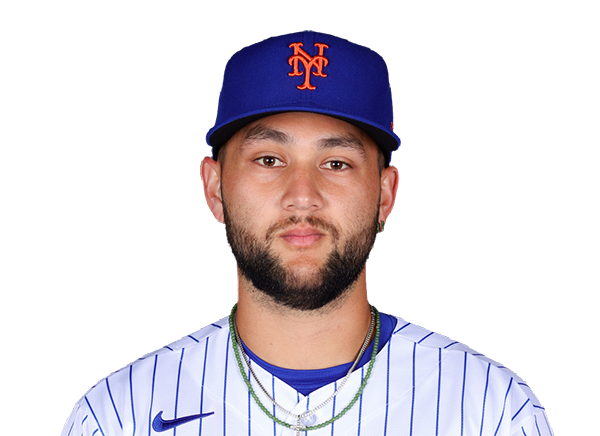 Bo Bichette | 0-4 | 4 | 0 | 0 | 1 | 0 | 0 | 3 | 26 | .000 | .000 | .000 |
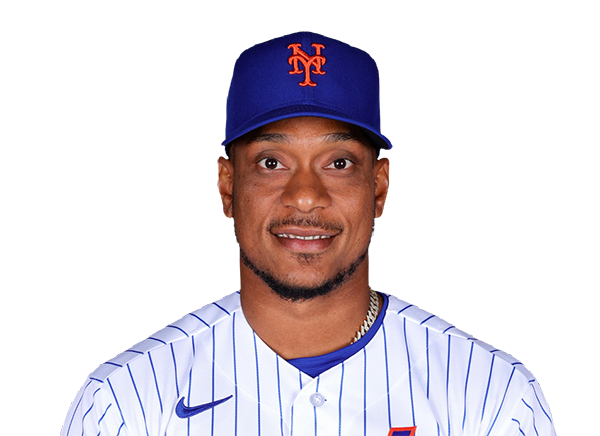 Jorge Polanco | 1-3 | 3 | 1 | 1 | 1 | 0 | 2 | 1 | 18 | .333 | .600 | .333 |
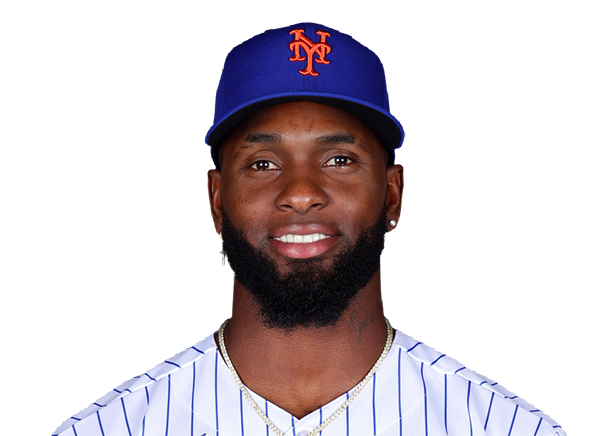 Luis Robert Jr. | 2-4 | 4 | 1 | 2 | 2 | 0 | 1 | 1 | 25 | .500 | .600 | .500 |
 Brett Baty | 1-5 | 5 | 1 | 1 | 3 | 0 | 0 | 2 | 25 | .200 | .200 | .600 |
 Marcus Semien | 2-5 | 5 | 0 | 2 | 1 | 0 | 0 | 1 | 11 | .400 | .400 | .600 |
 Carson Benge | 1-3 | 3 | 2 | 1 | 1 | 1 | 2 | 2 | 23 | .333 | .600 | 1.333 |
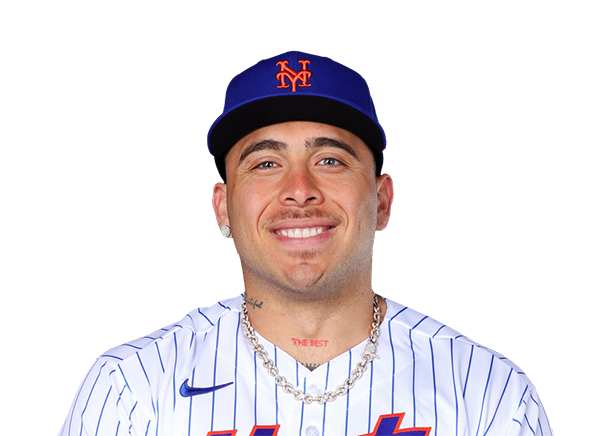 Francisco Alvarez | 2-4 | 4 | 2 | 2 | 1 | 1 | 0 | 0 | 19 | .500 | .600 | 1.250 |
Pittsburgh Pirates
| Player | IP | H | R | ER | BB | K | HR | PC-ST | ERA | PC |
|---|---|---|---|---|---|---|---|---|---|---|
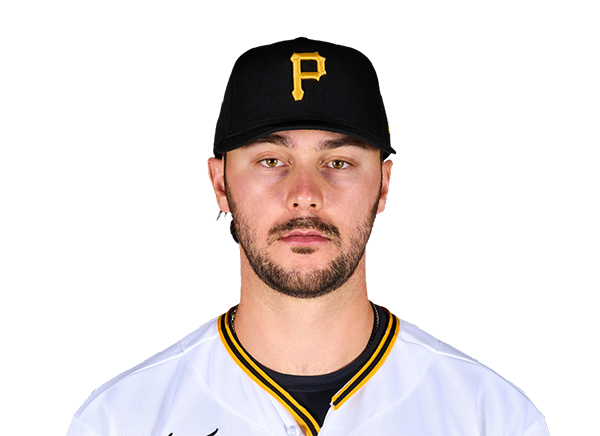 Paul Skenes | 0.2 | 4 | 5 | 5 | 2 | 1 | 0 | 37-26 | -- | 37 |
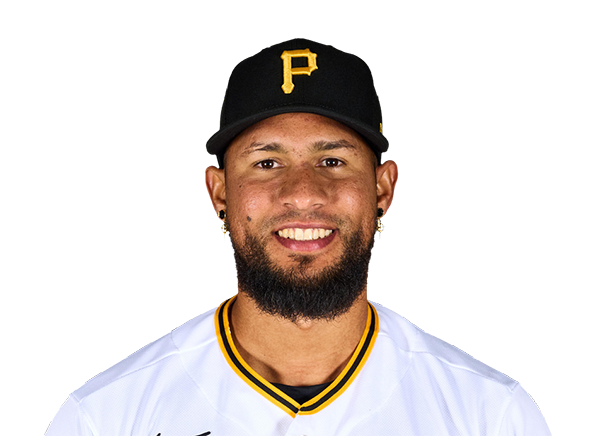 Yohan Ramirez | 2.1 | 1 | 0 | 0 | 1 | 3 | 0 | 37-22 | -- | 37 |
 Mason Montgomery | 1.1 | 1 | 2 | 2 | 3 | 2 | 0 | 42-23 | -- | 42 |
 Isaac Mattson | 0.2 | 3 | 2 | 2 | 2 | 1 | 0 | 36-21 | -- | 36 |
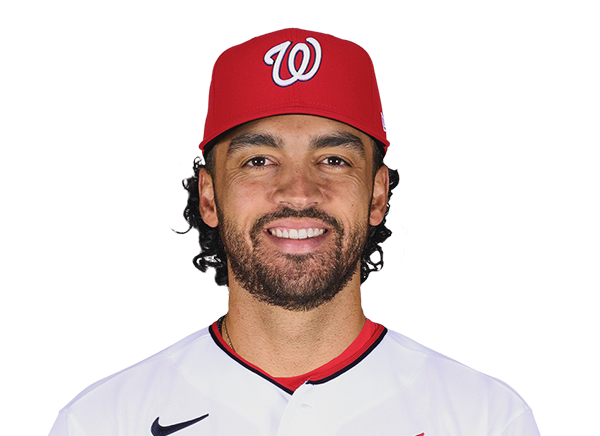 Justin Lawrence | 1.0 | 2 | 2 | 2 | 0 | 0 | 2 | 14-10 | -- | 14 |
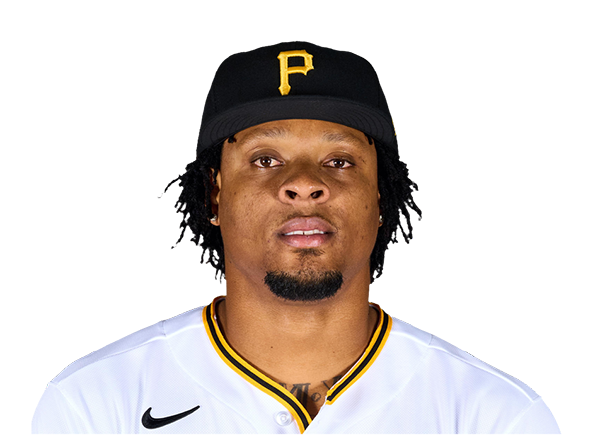 Gregory Soto | 1.0 | 0 | 0 | 0 | 0 | 2 | 0 | 8-8 | -- | 8 |
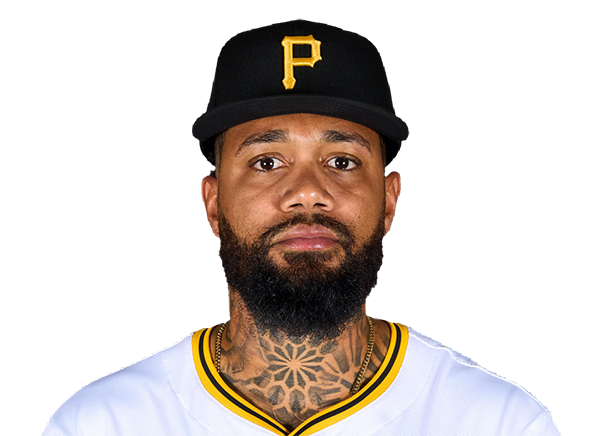 Dennis Santana | 1.0 | 0 | 0 | 0 | 1 | 1 | 0 | 18-11 | -- | 18 |
New York Mets
| Player | IP | H | R | ER | BB | K | HR | PC-ST | ERA | PC |
|---|---|---|---|---|---|---|---|---|---|---|
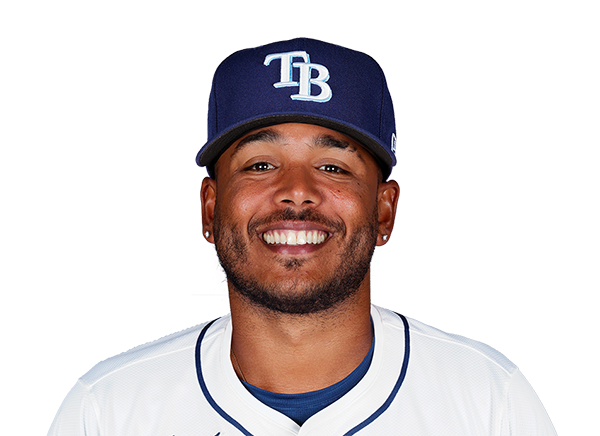 Freddy Peralta | 5.0 | 6 | 4 | 4 | 0 | 7 | 2 | 80-53 | -- | 80 |
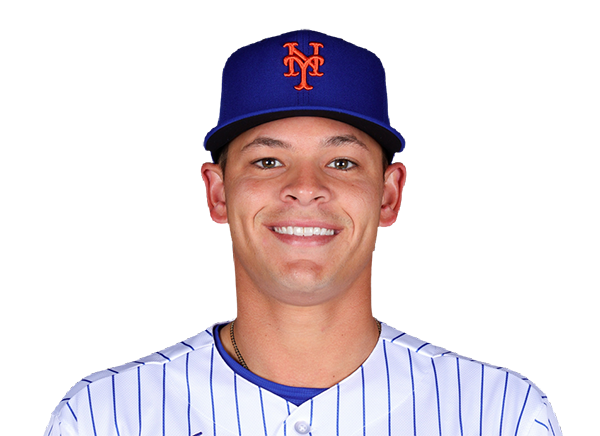 Tobias Myers | 3.0 | 1 | 1 | 1 | 0 | 1 | 1 | 39-22 | -- | 39 |
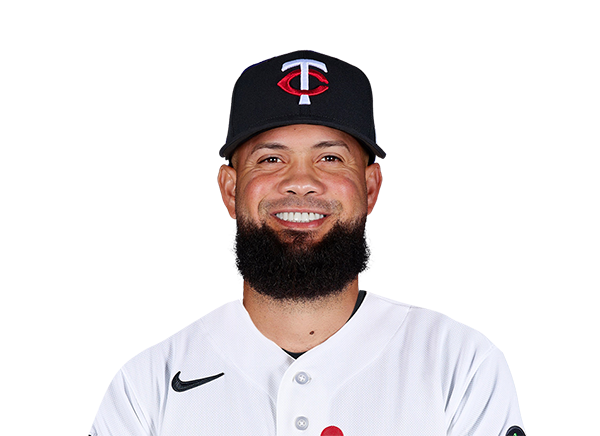 Luis Garcia | 1.0 | 3 | 2 | 2 | 0 | 2 | 0 | 20-16 | -- | 20 |
H2H / Season Series
PIT1–11
NYM
PIT9–0
NYM
PIT4–6
NYM
NYM3–4
PIT
NYM4–2
PIT
NYM11–7
PIT
Last 5 Games
| Date | Opponent | Result |
|---|---|---|
| Aug 23 |  @ LAD | L0–4 |
| Aug 22 | @ LAD | L3–4 |
| Aug 21 | @ LAD | L4–5 |
| Aug 19 |  vs DET | W4–3 |
| Aug 18 | vs DET | W4–1 |
| Date | Opponent | Result |
|---|---|---|
| Aug 23 |  @ CHW | L1–2 |
| Aug 22 | @ CHW | W10–5 |
| Aug 21 | @ CHW | L4–6 |
| Aug 19 |  vs SD | W4–2 |
| Aug 18 | vs SD | L2–5 |
Standings
American League
| Team | W | L | PCT | GB | DIFF | STRK |
|---|---|---|---|---|---|---|
1 Rays | 77 | 53 | .592 | - | +44 | W1 |
| 2White Sox | 68 | 62 | .523 | 9 | +43 | W1 |
3 Astros | 65 | 66 | .496 | 12.5 | -44 | L2 |
4 Yankees | 74 | 56 | .569 | 3 | +100 | W1 |
5 Red Sox | 71 | 59 | .546 | 6 | +99 | W3 |
6 Rangers | 65 | 66 | .496 | 12.5 | -46 | W1 |
7 Guardians | 65 | 66 | .496 | 12.5 | -9 | W4 |
8 Blue Jays | 64 | 68 | .485 | 14 | -55 | L1 |
9 Twins | 63 | 68 | .481 | 14.5 | -54 | L3 |
10 Orioles | 63 | 68 | .481 | 14.5 | -35 | L1 |
11 Mariners | 62 | 69 | .473 | 15.5 | -61 | L1 |
| 12Tigers | 61 | 69 | .469 | 16 | +73 | L5 |
13 Royals | 58 | 74 | .439 | 20 | -91 | W8 |
14 Angels | 52 | 79 | .397 | 25.5 | -70 | L1 |
15 Athletics | 51 | 80 | .389 | 26.5 | -187 | W2 |
National League
| Team | W | L | PCT | GB | DIFF | STRK |
|---|---|---|---|---|---|---|
1 Brewers | 81 | 50 | .618 | - | +161 | L1 |
| 2Dodgers | 80 | 51 | .611 | 1 | +151 | W6 |
3 Braves | 76 | 55 | .580 | 5 | +110 | W1 |
4 Cubs | 75 | 56 | .573 | 6 | +115 | W1 |
5 Phillies | 73 | 58 | .557 | 8 | +27 | W9 |
| 6Padres | 71 | 60 | .542 | 10 | +16 | W3 |
7 Diamondbacks | 69 | 62 | .527 | 12 | +9 | W1 |
8 Marlins | 67 | 64 | .511 | 14 | +21 | W3 |
9 Cardinals | 66 | 66 | .500 | 15.5 | -2 | L3 |
| 10Pirates | 63 | 69 | .477 | 18.5 | +25 | L3 |
11 Reds | 62 | 69 | .473 | 19 | -94 | L1 |
12 Nationals | 61 | 71 | .462 | 20.5 | +10 | L4 |
| 13Mets | 59 | 72 | .450 | 22 | -40 | L1 |
14 Giants | 52 | 78 | .400 | 28.5 | -80 | L4 |
15 Rockies | 50 | 80 | .385 | 30.5 | -136 | L6 |
PIT
VS
NYM
Pitchers
Paul Skenes
Yohan Ramirez
Mason Montgomery
Isaac Mattson
Justin Lawrence
Gregory Soto
Dennis Santana
Catchers
Henry Davis
Infielders
Brandon Lowe
Jared Triolo
Spencer Horwitz
Nick Gonzales
Outfielders
Oneil Cruz
Bryan Reynolds
Ryan O'Hearn
Designated Hitters
Marcell Ozuna
Pitchers
Freddy Peralta
Tobias Myers
Luis Garcia
Catchers
Francisco Alvarez
Infielders
Francisco Lindor
Bo Bichette
Jorge Polanco
Marcus Semien
Outfielders
Juan Soto
Luis Robert Jr.
Carson Benge
Designated Hitters
Brett Baty
Pirates
VS
Mets
Batting
132
Team Games Played
131
4543
At Bats
4402
1152
Hits
1040
623
Runs Batted In
523
156
Home Runs
161
109
Stolen Bases
68
.254
Batting Average
.236
653
Runs
546
202
Doubles
165
14
Triples
17
1850
Total Bases
1722
468
Walks
420
1247
Strikeouts
1112
.331
On Base Percentage
.307
.407
Slugging Percentage
.391
.738
OBP Pct + SLG Pct
.698
132
Games Played
131
132
Games Started
131
70
Hit By Pitch
42
0.0
Wins Above Replacement
0.0
0.0
Offensive Wins Above Replacement
0.0
20
Caught Stealing
29
1
Is Qualified
1
625.3
Runs Created
531.1
4.8
Runs Created Per 27 Outs
4.1
.091
Walks Per Plate Appearance
.085
0.38
Walk To Strikeout Ratio
0.38
.154
Isolated Power
.155
.276
Secondary Average
.259
3.91
Pitches Per Plate Appearance
3.94
372
Extra Base Hits
343
5122
Plate Appearances
4915
29.1
At Bats Per Home Run
27.3
8
Sacrifice Hit
16
30
Sacrifice Flies
31
Pitching
132
Team Games Played
131
39
Quality Starts
38
63
Wins
59
69
Losses
72
25
Saves
25
51
Holds
57
1070
Hits
1046
561
Earned runs
527
134
Home Runs
145
487
Walks
469
1226
Strikeouts
1183
9.4
Strikeouts Per 9 Innings
9.1
150.8
Pitches Per Start
148.7
1.32
Walks Plus Hits Per Inning Pitched
1.30
4.29
Earned Run Average
4.07
69
Losses
72
1176.1
Innings pitched
1165.2
.477
Win Percentage
.450
45
Save Opportunities
39
.240
Opponent Batting Average
.237
.322
Opponent's On-base pct.
.318
.389
Opponent's Slugging pct.
.394
.711
Opponent's OPB Pct + SLG Pct
.712
4466
At Bats
4410
238
Doubles
217
13
Triples
19
72
Batters Hit
66
81
Stolen Bases
57
132
Games Played
131
1
Complete Games
0
7
Shutouts
5
45
Wild Pitches
32
589
Runs Batted In
560
4
Balks
3
1176.1
Innings pitched
1165.2
9.4
Strikeouts Per 9 Innings
9.1
27
Caught Stealing
27
132
Games Started
131
0.0
Wins Above Replacement
0.0
1
Is Qualified
1
628
Runs
586
561
Earned Runs
527
1736
Total Bases
1736
Fielding
132
Team Games Played
131
1176
Full Innings
1166
4644
Total Chances
4610
3529
Putouts
3497
1032
Assists
1032
83
Errors
81
202
Double Plays
165
0.982
Fielding Percentage
0.982
34.9
Range Factor
35.0
0.0
Zone Rating
0.0
132
Games Played
131
0
Games Started
0
0.0
Defensive Wins Above Replacement
0.0
1
Qualified
1