

Pirates vs White Sox Live Score (10 Sep, 2026)
Game Information
Stage
STD
Season
2026
First Pitch
Thu, Sep 10, 7:40 pm
Venue
Rate Field
Location
Chicago, Illinois
Venue Type
Outdoor
Broadcast
MLB.TV
Attendance
17,741
Live Situation
0Balls
3Strikes
0Outs
—Pitcher
—At Bat
Pitch Sequence
1
STRIKE LOOKING
Curve
84 MPH
2
STRIKE FOUL
Sinker
98 MPH
3
STRIKE FOUL
Four-seam FB
99 MPH
4
STRIKE SWINGING
Four-seam FB
99 MPH
Injury Report





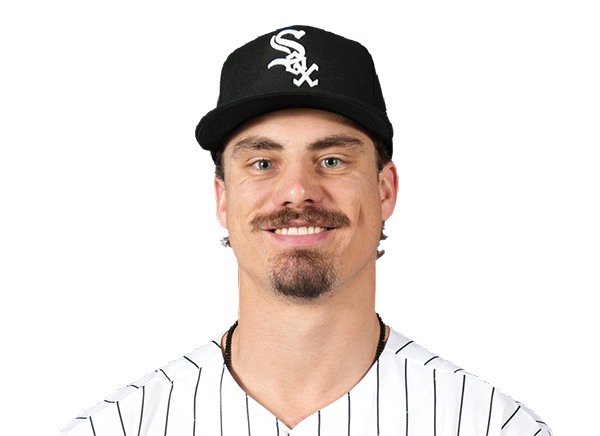


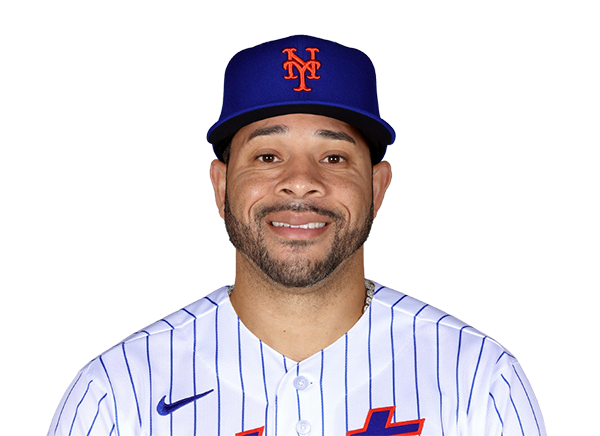
Team Stats
 PIT
CHW


2
Runs
0
7
Hits
2
1
Errors
0
1
Home Runs
0
1
Walks
2
6
Strikeouts
11
Player Box Score
Pittsburgh Pirates
| Player | H-AB | AB | R | H | RBI | HR | BB | K | #P | AVG | OBP | SLG |
|---|---|---|---|---|---|---|---|---|---|---|---|---|
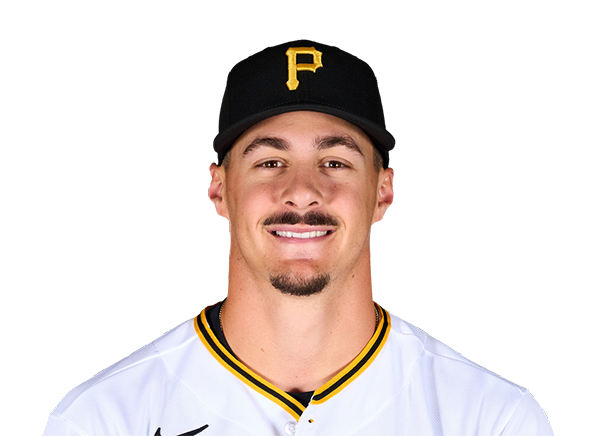 Konnor Griffin | 0-4 | 4 | 0 | 0 | 0 | 0 | 0 | 1 | 23 | .262 | .320 | .383 |
 Oneil Cruz | 3-4 | 4 | 1 | 3 | 2 | 1 | 0 | 0 | 19 | .276 | .362 | .486 |
 Bryan Reynolds | 0-4 | 4 | 0 | 0 | 0 | 0 | 0 | 1 | 18 | .264 | .369 | .426 |
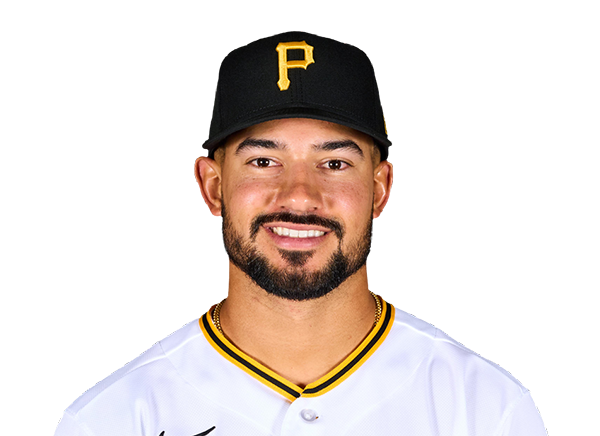 Nick Gonzales | 1-4 | 4 | 0 | 1 | 0 | 0 | 0 | 1 | 17 | .305 | .367 | .393 |
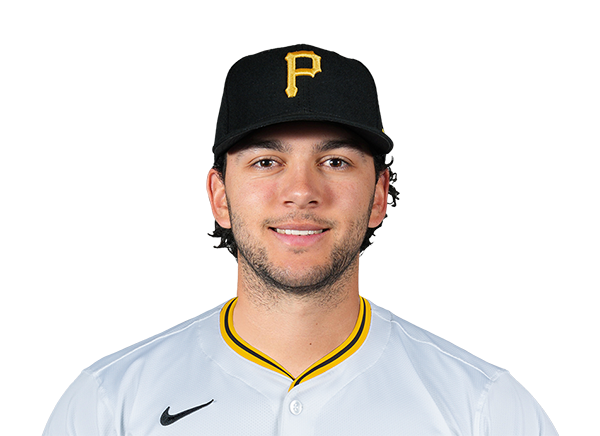 Jacob Gonzalez | 0-0 | 0 | 0 | 0 | 0 | 0 | 0 | 0 | 0 | .223 | .274 | .360 |
 Brandon Lowe | 0-4 | 4 | 0 | 0 | 0 | 0 | 0 | 1 | 15 | .257 | .326 | .476 |
 Rafael Flores Jr. | 1-4 | 4 | 0 | 1 | 0 | 0 | 0 | 2 | 13 | .243 | .314 | .505 |
 Jake Mangum | 0-3 | 3 | 0 | 0 | 0 | 0 | 0 | 0 | 11 | .284 | .341 | .371 |
 Spencer Horwitz | 1-3 | 3 | 0 | 1 | 0 | 0 | 0 | 0 | 9 | .246 | .344 | .369 |
 Jared Triolo | 1-2 | 2 | 1 | 1 | 0 | 0 | 1 | 0 | 14 | .248 | .321 | .318 |
Chicago White Sox
| Player | H-AB | AB | R | H | RBI | HR | BB | K | #P | AVG | OBP | SLG |
|---|---|---|---|---|---|---|---|---|---|---|---|---|
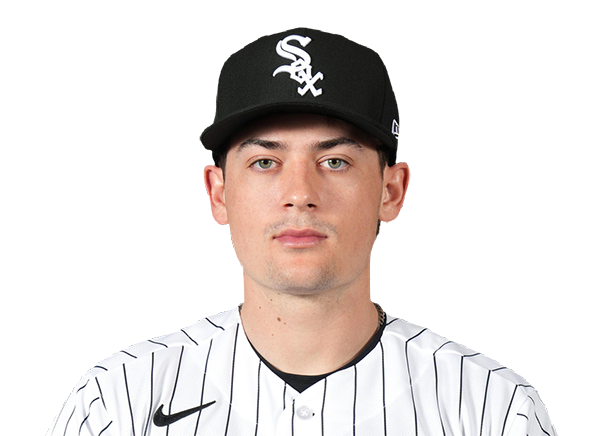 Sam Antonacci | 0-3 | 3 | 0 | 0 | 0 | 0 | 0 | 1 | 13 | .265 | .363 | .387 |
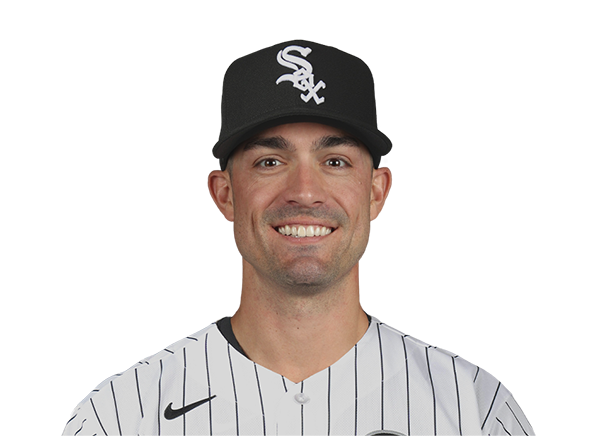 Randal Grichuk | 1-1 | 1 | 0 | 1 | 0 | 0 | 0 | 0 | 2 | .283 | .313 | .557 |
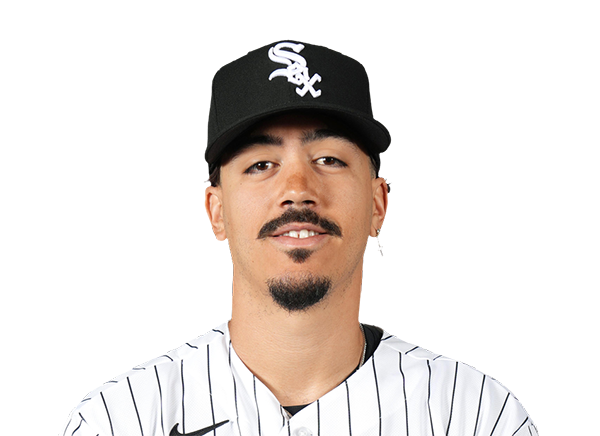 Miguel Vargas | 0-3 | 3 | 0 | 0 | 0 | 0 | 1 | 1 | 19 | .248 | .359 | .477 |
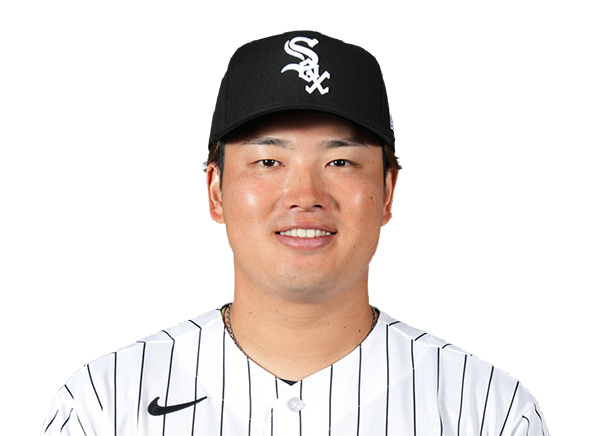 Munetaka Murakami | 0-4 | 4 | 0 | 0 | 0 | 0 | 0 | 1 | 16 | .208 | .346 | .475 |
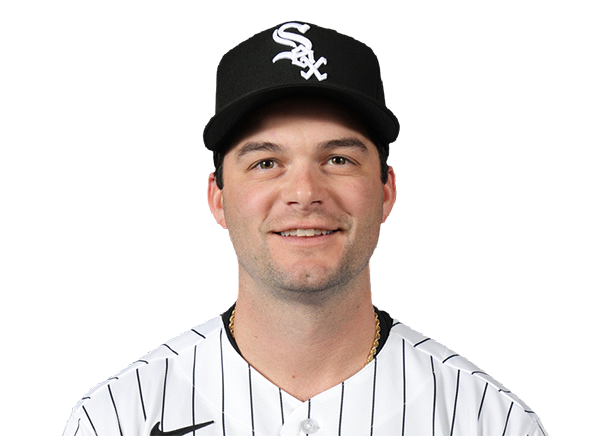 Andrew Benintendi | 0-3 | 3 | 0 | 0 | 0 | 0 | 0 | 1 | 11 | .242 | .304 | .421 |
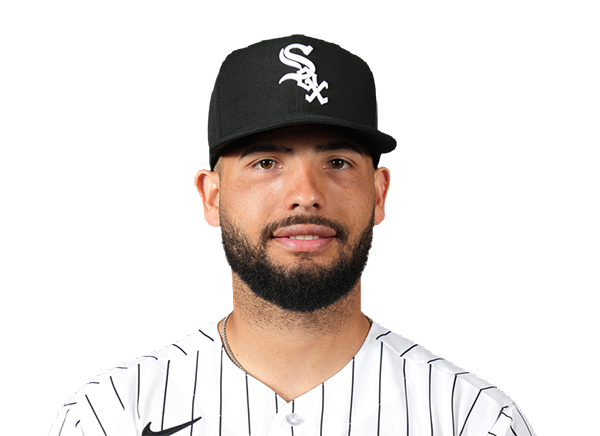 Edgar Quero | 0-1 | 1 | 0 | 0 | 0 | 0 | 0 | 1 | 4 | .205 | .280 | .259 |
 Colson Montgomery | 1-3 | 3 | 0 | 1 | 0 | 0 | 0 | 1 | 13 | .209 | .289 | .432 |
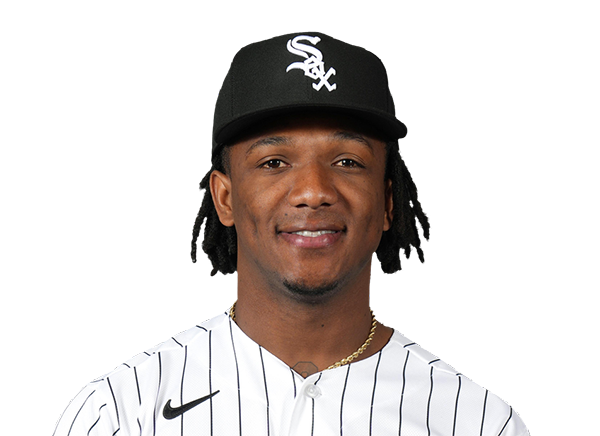 Luisangel Acuna | 0-0 | 0 | 0 | 0 | 0 | 0 | 0 | 0 | 0 | .237 | .268 | .273 |
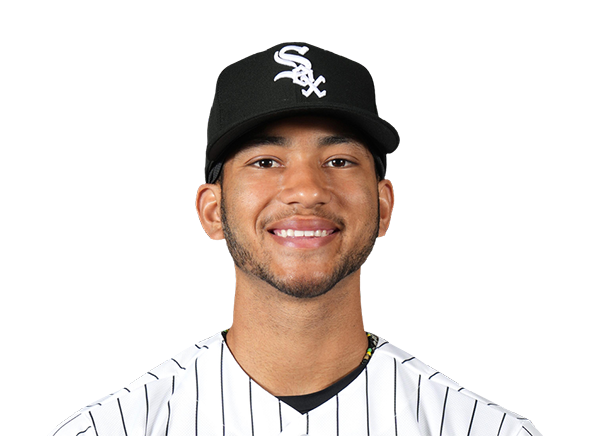 Braden Montgomery | 0-3 | 3 | 0 | 0 | 0 | 0 | 0 | 0 | 6 | .220 | .315 | .354 |
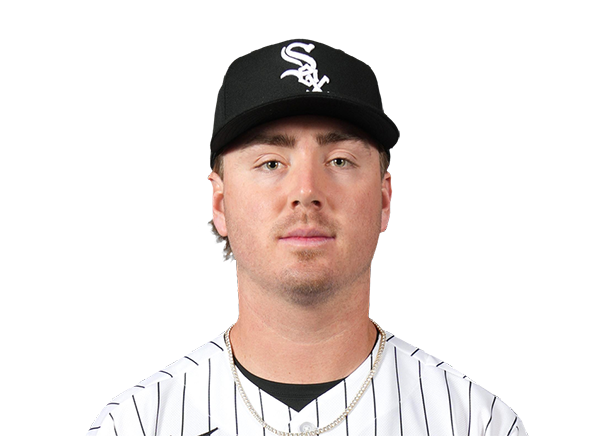 Chase Meidroth | 0-2 | 2 | 0 | 0 | 0 | 0 | 1 | 1 | 11 | .267 | .343 | .390 |
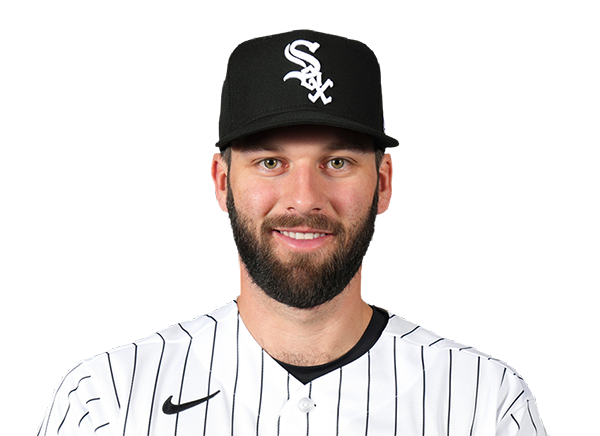 Tristan Peters | 0-3 | 3 | 0 | 0 | 0 | 0 | 0 | 2 | 11 | .281 | .345 | .466 |
 Jake Rogers | 0-2 | 2 | 0 | 0 | 0 | 0 | 0 | 1 | 7 | .167 | .272 | .297 |
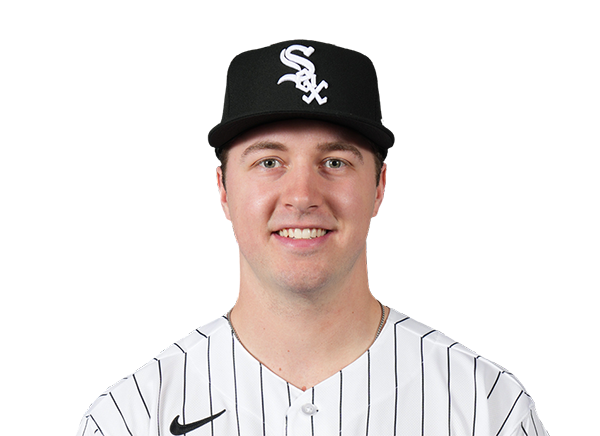 Kyle Teel | 0-1 | 1 | 0 | 0 | 0 | 0 | 0 | 1 | 6 | .192 | .267 | .372 |
Pittsburgh Pirates
| Player | IP | H | R | ER | BB | K | HR | PC-ST | ERA | PC |
|---|---|---|---|---|---|---|---|---|---|---|
 Jared Jones | 7.0 | 1 | 0 | 0 | 2 | 8 | 0 | 90-61 | 4.10 | 90 |
 Luke Weaver | 1.0 | 0 | 0 | 0 | 0 | 2 | 0 | 15-11 | 2.60 | 15 |
 Mason Montgomery | 1.0 | 1 | 0 | 0 | 0 | 1 | 0 | 14-10 | 2.77 | 14 |
Chicago White Sox
| Player | IP | H | R | ER | BB | K | HR | PC-ST | ERA | PC |
|---|---|---|---|---|---|---|---|---|---|---|
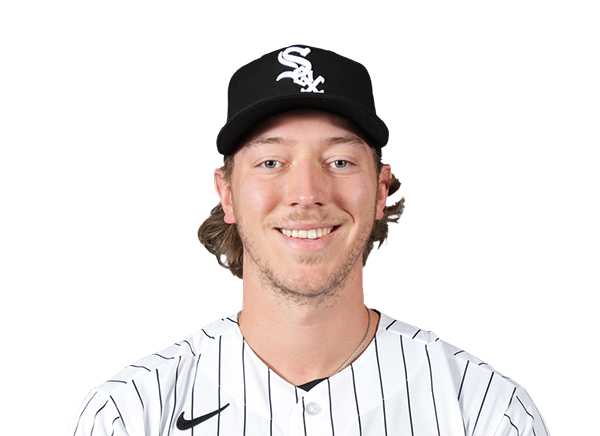 Hagen Smith | 2.0 | 2 | 0 | 0 | 0 | 3 | 0 | 33-21 | 0.50 | 33 |
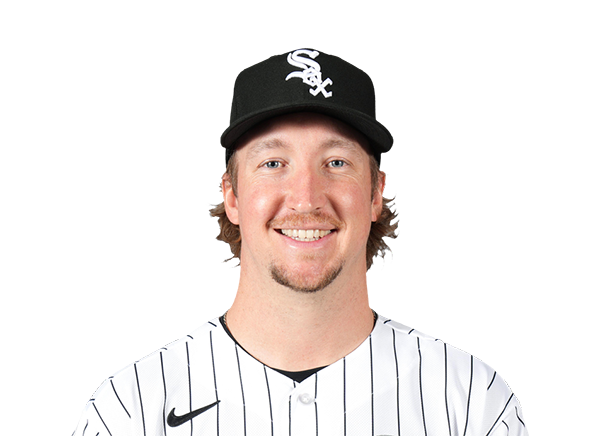 Erick Fedde | 5.1 | 4 | 2 | 2 | 1 | 1 | 1 | 81-49 | 3.97 | 81 |
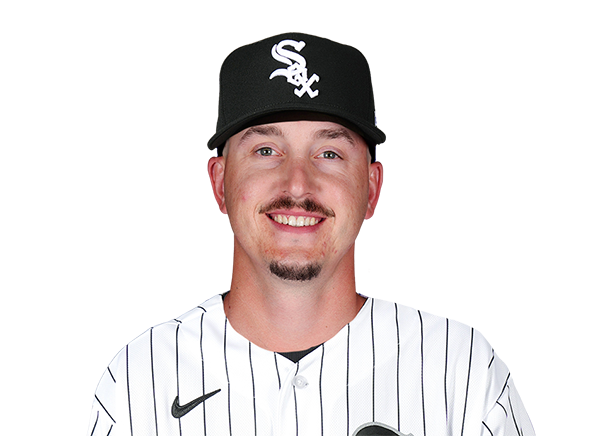 Bryan Hudson | 0.2 | 1 | 0 | 0 | 0 | 0 | 0 | 9-5 | 2.92 | 9 |
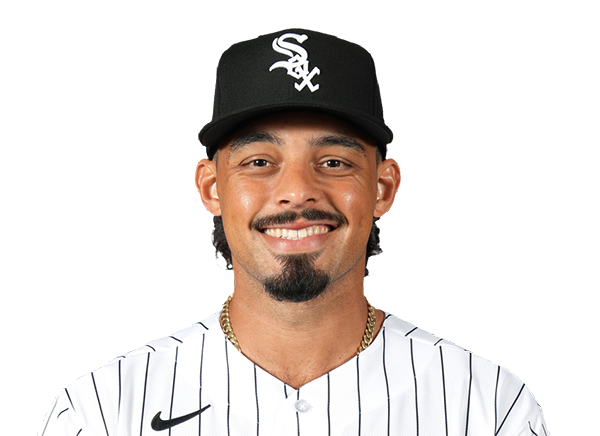 Jordan Hicks | 1.0 | 0 | 0 | 0 | 0 | 2 | 0 | 16-9 | 4.30 | 16 |
H2H / Season Series
CHW0–2
PIT
CHW2–4
PIT
CHW3–9
PIT
Last 5 Games
| Date | Opponent | Result |
|---|---|---|
| Sep 10 | @ CHW | W2–0 |
| Sep 9 | @ CHW | W4–2 |
| Sep 8 | @ CHW | W9–3 |
| Sep 6 |  vs LAA | W1–0 |
| Sep 5 | vs LAA | L1–6 |
| Date | Opponent | Result |
|---|---|---|
| Sep 10 | vs PIT | L0–2 |
| Sep 9 | vs PIT | L2–4 |
| Sep 8 | vs PIT | L3–9 |
| Sep 6 |  vs MIN | W10–1 |
| Sep 5 | vs MIN | L4–6 |
Standings
American League
| Team | W | L | PCT | GB | DIFF | STRK |
|---|---|---|---|---|---|---|
1 Rays | 87 | 59 | .596 | - | +56 | L1 |
| 2White Sox | 75 | 71 | .514 | 12 | +39 | L3 |
3 Astros | 75 | 72 | .510 | 12.5 | -40 | W1 |
4 Yankees | 84 | 62 | .575 | 3 | +131 | W3 |
5 Red Sox | 80 | 67 | .544 | 7.5 | +82 | L2 |
6 Guardians | 74 | 73 | .503 | 13.5 | -16 | L1 |
7 Blue Jays | 73 | 74 | .497 | 14.5 | -39 | L1 |
8 Rangers | 72 | 75 | .490 | 15.5 | -41 | L2 |
9 Orioles | 71 | 76 | .483 | 16.5 | -27 | W1 |
| 10Twins | 69 | 77 | .473 | 18 | -53 | L1 |
11 Mariners | 69 | 78 | .469 | 18.5 | -74 | W2 |
12 Tigers | 67 | 79 | .459 | 20 | +55 | W1 |
13 Royals | 65 | 82 | .442 | 22.5 | -88 | W1 |
14 Athletics | 59 | 88 | .401 | 28.5 | -187 | W1 |
| 15Angels | 56 | 90 | .384 | 31 | -73 | W2 |
National League
| Team | W | L | PCT | GB | DIFF | STRK |
|---|---|---|---|---|---|---|
1 Brewers | 91 | 56 | .619 | - | +172 | W3 |
2 Dodgers | 89 | 57 | .610 | 1.5 | +169 | W7 |
3 Braves | 86 | 61 | .585 | 5 | +110 | W1 |
4 Phillies | 82 | 65 | .558 | 9 | +37 | L1 |
5 Cubs | 81 | 66 | .551 | 10 | +128 | L4 |
6 Padres | 78 | 68 | .534 | 12.5 | +17 | W4 |
7 Diamondbacks | 78 | 69 | .531 | 13 | -1 | L1 |
| 8Pirates | 74 | 73 | .503 | 17 | +36 | W4 |
9 Marlins | 72 | 75 | .490 | 19 | +7 | L3 |
10 Cardinals | 72 | 75 | .490 | 19 | -12 | L3 |
11 Reds | 69 | 77 | .473 | 21.5 | -122 | L3 |
12 Mets | 68 | 78 | .466 | 22.5 | -40 | W4 |
13 Nationals | 67 | 81 | .453 | 24.5 | 0 | L7 |
14 Giants | 62 | 85 | .422 | 29 | -72 | W3 |
15 Rockies | 55 | 91 | .377 | 35.5 | -154 | L4 |
PIT
VS
CHW
Pitchers
Jared Jones
Catchers
Rafael Flores Jr.
Infielders
Nick Gonzales
Brandon Lowe
Spencer Horwitz
Jared Triolo
Outfielders
Oneil Cruz
Bryan Reynolds
Jake Mangum
Designated Hitters
Konnor Griffin
Pitchers
Hagen Smith
Catchers
Jake Rogers
Infielders
Miguel Vargas
Munetaka Murakami
Colson Montgomery
Chase Meidroth
Outfielders
Sam Antonacci
Braden Montgomery
Tristan Peters
Designated Hitters
Andrew Benintendi
Pirates
VS
White Sox
Batting
147
Team Games Played
146
5053
At Bats
4897
1280
Hits
1152
676
Runs Batted In
654
168
Home Runs
190
126
Stolen Bases
80
.253
Batting Average
.235
709
Runs
685
222
Doubles
232
14
Triples
14
2034
Total Bases
1982
520
Walks
522
1376
Strikeouts
1338
.331
On Base Percentage
.317
.403
Slugging Percentage
.405
.733
OBP Pct + SLG Pct
.722
147
Games Played
146
147
Games Started
146
79
Hit By Pitch
82
0.0
Wins Above Replacement
0.0
0.0
Offensive Wins Above Replacement
0.0
24
Caught Stealing
33
1
Is Qualified
1
687.5
Runs Created
650.1
4.7
Runs Created Per 27 Outs
4.5
.091
Walks Per Plate Appearance
.094
0.38
Walk To Strikeout Ratio
0.39
.149
Isolated Power
.169
.272
Secondary Average
.286
3.91
Pitches Per Plate Appearance
3.88
404
Extra Base Hits
436
5699
Plate Appearances
5559
30.1
At Bats Per Home Run
25.8
12
Sacrifice Hit
26
32
Sacrifice Flies
30
Pitching
147
Team Games Played
146
44
Quality Starts
32
74
Wins
75
73
Losses
71
33
Saves
37
69
Holds
56
1169
Hits
1181
602
Earned runs
597
141
Home Runs
164
532
Walks
521
1357
Strikeouts
1206
9.3
Strikeouts Per 9 Innings
8.3
150.1
Pitches Per Start
150.6
1.30
Walks Plus Hits Per Inning Pitched
1.31
4.13
Earned Run Average
4.13
73
Losses
71
1313.1
Innings pitched
1301.0
.503
Win Percentage
.514
55
Save Opportunities
63
.236
Opponent Batting Average
.241
.318
Opponent's On-base pct.
.322
.380
Opponent's Slugging pct.
.397
.697
Opponent's OPB Pct + SLG Pct
.719
4957
At Bats
4895
262
Doubles
228
14
Triples
21
79
Batters Hit
83
90
Stolen Bases
116
147
Games Played
146
1
Complete Games
0
11
Shutouts
9
48
Wild Pitches
64
631
Runs Batted In
623
6
Balks
9
1313.1
Innings pitched
1301.0
9.3
Strikeouts Per 9 Innings
8.3
29
Caught Stealing
39
147
Games Started
146
0.0
Wins Above Replacement
0.0
1
Is Qualified
1
673
Runs
646
602
Earned Runs
597
1882
Total Bases
1943
Fielding
147
Team Games Played
146
1313
Full Innings
1301
5192
Total Chances
5163
3940
Putouts
3903
1161
Assists
1187
91
Errors
73
222
Double Plays
232
0.982
Fielding Percentage
0.986
35.0
Range Factor
35.2
0.0
Zone Rating
0.0
147
Games Played
146
0
Games Started
0
0.0
Defensive Wins Above Replacement
0.0
1
Qualified
1