

Rangers vs Angels Live Score (11 Aug, 2026)
Game Information
Stage
Standard
Season
2026
First Pitch
Mon, Aug 10, 9:38 pm
Venue
Angel Stadium
Location
Anaheim, California
Attendance
23,880
Home Runs
Joc Pederson
21 HR
.249 AVG
44 RBI

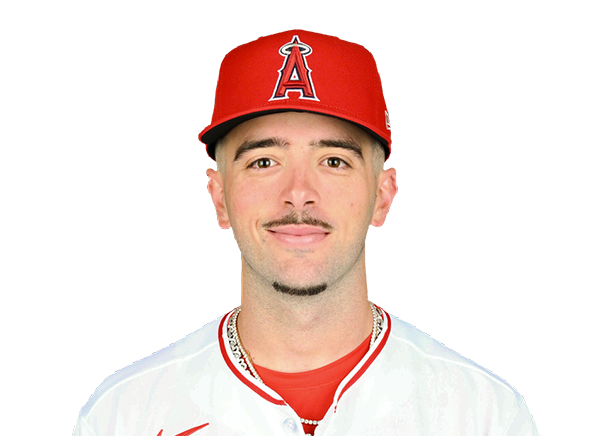
Zach Neto
20 HR
.225 AVG
51 RBI
Batting Average
Josh Jung
.294 AVG
.361 OBP
.441 SLG

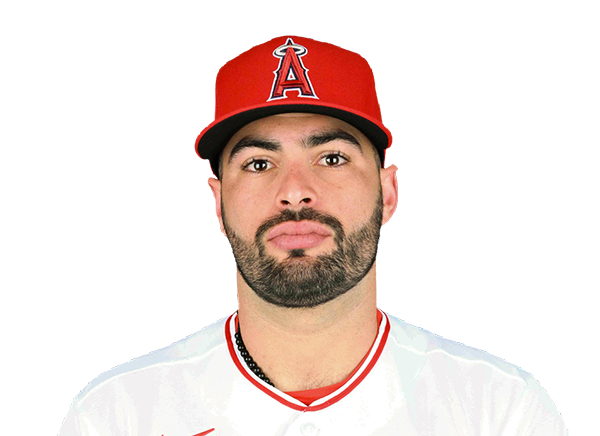
Nolan Schanuel
.274 AVG
.350 OBP
.391 SLG

Runs Batted In
Jake Burger
66 RBI
19 HR
.238 AVG

Zach Neto
51 RBI
20 HR
.225 AVG
Earned Run Average
Jacob deGrom
3.87 ERA
8 W
144 K

Reid Detmers
4.12 ERA
3 W
150 K

Wins
Nathan Eovaldi
10 W
4.21 ERA
137 K

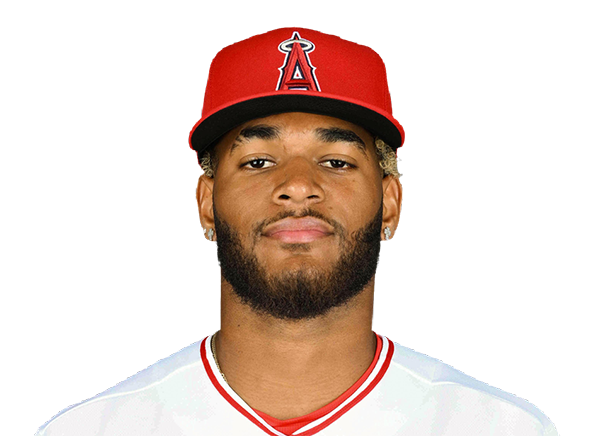
Walbert Urena
7 W
2.83 ERA
97 K
Strikeouts
Jacob deGrom
144 K
8 W
3.87 ERA
Reid Detmers
150 K
3 W
4.12 ERA
Injury Report



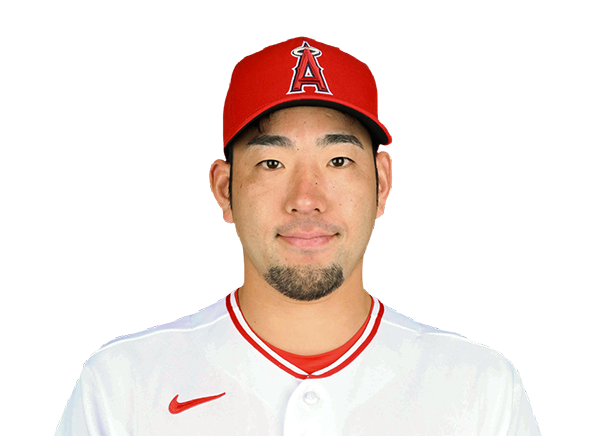


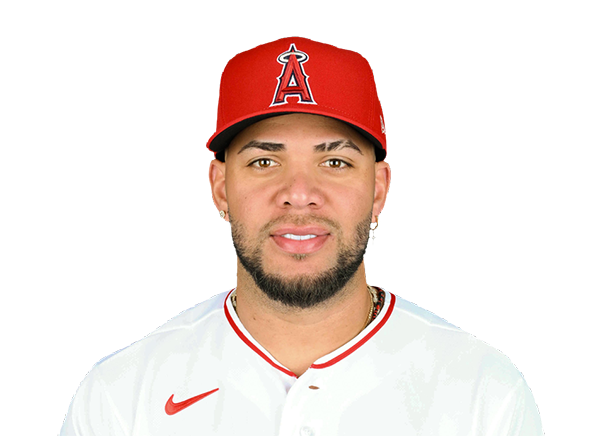
Team Stats
 TEX
LAA


Array
Runs
Array
8
Hits
6
0
Errors
0
—
Home Runs
—
—
Walks
—
—
Strikeouts
—
Standings
American League
| Team | W | L | PCT | GB | DIFF | STRK |
|---|---|---|---|---|---|---|
1 Rays | 77 | 53 | .592 | - | +44 | W1 |
2 White Sox | 68 | 62 | .523 | 9 | +43 | W1 |
3 Astros | 65 | 66 | .496 | 12.5 | -44 | L2 |
4 Yankees | 74 | 56 | .569 | 3 | +100 | W1 |
5 Red Sox | 71 | 59 | .546 | 6 | +99 | W3 |
| 6Rangers | 65 | 66 | .496 | 12.5 | -46 | W1 |
7 Guardians | 65 | 66 | .496 | 12.5 | -9 | W4 |
8 Blue Jays | 64 | 68 | .485 | 14 | -55 | L1 |
9 Twins | 63 | 68 | .481 | 14.5 | -54 | L3 |
10 Orioles | 63 | 68 | .481 | 14.5 | -35 | L1 |
11 Mariners | 62 | 69 | .473 | 15.5 | -61 | L1 |
12 Tigers | 61 | 69 | .469 | 16 | +73 | L5 |
13 Royals | 58 | 74 | .439 | 20 | -91 | W8 |
| 14Angels | 52 | 79 | .397 | 25.5 | -70 | L1 |
15 Athletics | 51 | 80 | .389 | 26.5 | -187 | W2 |
National League
| Team | W | L | PCT | GB | DIFF | STRK |
|---|---|---|---|---|---|---|
1 Brewers | 81 | 50 | .618 | - | +161 | L1 |
2 Dodgers | 80 | 51 | .611 | 1 | +151 | W6 |
3 Braves | 76 | 55 | .580 | 5 | +110 | W1 |
4 Cubs | 75 | 56 | .573 | 6 | +115 | W1 |
5 Phillies | 73 | 58 | .557 | 8 | +27 | W9 |
6 Padres | 71 | 60 | .542 | 10 | +16 | W3 |
7 Diamondbacks | 69 | 62 | .527 | 12 | +9 | W1 |
8 Marlins | 67 | 64 | .511 | 14 | +21 | W3 |
9 Cardinals | 66 | 66 | .500 | 15.5 | -2 | L3 |
10 Pirates | 63 | 69 | .477 | 18.5 | +25 | L3 |
11 Reds | 62 | 69 | .473 | 19 | -94 | L1 |
12 Nationals | 61 | 71 | .462 | 20.5 | +10 | L4 |
13 Mets | 59 | 72 | .450 | 22 | -40 | L1 |
14 Giants | 52 | 78 | .400 | 28.5 | -80 | L4 |
15 Rockies | 50 | 80 | .385 | 30.5 | -136 | L6 |
TEX
VS
LAA
Pitchers

MacKenzie Gore
Catchers
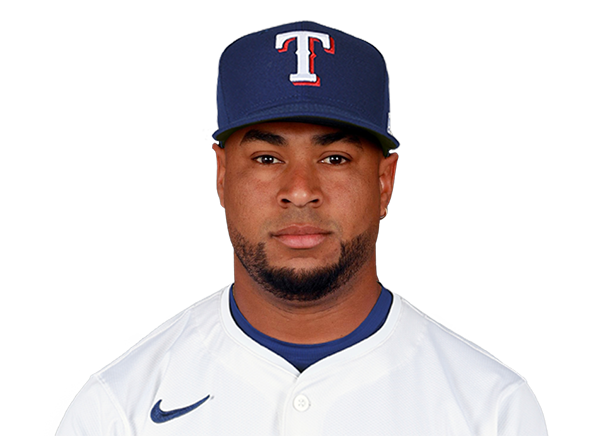
Elias Diaz
Infielders

Corey Seager
Jake Burger
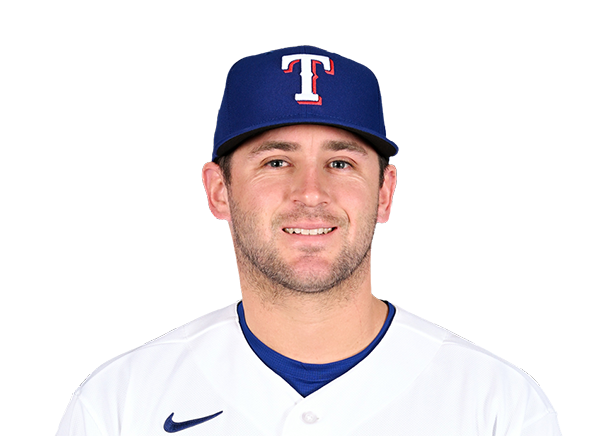
Jonah Bride

Cam Cauley
Outfielders

Wyatt Langford
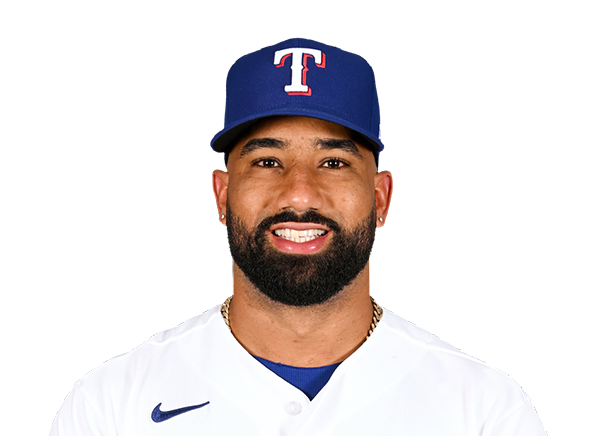
Ezequiel Duran

Brandon Nimmo
Designated Hitters

Justin Foscue
Pitchers
Reid Detmers
Catchers

Travis d'Arnaud
Infielders
Zach Neto
Nolan Schanuel
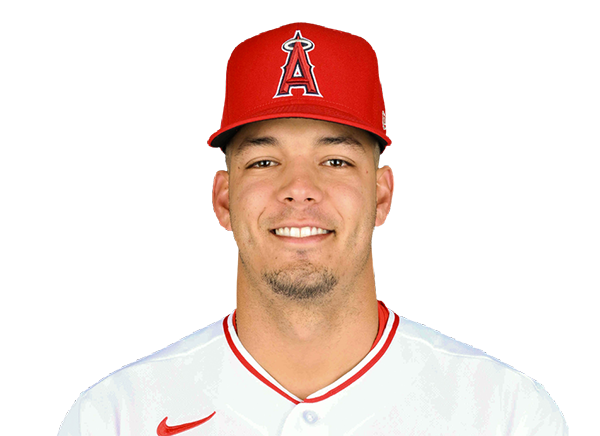
Vaughn Grissom
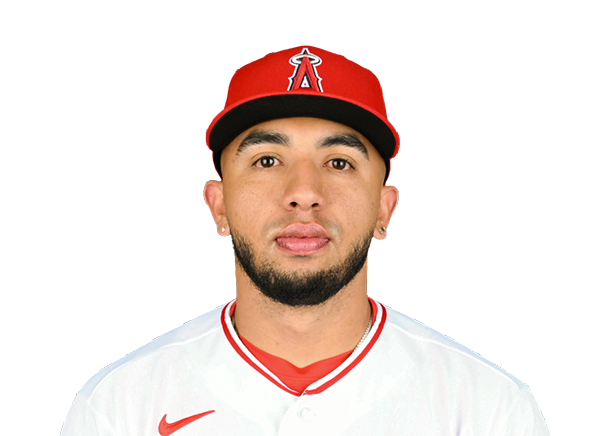
Oswald Peraza
Outfielders

Mike Trout

Jose Siri

Wade Meckler
Designated Hitters
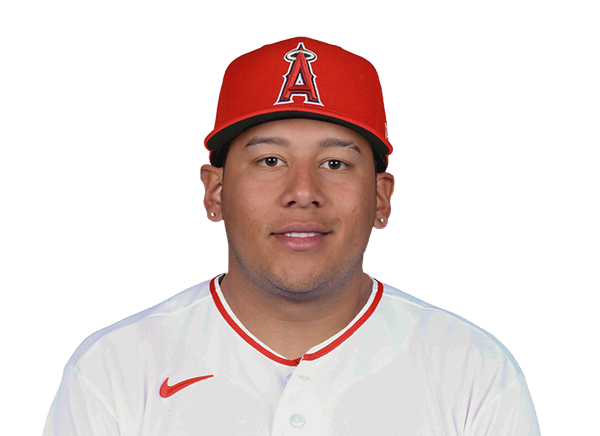
Moises Ballesteros
Rangers
VS
Angels
Batting
119
Team Games Played
119
3960
At Bats
3984
966
Hits
936
476
Runs Batted In
466
134
Home Runs
124
58
Stolen Bases
57
.244
Batting Average
.235
493
Runs
485
172
Doubles
175
19
Triples
11
1578
Total Bases
1505
383
Walks
378
1012
Strikeouts
1134
.318
On Base Percentage
.310
.398
Slugging Percentage
.378
.716
OBP Pct + SLG Pct
.688
119
Games Played
119
119
Games Started
119
55
Hit By Pitch
66
0.0
Wins Above Replacement
0.0
0.0
Offensive Wins Above Replacement
0.0
15
Caught Stealing
18
1
Is Qualified
1
506.7
Runs Created
468.3
4.4
Runs Created Per 27 Outs
4.0
.086
Walks Per Plate Appearance
.085
0.38
Walk To Strikeout Ratio
0.33
.155
Isolated Power
.143
.262
Secondary Average
.247
3.85
Pitches Per Plate Appearance
3.89
325
Extra Base Hits
310
4445
Plate Appearances
4468
29.6
At Bats Per Home Run
32.1
22
Sacrifice Hit
15
24
Sacrifice Flies
23
Pitching
119
Team Games Played
119
37
Quality Starts
34
60
Wins
45
59
Losses
74
34
Saves
16
61
Holds
64
993
Hits
933
493
Earned runs
525
147
Home Runs
129
352
Walks
508
1003
Strikeouts
1064
8.6
Strikeouts Per 9 Innings
9.1
144.4
Pitches Per Start
154.1
1.29
Walks Plus Hits Per Inning Pitched
1.38
4.25
Earned Run Average
4.51
59
Losses
74
1044.1
Innings pitched
1047.1
.504
Win Percentage
.378
49
Save Opportunities
36
.247
Opponent Batting Average
.236
.313
Opponent's On-base pct.
.330
.412
Opponent's Slugging pct.
.385
.725
Opponent's OPB Pct + SLG Pct
.715
4024
At Bats
3953
182
Doubles
171
20
Triples
16
48
Batters Hit
63
70
Stolen Bases
86
119
Games Played
119
0
Complete Games
0
10
Shutouts
8
40
Wild Pitches
48
506
Runs Batted In
550
1
Balks
2
1044.1
Innings pitched
1047.1
8.6
Strikeouts Per 9 Innings
9.1
19
Caught Stealing
22
119
Games Started
119
0.0
Wins Above Replacement
0.0
1
Is Qualified
1
523
Runs
579
493
Earned Runs
525
1656
Total Bases
1523
Fielding
119
Team Games Played
119
1044
Full Innings
1047
4096
Total Chances
4189
3133
Putouts
3142
913
Assists
977
50
Errors
70
172
Double Plays
175
0.988
Fielding Percentage
0.983
34.9
Range Factor
35.4
0.0
Zone Rating
0.0
119
Games Played
119
0
Games Started
0
0.0
Defensive Wins Above Replacement
0.0
1
Qualified
1