

Rangers vs Athletics Live Score (15 Aug, 2026)
Game Information
Stage
Standard
Season
2026
First Pitch
Fri, Aug 14, 9:40 pm
Venue
Sutter Health Park
Location
Sacramento, California
Attendance
8,082
Home Runs
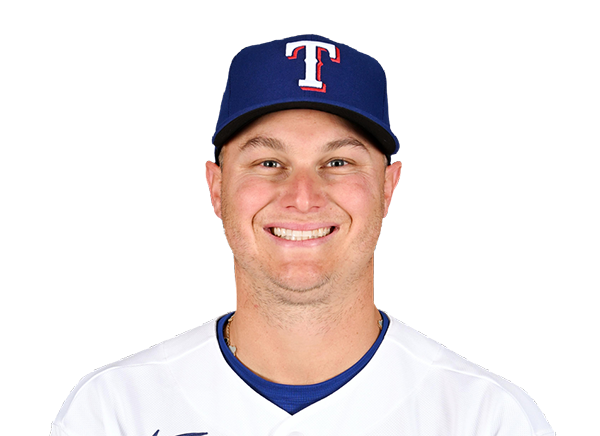
Joc Pederson
22 HR
.250 AVG
46 RBI
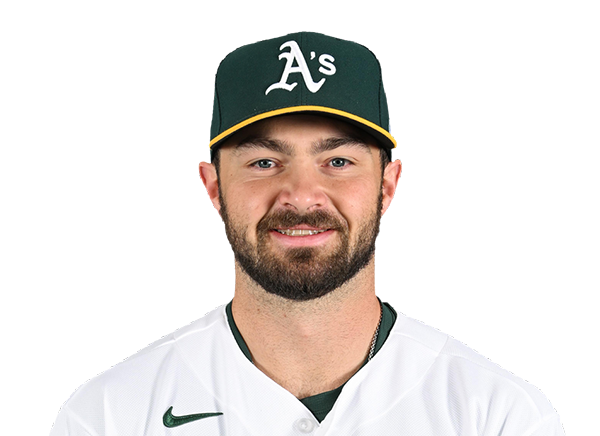
Shea Langeliers
23 HR
.263 AVG
51 RBI
Batting Average
Josh Jung
.294 AVG
.361 OBP
.441 SLG

Shea Langeliers
.263 AVG
.332 OBP
.497 SLG
Runs Batted In
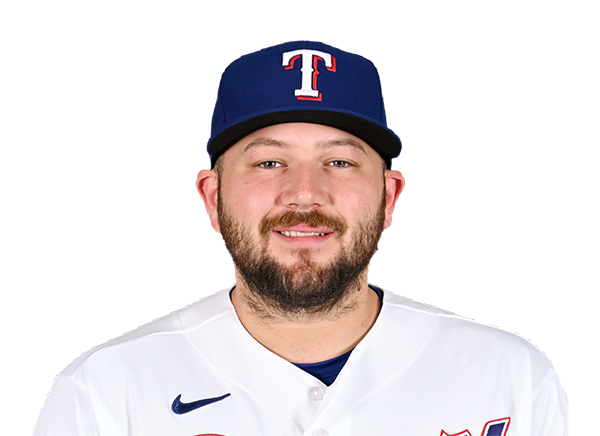
Jake Burger
68 RBI
19 HR
.233 AVG
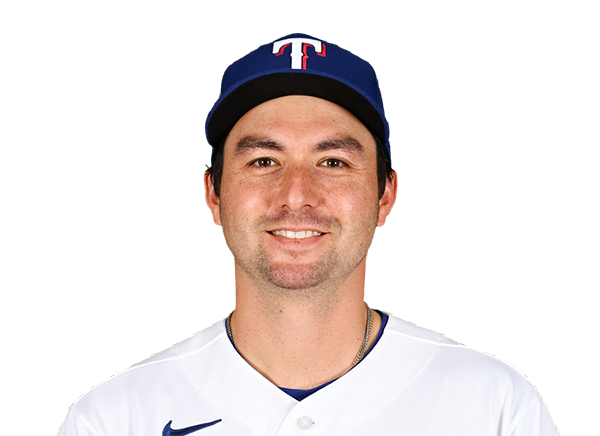
Nick Kurtz
69 RBI
21 HR
.256 AVG

Earned Run Average
Nathan Eovaldi
4.21 ERA
10 W
137 K

J.T. Ginn
3.41 ERA
8 W
107 K

Wins
Nathan Eovaldi
10 W
4.21 ERA
137 K
J.T. Ginn
8 W
3.41 ERA
107 K
Strikeouts
MacKenzie Gore
149 K
6 W
4.43 ERA

J.T. Ginn
107 K
8 W
3.41 ERA
Injury Report






Team Stats
 TEX
ATH


Array
Runs
Array
4
Hits
9
1
Errors
2
—
Home Runs
—
—
Walks
—
—
Strikeouts
—
Standings
American League
| Team | W | L | PCT | GB | DIFF | STRK |
|---|---|---|---|---|---|---|
1 Rays | 76 | 53 | .589 | - | +42 | L3 |
2 White Sox | 67 | 62 | .519 | 9 | +42 | L1 |
3 Astros | 65 | 65 | .500 | 11.5 | -43 | L1 |
4 Yankees | 73 | 56 | .566 | 3 | +95 | L1 |
5 Red Sox | 70 | 59 | .543 | 6 | +98 | W2 |
| 6Rangers | 64 | 66 | .492 | 12.5 | -48 | L1 |
7 Guardians | 64 | 66 | .492 | 12.5 | -14 | W3 |
8 Blue Jays | 64 | 67 | .489 | 13 | -50 | W1 |
9 Twins | 63 | 67 | .485 | 13.5 | -47 | L2 |
10 Orioles | 63 | 67 | .485 | 13.5 | -33 | W2 |
11 Mariners | 62 | 68 | .477 | 14.5 | -44 | W2 |
12 Tigers | 61 | 68 | .473 | 15 | +77 | L4 |
13 Royals | 57 | 74 | .435 | 20 | -95 | W7 |
14 Angels | 52 | 78 | .400 | 24.5 | -68 | W1 |
| 15Athletics | 50 | 80 | .385 | 26.5 | -188 | W1 |
National League
| Team | W | L | PCT | GB | DIFF | STRK |
|---|---|---|---|---|---|---|
1 Brewers | 81 | 49 | .623 | - | +163 | W3 |
2 Dodgers | 79 | 51 | .608 | 2 | +147 | W5 |
3 Braves | 75 | 55 | .577 | 6 | +108 | L2 |
4 Cubs | 74 | 56 | .569 | 7 | +98 | L3 |
5 Phillies | 72 | 58 | .554 | 9 | +25 | W8 |
6 Padres | 70 | 60 | .538 | 11 | +9 | W2 |
7 Diamondbacks | 68 | 62 | .523 | 13 | +7 | L1 |
8 Marlins | 66 | 64 | .508 | 15 | +17 | W2 |
9 Cardinals | 66 | 65 | .504 | 15.5 | 0 | L2 |
10 Pirates | 63 | 68 | .481 | 18.5 | +29 | L2 |
11 Reds | 62 | 68 | .477 | 19 | -92 | W1 |
12 Nationals | 61 | 70 | .466 | 20.5 | +14 | L3 |
13 Mets | 59 | 71 | .454 | 22 | -39 | W1 |
14 Giants | 52 | 77 | .403 | 28.5 | -79 | L3 |
15 Rockies | 50 | 79 | .388 | 30.5 | -131 | L5 |
TEX
VS
ATH
Pitchers
Kumar Rocker
Catchers
Elias Diaz
Infielders

Corey Seager
Ezequiel Duran
Jake Burger

Cody Freeman
Outfielders
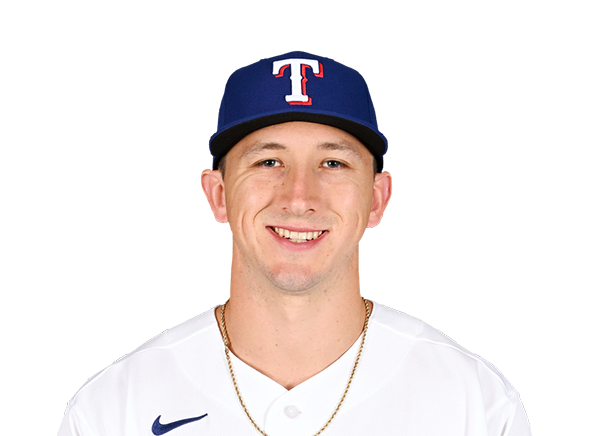
Wyatt Langford

Brandon Nimmo

Evan Carter
Designated Hitters

Justin Foscue
Pitchers
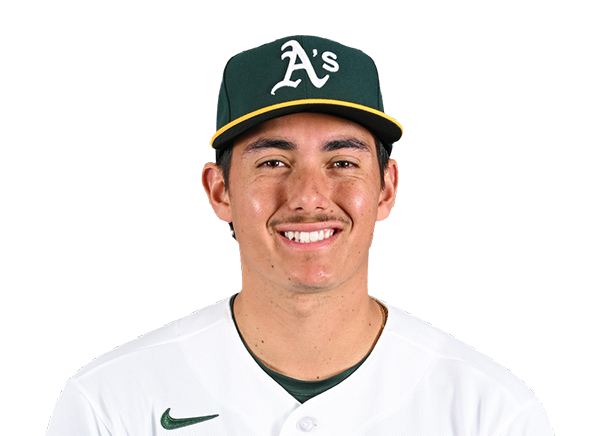
Gage Jump
Catchers

Jonah Heim
Infielders

Jeff McNeil

Jacob Wilson

Zack Gelof

Donovan Walton
Outfielders

Tyler Soderstrom
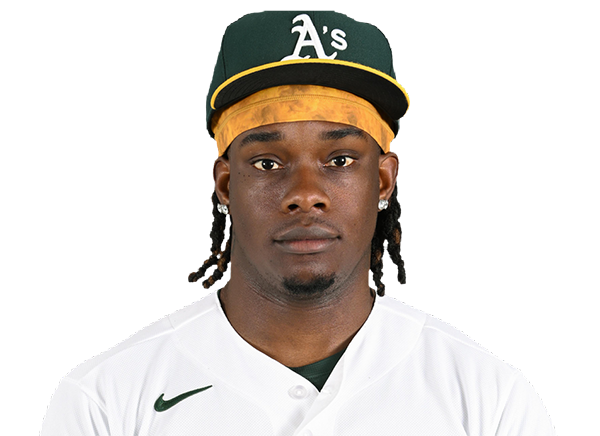
Lawrence Butler

Henry Bolte
Designated Hitters
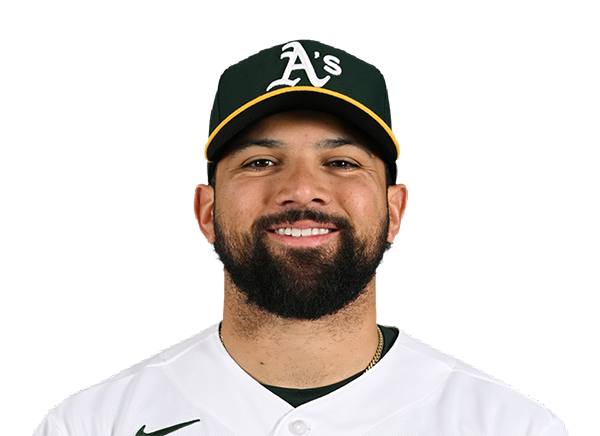
Carlos Cortes
Rangers
VS
Athletics
Batting
123
Team Games Played
122
4091
At Bats
4143
988
Hits
1008
483
Runs Batted In
509
137
Home Runs
145
60
Stolen Bases
66
.242
Batting Average
.243
500
Runs
532
174
Doubles
192
19
Triples
11
1611
Total Bases
1657
396
Walks
403
1044
Strikeouts
1056
.315
On Base Percentage
.317
.394
Slugging Percentage
.400
.709
OBP Pct + SLG Pct
.717
123
Games Played
122
123
Games Started
122
56
Hit By Pitch
55
0.0
Wins Above Replacement
0.0
0.0
Offensive Wins Above Replacement
0.0
15
Caught Stealing
23
1
Is Qualified
1
513.8
Runs Created
526.0
4.3
Runs Created Per 27 Outs
4.3
.086
Walks Per Plate Appearance
.087
0.38
Walk To Strikeout Ratio
0.38
.152
Isolated Power
.157
.260
Secondary Average
.264
3.86
Pitches Per Plate Appearance
3.80
330
Extra Base Hits
348
4590
Plate Appearances
4641
29.9
At Bats Per Home Run
28.6
22
Sacrifice Hit
17
24
Sacrifice Flies
22
Pitching
123
Team Games Played
122
38
Quality Starts
25
60
Wins
48
63
Losses
74
34
Saves
29
61
Holds
64
1030
Hits
1136
515
Earned runs
659
149
Home Runs
192
368
Walks
488
1031
Strikeouts
1029
8.6
Strikeouts Per 9 Innings
8.6
144.2
Pitches Per Start
154.3
1.30
Walks Plus Hits Per Inning Pitched
1.50
4.31
Earned Run Average
5.48
63
Losses
74
1076.1
Innings pitched
1081.1
.488
Win Percentage
.393
50
Save Opportunities
53
.248
Opponent Batting Average
.269
.315
Opponent's On-base pct.
.349
.411
Opponent's Slugging pct.
.467
.727
Opponent's OPB Pct + SLG Pct
.817
4151
At Bats
4223
190
Doubles
223
20
Triples
19
51
Batters Hit
60
77
Stolen Bases
84
123
Games Played
122
0
Complete Games
1
10
Shutouts
6
41
Wild Pitches
33
528
Runs Batted In
685
1
Balks
7
1076.1
Innings pitched
1081.1
8.6
Strikeouts Per 9 Innings
8.6
19
Caught Stealing
28
123
Games Started
122
0.0
Wins Above Replacement
0.0
1
Is Qualified
1
546
Runs
707
515
Earned Runs
659
1707
Total Bases
1973
Fielding
123
Team Games Played
122
1076
Full Innings
1081
4226
Total Chances
4215
3229
Putouts
3244
945
Assists
913
52
Errors
58
174
Double Plays
192
0.988
Fielding Percentage
0.986
34.9
Range Factor
34.6
0.0
Zone Rating
0.0
123
Games Played
122
0
Games Started
0
0.0
Defensive Wins Above Replacement
0.0
1
Qualified
1