

Rangers vs Braves Live Score (17 Jul, 2026)
Game Information
Stage
Standard
Season
2026
First Pitch
Fri, Jul 17, 7:15 pm
Venue
Truist Park
Location
Atlanta, Georgia
Attendance
40,147
Live Situation
3Balls
2Strikes
0Outs
—Pitcher
—At Bat
Pitch Sequence
1
BALL
Four-seam FB
95 MPH
2
STRIKE SWINGING
Cutter
90 MPH
3
BALL
Cutter
92 MPH
4
STRIKE SWINGING
Cutter
90 MPH
5
BALL
Cutter
91 MPH
6
BALL IN PLAY
Cutter
90 MPH
Injury Report
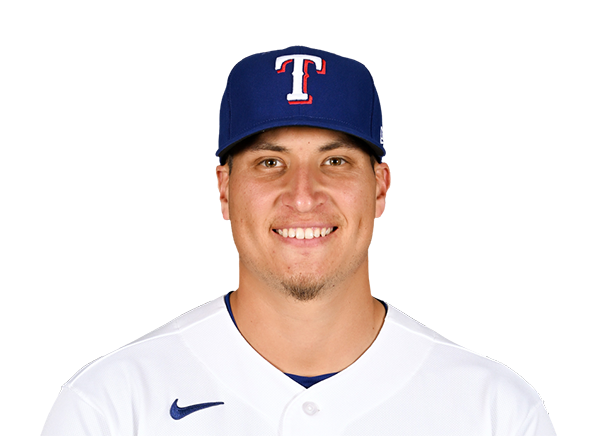
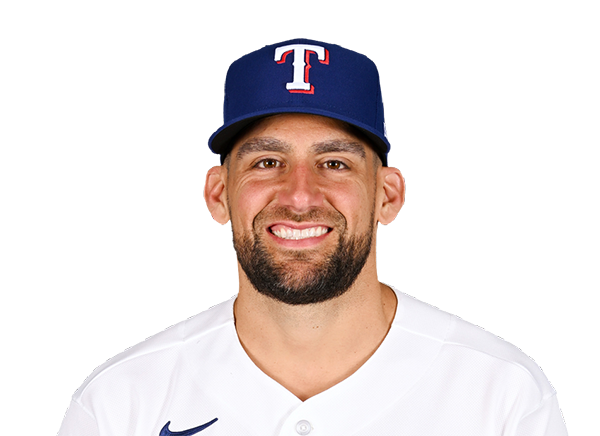

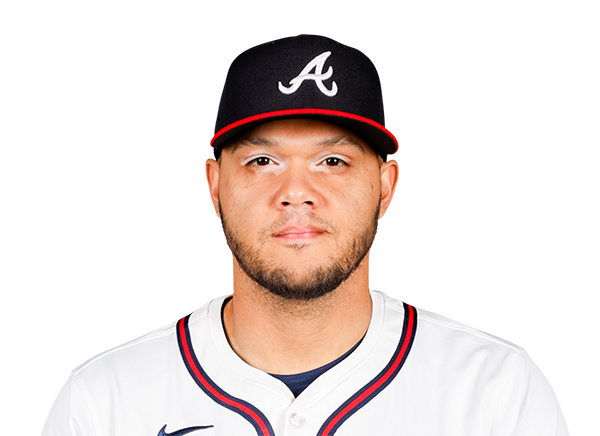
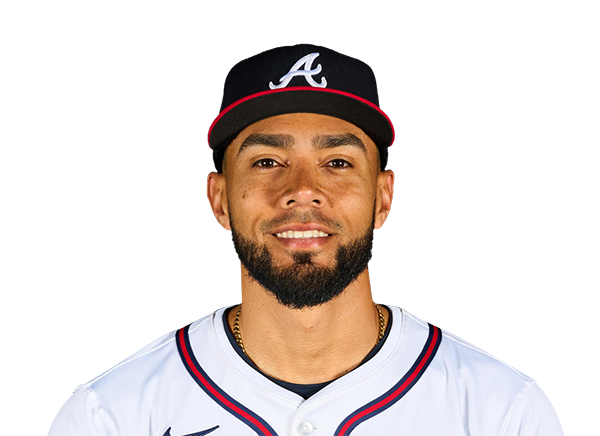

Team Stats
 TEX
ATL


1
Runs
15
5
Hits
19
0
Errors
0
0
Home Runs
3
0
Walks
6
7
Strikeouts
5
Player Box Score
Texas Rangers
| Player | H-AB | AB | R | H | RBI | HR | BB | K | #P | AVG | OBP | SLG |
|---|---|---|---|---|---|---|---|---|---|---|---|---|
 Justin Foscue | 1-4 | 4 | 0 | 1 | 0 | 0 | 0 | 0 | 10 | .284 | .352 | .541 |
 Wyatt Langford | 0-3 | 3 | 0 | 0 | 0 | 0 | 0 | 1 | 15 | .271 | .320 | .486 |
 Alejandro Osuna | 0-1 | 1 | 0 | 0 | 0 | 0 | 0 | 0 | 2 | .255 | .353 | .297 |
 Brandon Nimmo | 1-3 | 3 | 0 | 1 | 0 | 0 | 0 | 0 | 14 | .264 | .331 | .427 |
 Evan Carter | 0-1 | 1 | 0 | 0 | 0 | 0 | 0 | 0 | 1 | .188 | .302 | .330 |
 Josh Jung | 0-4 | 4 | 0 | 0 | 0 | 0 | 0 | 1 | 11 | .294 | .363 | .447 |
 Jake Burger | 0-4 | 4 | 0 | 0 | 0 | 0 | 0 | 2 | 19 | .237 | .301 | .418 |
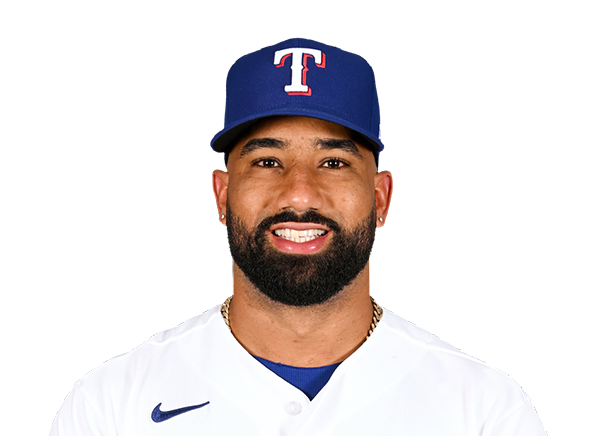 Ezequiel Duran | 0-3 | 3 | 0 | 0 | 0 | 0 | 0 | 2 | 15 | .268 | .321 | .431 |
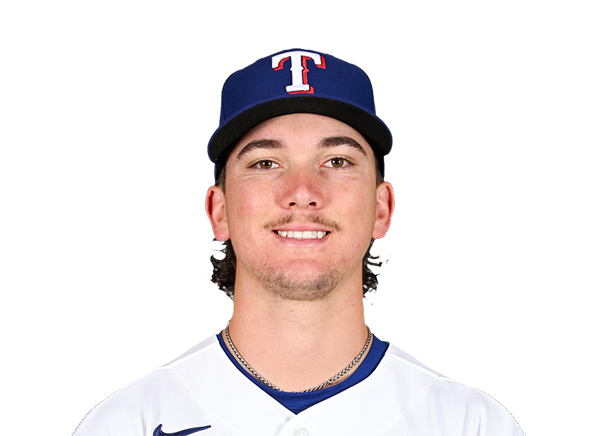 Cam Cauley | 1-3 | 3 | 1 | 1 | 0 | 0 | 0 | 1 | 12 | .250 | .308 | .375 |
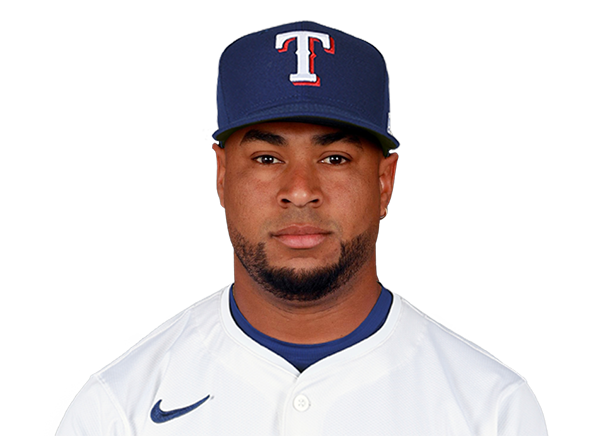 Elias Diaz | 1-3 | 3 | 0 | 1 | 0 | 0 | 0 | 0 | 11 | .282 | .288 | .423 |
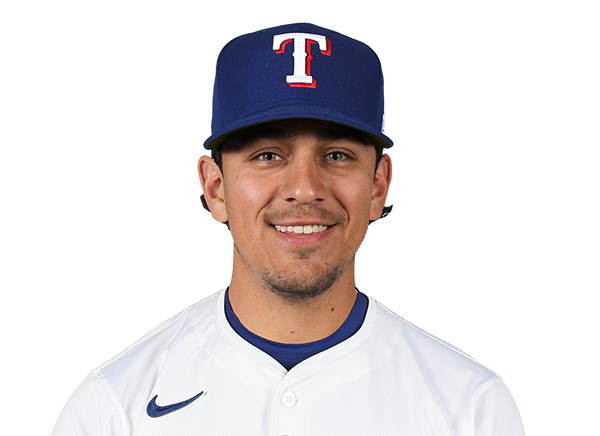 Nicky Lopez | 1-3 | 3 | 0 | 1 | 1 | 0 | 0 | 0 | 13 | .325 | .358 | .377 |
Atlanta Braves
| Player | H-AB | AB | R | H | RBI | HR | BB | K | #P | AVG | OBP | SLG |
|---|---|---|---|---|---|---|---|---|---|---|---|---|
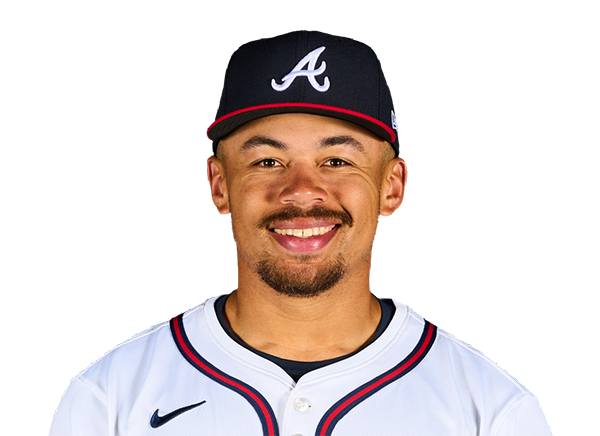 Drake Baldwin | 3-4 | 4 | 2 | 3 | 5 | 1 | 1 | 0 | 28 | .261 | .352 | .452 |
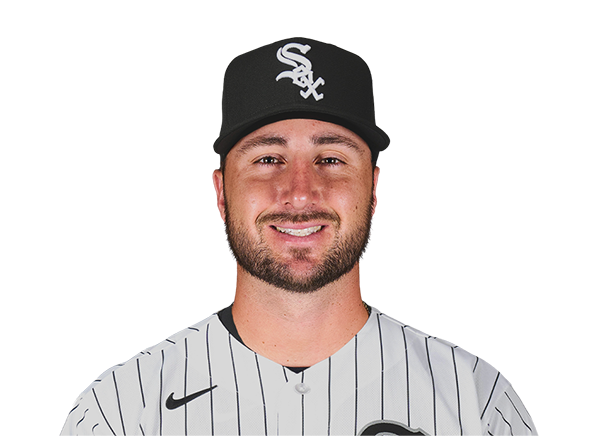 Joey Bart | 0-1 | 1 | 0 | 0 | 0 | 0 | 0 | 0 | 4 | .129 | .229 | .355 |
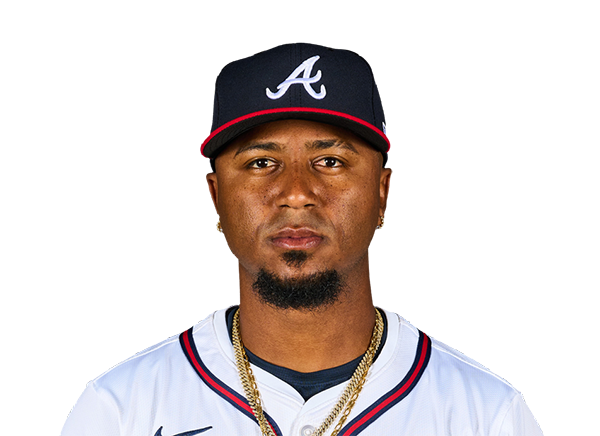 Ozzie Albies | 2-4 | 4 | 1 | 2 | 1 | 0 | 0 | 1 | 14 | .270 | .323 | .439 |
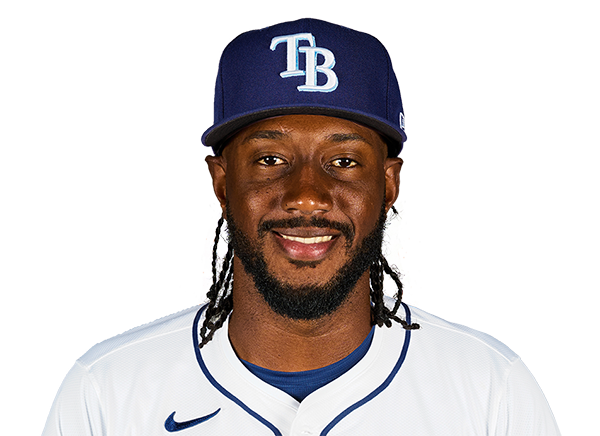 Jorge Mateo | 1-1 | 1 | 1 | 1 | 0 | 0 | 0 | 0 | 3 | .244 | .289 | .386 |
 Matt Olson | 2-3 | 3 | 2 | 2 | 1 | 1 | 2 | 1 | 25 | .270 | .344 | .543 |
 Victor Mederos | 1-1 | 1 | 0 | 1 | 2 | 0 | 0 | 0 | 3 | 1.000 | 1.000 | 1.000 |
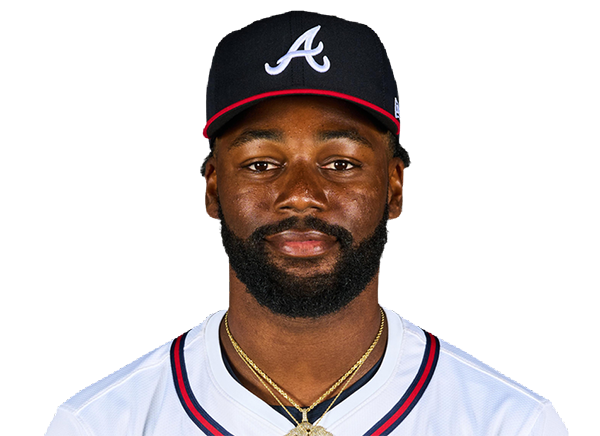 Michael Harris II | 2-6 | 6 | 1 | 2 | 3 | 0 | 0 | 0 | 19 | .297 | .329 | .491 |
 Mauricio Dubon | 2-5 | 5 | 0 | 2 | 1 | 0 | 0 | 0 | 11 | .267 | .320 | .420 |
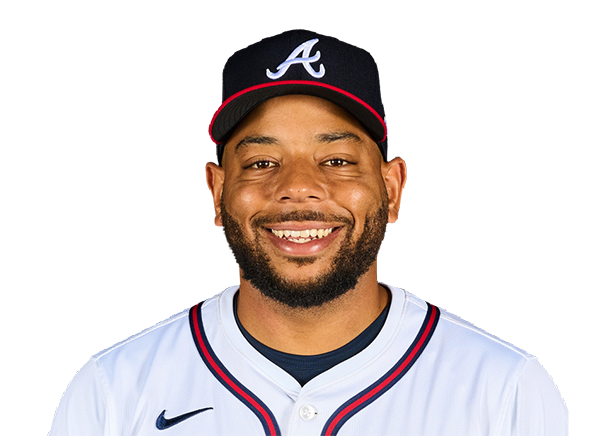 Dominic Smith | 1-3 | 3 | 2 | 1 | 0 | 0 | 2 | 1 | 27 | .264 | .321 | .387 |
 Austin Riley | 2-5 | 5 | 2 | 2 | 1 | 1 | 0 | 0 | 19 | .210 | .290 | .339 |
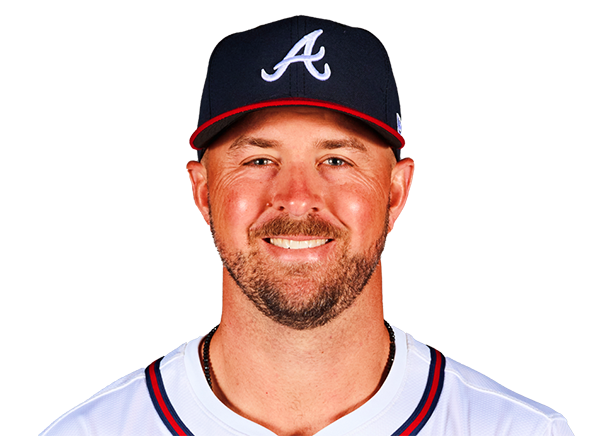 Kyle Farmer | 0-0 | 0 | 0 | 0 | 0 | 0 | 0 | 0 | 0 | .267 | .250 | .333 |
 Jim Jarvis | 2-5 | 5 | 2 | 2 | 1 | 0 | 0 | 1 | 23 | .314 | .333 | .486 |
 Brewer Hicklen | 1-4 | 4 | 2 | 1 | 0 | 0 | 1 | 1 | 22 | .375 | .444 | .625 |
Texas Rangers
| Player | IP | H | R | ER | BB | K | HR | PC-ST | ERA | PC |
|---|---|---|---|---|---|---|---|---|---|---|
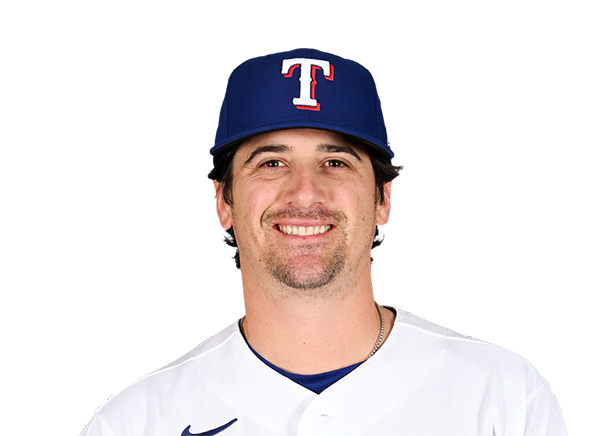 Cal Quantrill | 4.0 | 11 | 6 | 6 | 1 | 3 | 2 | 86-59 | 3.93 | 86 |
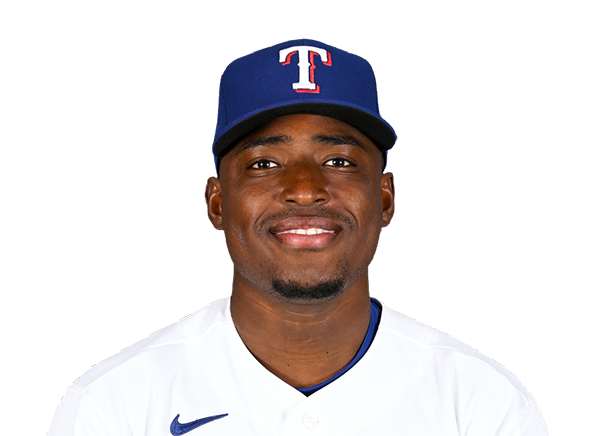 Emiliano Teodo | 1.2 | 3 | 2 | 2 | 2 | 1 | 0 | 43-27 | 10.80 | 43 |
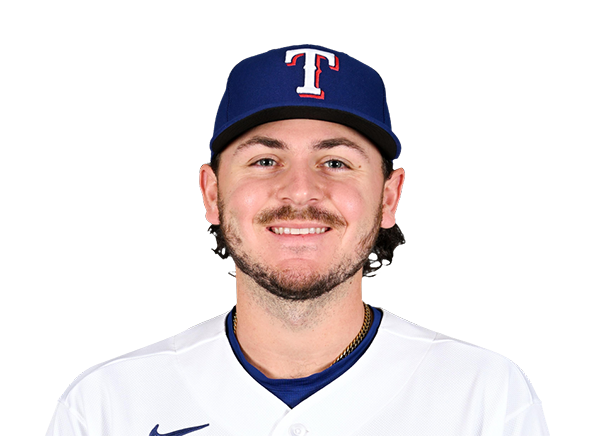 Gavin Collyer | 1.0 | 2 | 4 | 4 | 2 | 1 | 0 | 41-23 | 5.09 | 41 |
 Ben Peoples | 0.1 | 0 | 0 | 0 | 0 | 0 | 0 | 6-3 | 2.08 | 6 |
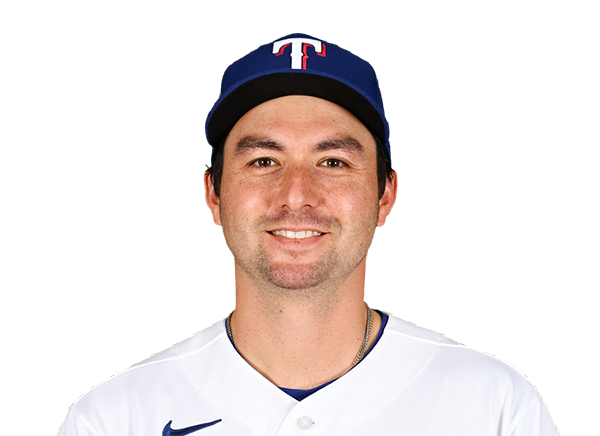 Kyle Higashioka | 1.0 | 3 | 3 | 3 | 1 | 0 | 1 | 22-11 | 21.00 | 22 |
Atlanta Braves
| Player | IP | H | R | ER | BB | K | HR | PC-ST | ERA | PC |
|---|---|---|---|---|---|---|---|---|---|---|
 Chris Sale | 7.0 | 2 | 0 | 0 | 0 | 6 | 0 | 89-62 | 2.06 | 89 |
|
Victor Mederos | 2.0 | 3 | 1 | 1 | 0 | 1 | 0 | 34-22 | 1.29 | 34 |
H2H / Season Series
ATL8–5
TEX
ATL6–7
TEX
ATL15–1
TEX
Last 5 Games
| Date | Opponent | Result |
|---|---|---|
| Aug 22 |  vs LAA | L0–3 |
| Aug 21 | vs LAA | W2–1 |
| Aug 20 |  vs WSH | W2–0 |
| Aug 19 | vs WSH | L0–6 |
| Aug 18 | vs WSH | W5–0 |
| Date | Opponent | Result |
|---|---|---|
| Aug 22 |  @ MIL | L1–4 |
| Aug 21 | @ MIL | L1–2 |
| Aug 20 |  @ CHW | W2–0 |
| Aug 19 |  @ MIN | L4–6 |
| Aug 18 | @ MIN | L1–4 |
Standings
American League
| Team | W | L | PCT | GB | DIFF | STRK |
|---|---|---|---|---|---|---|
1 Rays | 76 | 53 | .589 | - | +42 | L3 |
| 2White Sox | 67 | 62 | .519 | 9 | +42 | L1 |
3 Astros | 65 | 65 | .500 | 11.5 | -43 | L1 |
4 Yankees | 73 | 56 | .566 | 3 | +95 | L1 |
5 Red Sox | 70 | 59 | .543 | 6 | +98 | W2 |
| 6Rangers | 64 | 66 | .492 | 12.5 | -48 | L1 |
7 Guardians | 64 | 66 | .492 | 12.5 | -14 | W3 |
8 Blue Jays | 64 | 67 | .489 | 13 | -50 | W1 |
| 9Twins | 63 | 67 | .485 | 13.5 | -47 | L2 |
10 Orioles | 63 | 67 | .485 | 13.5 | -33 | W2 |
11 Mariners | 62 | 68 | .477 | 14.5 | -44 | W2 |
12 Tigers | 61 | 68 | .473 | 15 | +77 | L4 |
13 Royals | 57 | 74 | .435 | 20 | -95 | W7 |
| 14Angels | 52 | 78 | .400 | 24.5 | -68 | W1 |
15 Athletics | 50 | 80 | .385 | 26.5 | -188 | W1 |
National League
| Team | W | L | PCT | GB | DIFF | STRK |
|---|---|---|---|---|---|---|
| 1Brewers | 81 | 49 | .623 | - | +163 | W3 |
2 Dodgers | 79 | 51 | .608 | 2 | +147 | W5 |
| 3Braves | 75 | 55 | .577 | 6 | +108 | L2 |
4 Cubs | 74 | 56 | .569 | 7 | +98 | L3 |
5 Phillies | 72 | 58 | .554 | 9 | +25 | W8 |
6 Padres | 70 | 60 | .538 | 11 | +9 | W2 |
7 Diamondbacks | 68 | 62 | .523 | 13 | +7 | L1 |
8 Marlins | 66 | 64 | .508 | 15 | +17 | W2 |
9 Cardinals | 66 | 65 | .504 | 15.5 | 0 | L2 |
10 Pirates | 63 | 68 | .481 | 18.5 | +29 | L2 |
11 Reds | 62 | 68 | .477 | 19 | -92 | W1 |
| 12Nationals | 61 | 70 | .466 | 20.5 | +14 | L3 |
13 Mets | 59 | 71 | .454 | 22 | -39 | W1 |
14 Giants | 52 | 77 | .403 | 28.5 | -79 | L3 |
15 Rockies | 50 | 79 | .388 | 30.5 | -131 | L5 |
TEX
VS
ATL
Pitchers
Cal Quantrill
Emiliano Teodo
Gavin Collyer
Ben Peoples
Kyle Higashioka
Catchers
Elias Diaz
Infielders
Josh Jung
Jake Burger
Ezequiel Duran
Nicky Lopez
Outfielders
Wyatt Langford
Alejandro Osuna
Brandon Nimmo
Evan Carter
Cam Cauley
Designated Hitters
Justin Foscue
Pitchers
Victor Mederos
Chris Sale
Catchers
Drake Baldwin
Joey Bart
Infielders
Ozzie Albies
Jorge Mateo
Matt Olson
Dominic Smith
Austin Riley
Kyle Farmer
Jim Jarvis
Outfielders
Michael Harris II
Mauricio Dubon
Brewer Hicklen
Rangers
VS
Braves
Batting
130
Team Games Played
130
4315
At Bats
4395
1039
Hits
1081
497
Runs Batted In
585
141
Home Runs
167
62
Stolen Bases
63
.241
Batting Average
.246
516
Runs
610
184
Doubles
207
20
Triples
9
1686
Total Bases
1807
414
Walks
378
1109
Strikeouts
1052
.314
On Base Percentage
.310
.391
Slugging Percentage
.411
.705
OBP Pct + SLG Pct
.721
130
Games Played
130
130
Games Started
130
57
Hit By Pitch
48
0.0
Wins Above Replacement
0.0
0.0
Offensive Wins Above Replacement
0.0
17
Caught Stealing
21
1
Is Qualified
1
533.3
Runs Created
571.9
4.2
Runs Created Per 27 Outs
4.5
.086
Walks Per Plate Appearance
.078
0.37
Walk To Strikeout Ratio
0.36
.150
Isolated Power
.165
.256
Secondary Average
.261
3.86
Pitches Per Plate Appearance
3.89
345
Extra Base Hits
383
4837
Plate Appearances
4868
30.6
At Bats Per Home Run
26.3
25
Sacrifice Hit
7
25
Sacrifice Flies
37
Pitching
130
Team Games Played
130
41
Quality Starts
49
64
Wins
75
66
Losses
55
36
Saves
39
65
Holds
92
1082
Hits
991
532
Earned runs
463
155
Home Runs
146
386
Walks
442
1094
Strikeouts
1106
8.6
Strikeouts Per 9 Innings
8.6
144.4
Pitches Per Start
144.5
1.29
Walks Plus Hits Per Inning Pitched
1.24
4.20
Earned Run Average
3.61
66
Losses
55
1139.1
Innings pitched
1153.0
.492
Win Percentage
.577
52
Save Opportunities
56
.247
Opponent Batting Average
.230
.314
Opponent's On-base pct.
.307
.409
Opponent's Slugging pct.
.378
.723
Opponent's OPB Pct + SLG Pct
.685
4384
At Bats
4301
204
Doubles
164
21
Triples
17
52
Batters Hit
45
81
Stolen Bases
95
130
Games Played
130
0
Complete Games
0
12
Shutouts
8
41
Wild Pitches
26
546
Runs Batted In
482
1
Balks
4
1139.1
Innings pitched
1153.0
8.6
Strikeouts Per 9 Innings
8.6
23
Caught Stealing
17
130
Games Started
130
0.0
Wins Above Replacement
0.0
1
Is Qualified
1
564
Runs
502
532
Earned Runs
463
1793
Total Bases
1627
Fielding
130
Team Games Played
130
1139
Full Innings
1153
4469
Total Chances
4571
3418
Putouts
3459
998
Assists
1053
53
Errors
59
184
Double Plays
207
0.988
Fielding Percentage
0.987
34.9
Range Factor
35.2
0.0
Zone Rating
0.0
130
Games Played
130
0
Games Started
0
0.0
Defensive Wins Above Replacement
0.0
1
Qualified
1