

Rangers vs Brewers Live Score (30 Aug, 2026)
Game Information
Stage
STD
Season
2026
First Pitch
Sun, Aug 30, 2:10 pm
Venue
American Family Field
Location
Milwaukee, Wisconsin
Venue Type
Indoor
Broadcast
MLB.TV
Attendance
37,996
Live Situation
2Balls
3Strikes
0Outs
—Pitcher
—At Bat
Pitch Sequence
1
STRIKE FOUL
Four-seam FB
97 MPH
2
BALL
Four-seam FB
96 MPH
3
STRIKE FOUL
Slider
89 MPH
4
BALL
Four-seam FB
96 MPH
5
STRIKE SWINGING
Four-seam FB
96 MPH
Injury Report



Team Stats
 TEX
MIL


7
Runs
4
10
Hits
7
1
Errors
1
2
Home Runs
1
4
Walks
6
8
Strikeouts
11
Player Box Score
Texas Rangers
| Player | H-AB | AB | R | H | RBI | HR | BB | K | #P | AVG | OBP | SLG |
|---|---|---|---|---|---|---|---|---|---|---|---|---|
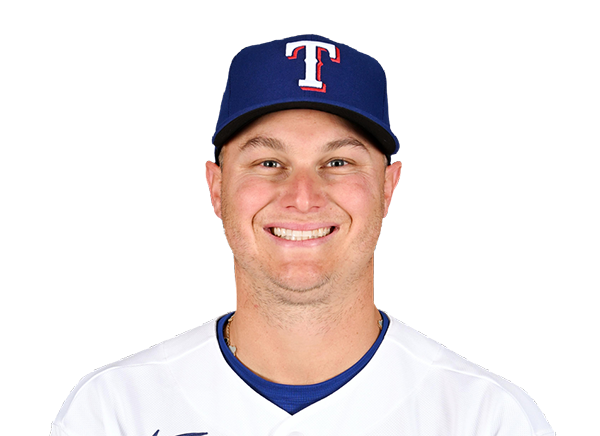 Joc Pederson | 1-4 | 4 | 1 | 1 | 1 | 1 | 0 | 2 | 18 | .234 | .328 | .481 |
 Corey Seager | 1-4 | 4 | 1 | 1 | 0 | 0 | 1 | 0 | 17 | .223 | .321 | .403 |
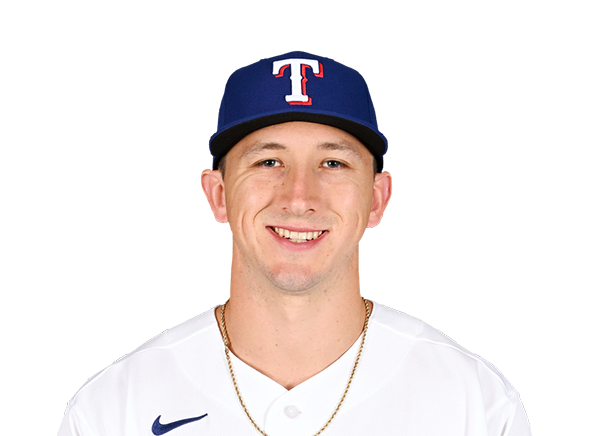 Wyatt Langford | 0-4 | 4 | 1 | 0 | 0 | 0 | 1 | 0 | 23 | .254 | .333 | .453 |
 Brandon Nimmo | 1-4 | 4 | 1 | 1 | 0 | 0 | 1 | 2 | 32 | .261 | .328 | .421 |
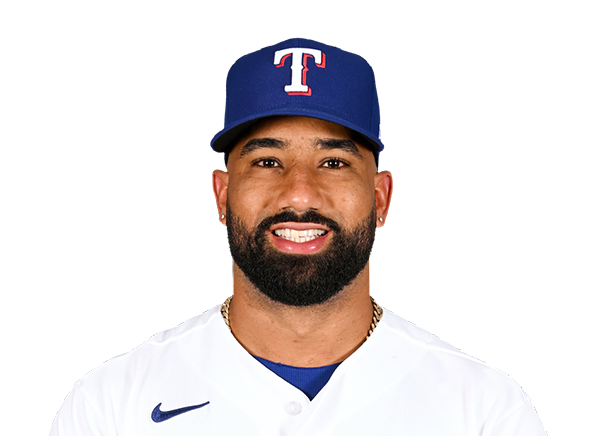 Ezequiel Duran | 2-5 | 5 | 2 | 2 | 3 | 1 | 0 | 1 | 13 | .273 | .331 | .450 |
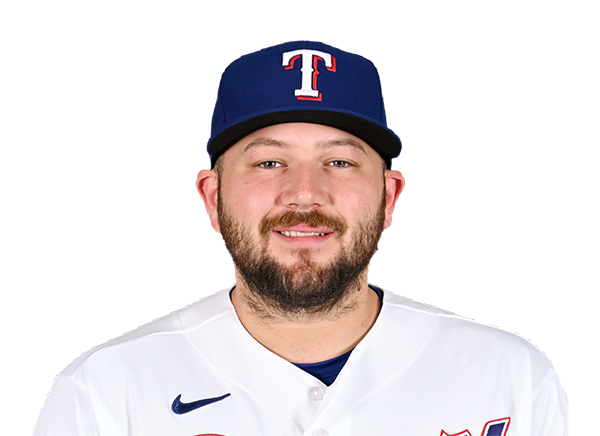 Jake Burger | 1-5 | 5 | 0 | 1 | 1 | 0 | 0 | 1 | 17 | .236 | .300 | .425 |
 Evan Carter | 0-5 | 5 | 0 | 0 | 0 | 0 | 0 | 1 | 19 | .193 | .292 | .316 |
 Cody Freeman | 2-4 | 4 | 1 | 2 | 1 | 0 | 0 | 0 | 19 | .286 | .365 | .393 |
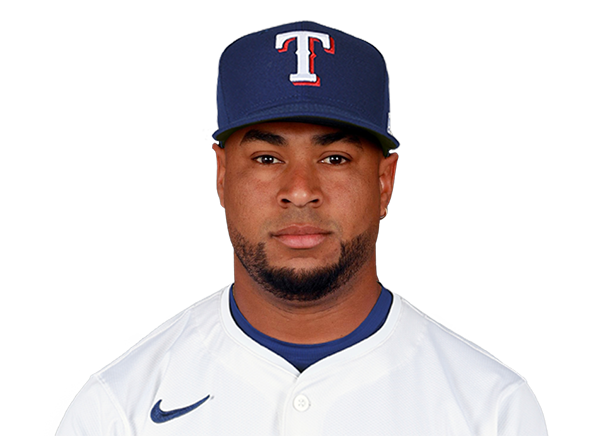 Elias Diaz | 2-3 | 3 | 0 | 2 | 1 | 0 | 1 | 1 | 20 | .230 | .265 | .397 |
Milwaukee Brewers
| Player | H-AB | AB | R | H | RBI | HR | BB | K | #P | AVG | OBP | SLG |
|---|---|---|---|---|---|---|---|---|---|---|---|---|
 Brice Turang | 1-4 | 4 | 1 | 1 | 0 | 0 | 1 | 1 | 25 | .255 | .349 | .428 |
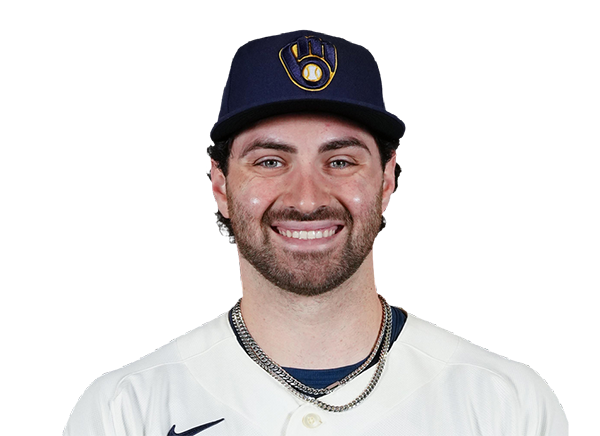 Garrett Mitchell | 1-4 | 4 | 1 | 1 | 0 | 0 | 1 | 0 | 15 | .259 | .354 | .410 |
 Jake Bauers | 1-4 | 4 | 0 | 1 | 1 | 0 | 0 | 2 | 22 | .273 | .388 | .498 |
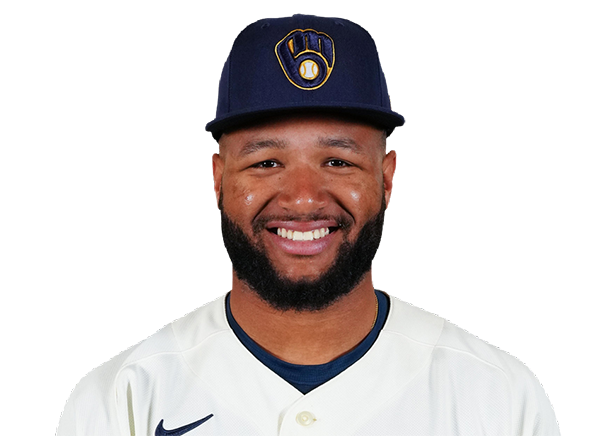 Jackson Chourio | 1-4 | 4 | 1 | 1 | 1 | 0 | 1 | 1 | 18 | .281 | .343 | .476 |
 Christian Yelich | 0-4 | 4 | 0 | 0 | 0 | 0 | 1 | 2 | 24 | .240 | .320 | .384 |
 Gary Sanchez | 1-3 | 3 | 1 | 1 | 2 | 1 | 1 | 2 | 15 | .207 | .347 | .429 |
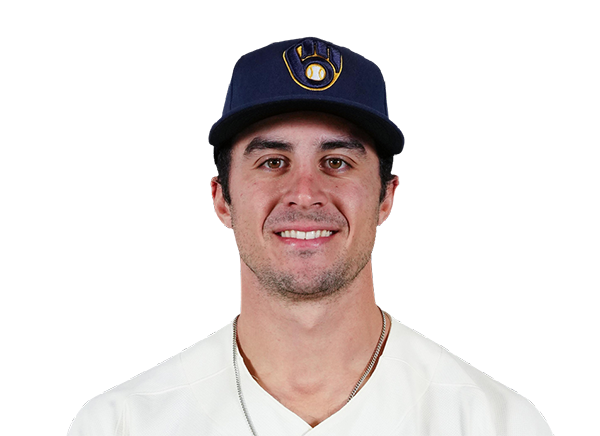 Sal Frelick | 0-2 | 2 | 0 | 0 | 0 | 0 | 1 | 1 | 18 | .241 | .310 | .338 |
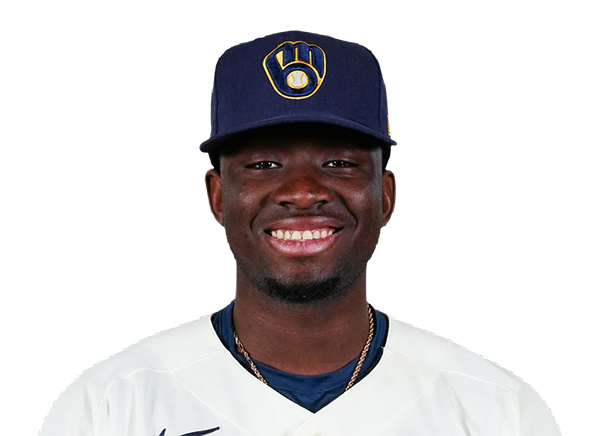 Luis Lara | 0-1 | 1 | 0 | 0 | 0 | 0 | 0 | 0 | 1 | .272 | .343 | .376 |
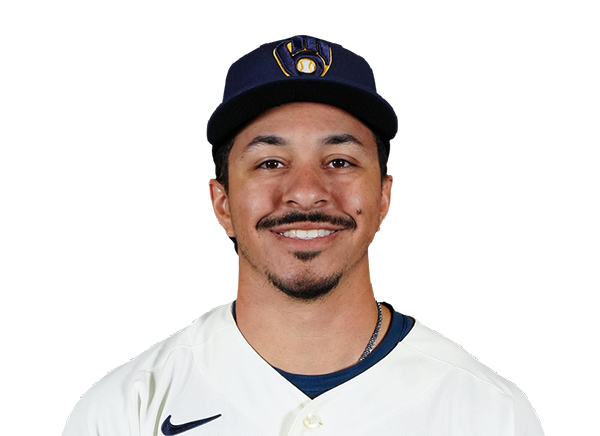 David Hamilton | 0-2 | 2 | 0 | 0 | 0 | 0 | 0 | 1 | 12 | .241 | .314 | .333 |
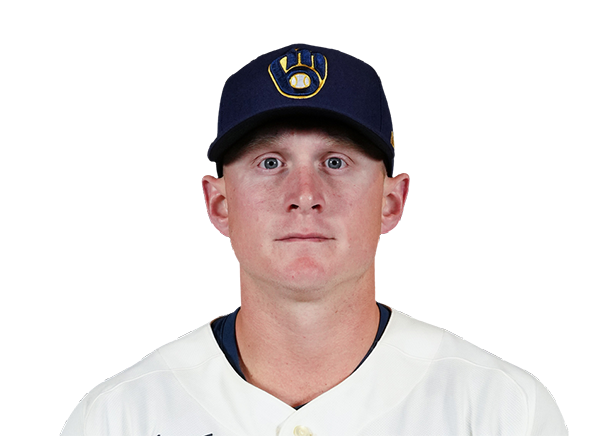 Andrew Vaughn | 0-2 | 2 | 0 | 0 | 0 | 0 | 0 | 1 | 12 | .307 | .395 | .446 |
 Joey Ortiz | 2-4 | 4 | 0 | 2 | 0 | 0 | 0 | 0 | 19 | .253 | .318 | .382 |
Texas Rangers
| Player | IP | H | R | ER | BB | K | HR | PC-ST | ERA | PC |
|---|---|---|---|---|---|---|---|---|---|---|
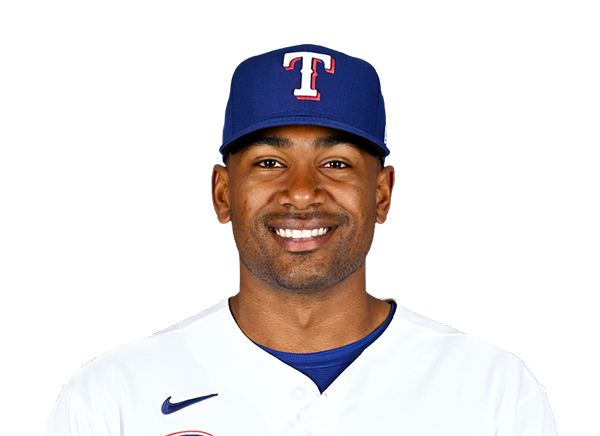 Kumar Rocker | 3.0 | 4 | 2 | 2 | 4 | 7 | 0 | 86-48 | 4.44 | 86 |
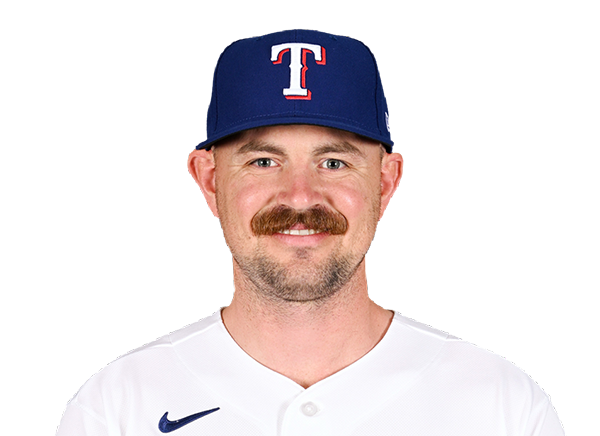 Tyler Alexander | 2.0 | 0 | 0 | 0 | 1 | 1 | 0 | 31-18 | 3.34 | 31 |
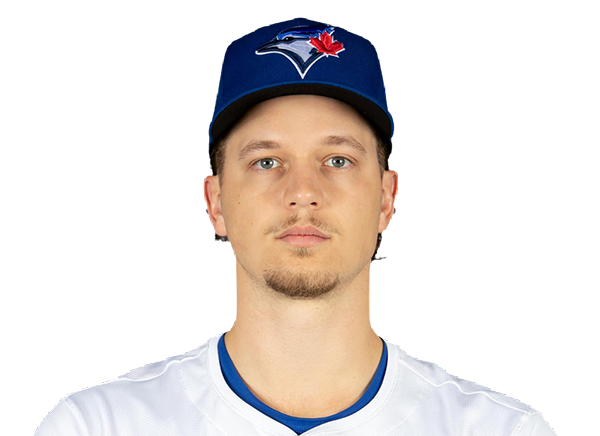 Adam Macko | 1.0 | 1 | 0 | 0 | 0 | 1 | 0 | 21-15 | 5.18 | 21 |
 Jordan Montgomery | 1.0 | 1 | 2 | 2 | 1 | 1 | 1 | 15-9 | 6.75 | 15 |
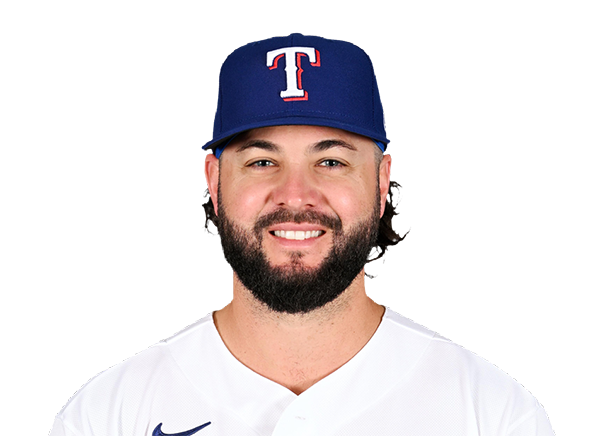 Jakob Junis | 1.0 | 1 | 0 | 0 | 0 | 0 | 0 | 16-12 | 2.72 | 16 |
 Jacob Latz | 1.0 | 0 | 0 | 0 | 0 | 1 | 0 | 12-7 | 1.65 | 12 |
Milwaukee Brewers
| Player | IP | H | R | ER | BB | K | HR | PC-ST | ERA | PC |
|---|---|---|---|---|---|---|---|---|---|---|
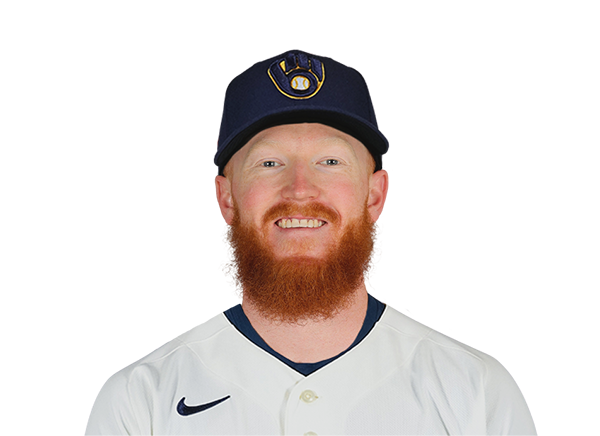 Dustin May | 4.1 | 6 | 4 | 4 | 3 | 4 | 1 | 97-61 | 4.69 | 97 |
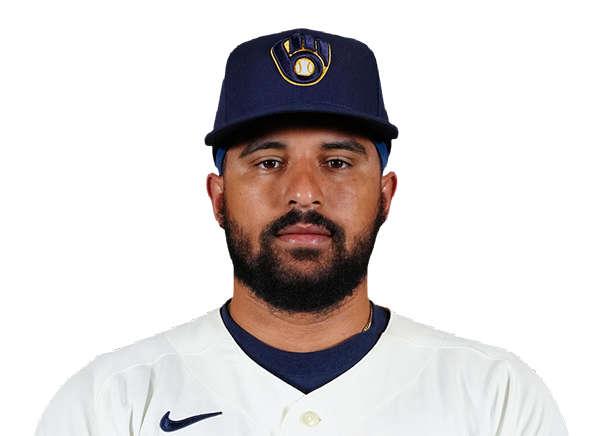 Grant Anderson | 2.0 | 3 | 3 | 1 | 0 | 2 | 1 | 39-26 | 3.42 | 39 |
 Bryse Wilson | 2.2 | 1 | 0 | 0 | 1 | 2 | 0 | 42-30 | 3.67 | 42 |
H2H / Season Series
MIL4–7
TEX
MIL5–3
TEX
MIL6–1
TEX
MIL11–4
TEX
TEX1–5
MIL
Last 5 Games
| Date | Opponent | Result |
|---|---|---|
| Aug 30 | @ MIL | W7–4 |
| Aug 29 | @ MIL | L3–5 |
| Aug 28 | @ MIL | L1–6 |
| Aug 26 |  @ CHW | L4–10 |
| Aug 25 | @ CHW | L7–11 |
| Date | Opponent | Result |
|---|---|---|
| Aug 30 | vs TEX | L4–7 |
| Aug 29 | vs TEX | W5–3 |
| Aug 28 | vs TEX | W6–1 |
| Aug 27 |  @ NYM | W8–2 |
| Aug 26 | @ NYM | W8–1 |
Standings
American League
| Team | W | L | PCT | GB | DIFF | STRK |
|---|---|---|---|---|---|---|
1 Rays | 81 | 54 | .600 | - | +53 | W3 |
| 2White Sox | 72 | 63 | .533 | 9 | +48 | W4 |
3 Astros | 68 | 68 | .500 | 13.5 | -46 | L1 |
4 Yankees | 77 | 59 | .566 | 4.5 | +102 | W1 |
5 Red Sox | 74 | 62 | .544 | 7.5 | +99 | L1 |
6 Guardians | 68 | 68 | .500 | 13.5 | -12 | L2 |
7 Orioles | 67 | 69 | .493 | 14.5 | -21 | W2 |
8 Blue Jays | 67 | 70 | .489 | 15 | -57 | W2 |
| 9Rangers | 66 | 70 | .485 | 15.5 | -54 | L4 |
10 Mariners | 64 | 72 | .471 | 17.5 | -65 | L3 |
11 Twins | 64 | 72 | .471 | 17.5 | -60 | L4 |
12 Tigers | 63 | 72 | .467 | 18 | +70 | W1 |
13 Royals | 62 | 75 | .453 | 20 | -73 | W3 |
14 Athletics | 53 | 83 | .390 | 28.5 | -188 | L2 |
15 Angels | 52 | 84 | .382 | 29.5 | -79 | L6 |
National League
| Team | W | L | PCT | GB | DIFF | STRK |
|---|---|---|---|---|---|---|
| 1Brewers | 85 | 51 | .625 | - | +180 | W4 |
2 Braves | 81 | 55 | .596 | 4 | +116 | W6 |
3 Dodgers | 81 | 55 | .596 | 4 | +148 | L1 |
4 Cubs | 77 | 59 | .566 | 8 | +129 | W1 |
5 Phillies | 76 | 60 | .559 | 9 | +27 | W3 |
6 Diamondbacks | 73 | 65 | .529 | 13 | +5 | L1 |
7 Padres | 72 | 64 | .529 | 13 | +11 | L2 |
8 Marlins | 68 | 68 | .500 | 17 | +11 | L2 |
9 Cardinals | 68 | 69 | .496 | 17.5 | -14 | L1 |
10 Pirates | 66 | 71 | .482 | 19.5 | +25 | W1 |
11 Nationals | 65 | 73 | .471 | 21 | +20 | W3 |
12 Reds | 64 | 72 | .471 | 21 | -110 | L1 |
| 13Mets | 61 | 75 | .449 | 24 | -50 | W1 |
14 Giants | 56 | 81 | .409 | 29.5 | -74 | W1 |
15 Rockies | 52 | 84 | .382 | 33 | -141 | L3 |
TEX
VS
MIL
Pitchers
Kumar Rocker
Catchers
Elias Diaz
Infielders
Corey Seager
Ezequiel Duran
Jake Burger
Cody Freeman
Outfielders
Wyatt Langford
Brandon Nimmo
Evan Carter
Designated Hitters
Joc Pederson
Pitchers
Dustin May
Catchers
Gary Sanchez
Infielders
Brice Turang
Jake Bauers
David Hamilton
Joey Ortiz
Outfielders
Garrett Mitchell
Jackson Chourio
Sal Frelick
Designated Hitters
Christian Yelich
Rangers
VS
Brewers
Batting
137
Team Games Played
137
4552
At Bats
4642
1100
Hits
1185
534
Runs Batted In
644
154
Home Runs
126
64
Stolen Bases
135
.242
Batting Average
.255
554
Runs
683
200
Doubles
238
21
Triples
22
1804
Total Bases
1845
446
Walks
566
1166
Strikeouts
1141
.317
On Base Percentage
.338
.396
Slugging Percentage
.397
.713
OBP Pct + SLG Pct
.736
137
Games Played
137
137
Games Started
137
65
Hit By Pitch
36
0.0
Wins Above Replacement
0.0
0.0
Offensive Wins Above Replacement
0.0
20
Caught Stealing
42
1
Is Qualified
1
576.7
Runs Created
652.0
4.3
Runs Created Per 27 Outs
4.8
.087
Walks Per Plate Appearance
.106
0.38
Walk To Strikeout Ratio
0.50
.155
Isolated Power
.142
.262
Secondary Average
.284
3.88
Pitches Per Plate Appearance
4.00
375
Extra Base Hits
386
5117
Plate Appearances
5319
29.6
At Bats Per Home Run
36.8
26
Sacrifice Hit
30
27
Sacrifice Flies
38
Pitching
137
Team Games Played
137
43
Quality Starts
48
67
Wins
85
70
Losses
52
38
Saves
44
68
Holds
71
1154
Hits
994
571
Earned runs
459
163
Home Runs
137
416
Walks
430
1155
Strikeouts
1320
8.7
Strikeouts Per 9 Innings
9.7
145.1
Pitches Per Start
145.4
1.31
Walks Plus Hits Per Inning Pitched
1.16
4.29
Earned Run Average
3.37
70
Losses
52
1198.1
Innings pitched
1225.2
.489
Win Percentage
.620
54
Save Opportunities
62
.249
Opponent Batting Average
.220
.317
Opponent's On-base pct.
.294
.412
Opponent's Slugging pct.
.356
.729
Opponent's OPB Pct + SLG Pct
.650
4626
At Bats
4528
219
Doubles
181
22
Triples
13
53
Batters Hit
55
85
Stolen Bases
61
137
Games Played
137
0
Complete Games
1
12
Shutouts
9
41
Wild Pitches
45
586
Runs Batted In
485
1
Balks
6
1198.1
Innings pitched
1225.2
8.7
Strikeouts Per 9 Innings
9.7
24
Caught Stealing
29
137
Games Started
137
0.0
Wins Above Replacement
0.0
1
Is Qualified
1
605
Runs
506
571
Earned Runs
459
1906
Total Bases
1612
Fielding
137
Team Games Played
137
1198
Full Innings
1226
4713
Total Chances
4811
3595
Putouts
3677
1059
Assists
1073
59
Errors
61
200
Double Plays
238
0.987
Fielding Percentage
0.987
35.0
Range Factor
34.9
0.0
Zone Rating
0.0
137
Games Played
137
0
Games Started
0
0.0
Defensive Wins Above Replacement
0.0
1
Qualified
1