

Rangers vs Diamondbacks Live Score (13 Sep, 2026)
Game Information
Stage
STD
Season
2026
First Pitch
Sat, Sep 12, 8:10 pm
Venue
Chase Field
Location
Phoenix, Arizona
Venue Type
Indoor
Broadcast
MLB.TV
Attendance
34,300
Live Situation
3Balls
3Strikes
0Outs
—Pitcher
—At Bat
Pitch Sequence
1
STRIKE LOOKING
Four-seam FB
95 MPH
2
STRIKE SWINGING
Changeup
87 MPH
3
BALL
Four-seam FB
95 MPH
4
BALL
Curve
81 MPH
5
BALL
Changeup
88 MPH
6
STRIKE SWINGING
Four-seam FB
96 MPH
Injury Report
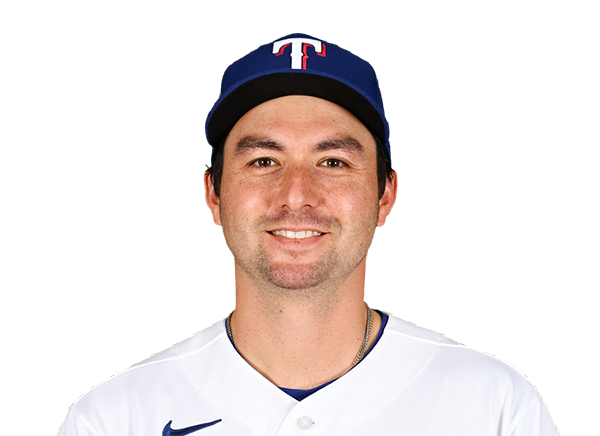


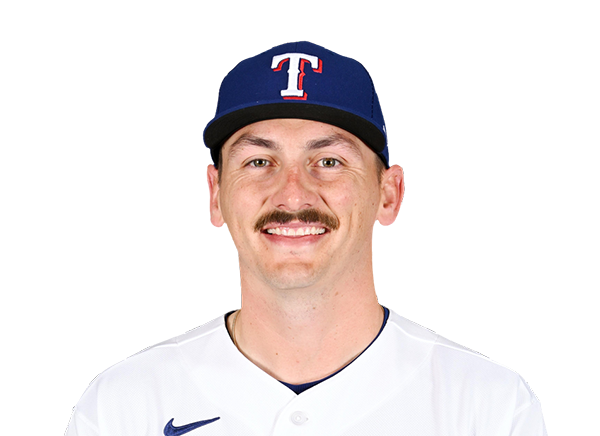






Team Stats
 TEX
ARI


6
Runs
2
13
Hits
6
0
Errors
0
1
Home Runs
0
1
Walks
2
9
Strikeouts
10
Player Box Score
Texas Rangers
| Player | H-AB | AB | R | H | RBI | HR | BB | K | #P | AVG | OBP | SLG |
|---|---|---|---|---|---|---|---|---|---|---|---|---|
 Joc Pederson | 0-2 | 2 | 0 | 0 | 0 | 0 | 0 | 1 | 12 | .235 | .329 | .487 |
 Justin Foscue | 0-2 | 2 | 0 | 0 | 0 | 0 | 0 | 2 | 8 | .268 | .329 | .498 |
 Corey Seager | 1-4 | 4 | 1 | 1 | 0 | 0 | 1 | 0 | 19 | .225 | .319 | .426 |
 Josh Jung | 2-5 | 5 | 1 | 2 | 1 | 0 | 0 | 0 | 18 | .295 | .362 | .440 |
 Cody Freeman | 0-0 | 0 | 0 | 0 | 0 | 0 | 0 | 0 | 0 | .256 | .322 | .329 |
 Brandon Nimmo | 2-5 | 5 | 1 | 2 | 1 | 0 | 0 | 2 | 23 | .261 | .327 | .413 |
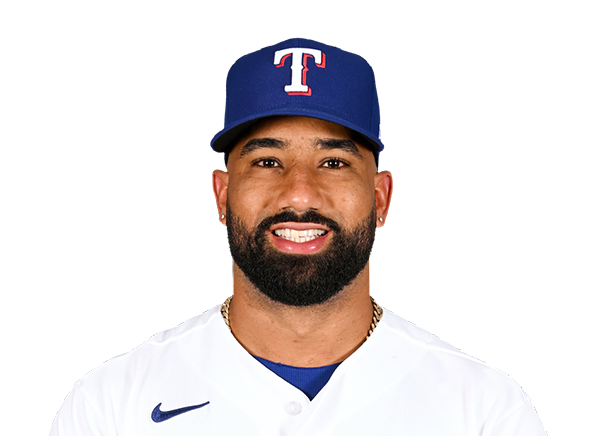 Ezequiel Duran | 1-5 | 5 | 0 | 1 | 2 | 0 | 0 | 0 | 9 | .268 | .328 | .440 |
 Wyatt Langford | 2-4 | 4 | 1 | 2 | 1 | 1 | 0 | 2 | 16 | .244 | .331 | .444 |
 Jake Burger | 1-4 | 4 | 1 | 1 | 0 | 0 | 0 | 1 | 12 | .235 | .306 | .429 |
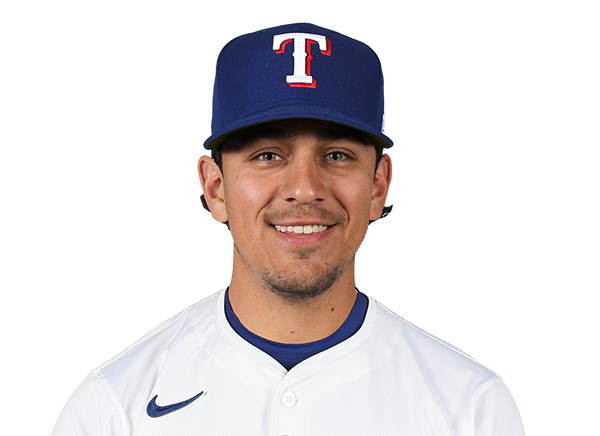 Nicky Lopez | 0-2 | 2 | 0 | 0 | 0 | 0 | 0 | 0 | 8 | .272 | .313 | .313 |
 Evan Carter | 1-1 | 1 | 0 | 1 | 0 | 0 | 0 | 0 | 2 | .196 | .294 | .322 |
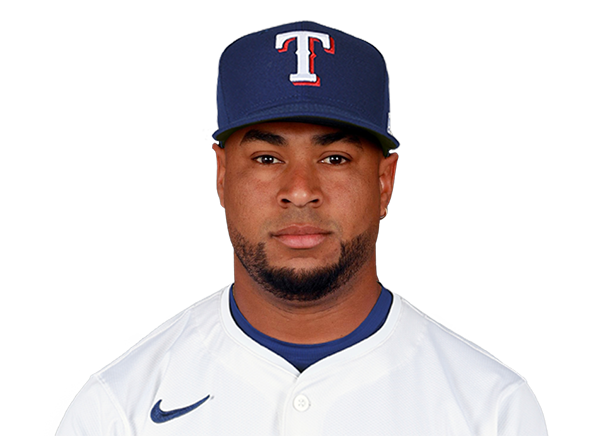 Elias Diaz | 3-4 | 4 | 1 | 3 | 1 | 0 | 0 | 1 | 15 | .240 | .272 | .405 |
Arizona Diamondbacks
| Player | H-AB | AB | R | H | RBI | HR | BB | K | #P | AVG | OBP | SLG |
|---|---|---|---|---|---|---|---|---|---|---|---|---|
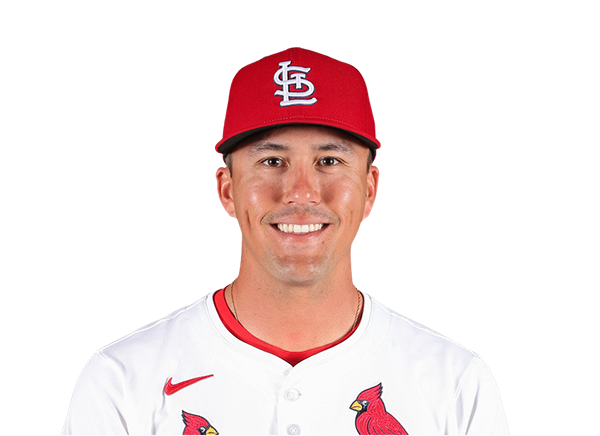 Lars Nootbaar | 0-2 | 2 | 0 | 0 | 0 | 0 | 0 | 0 | 6 | .234 | .342 | .372 |
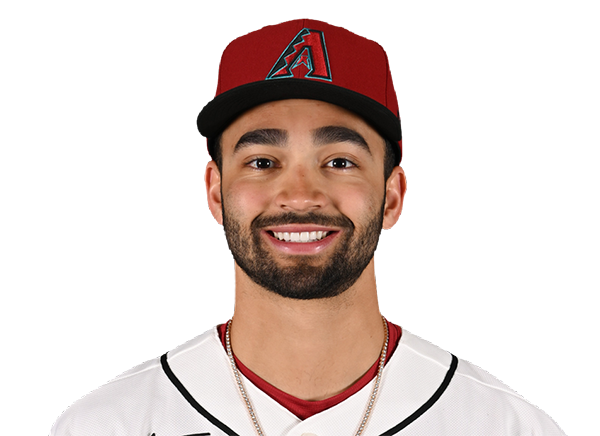 Jordan Lawlar | 0-2 | 2 | 0 | 0 | 0 | 0 | 0 | 1 | 8 | .253 | .317 | .411 |
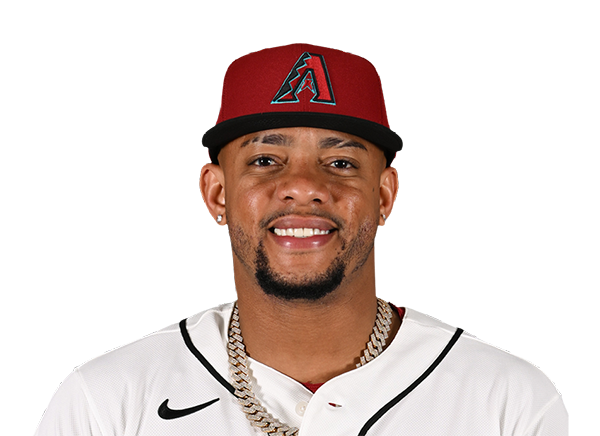 Ketel Marte | 0-4 | 4 | 0 | 0 | 0 | 0 | 0 | 0 | 15 | .250 | .317 | .443 |
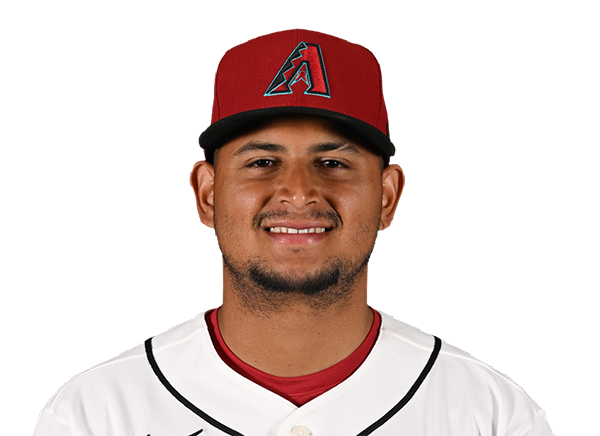 Gabriel Moreno | 2-4 | 4 | 1 | 2 | 0 | 0 | 0 | 1 | 17 | .302 | .379 | .464 |
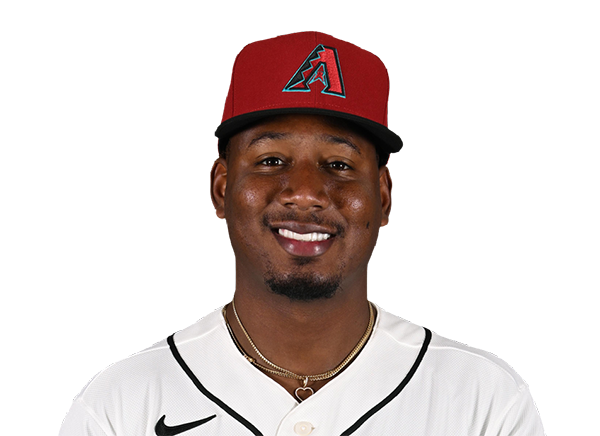 Geraldo Perdomo | 1-4 | 4 | 0 | 1 | 0 | 0 | 0 | 0 | 12 | .249 | .356 | .361 |
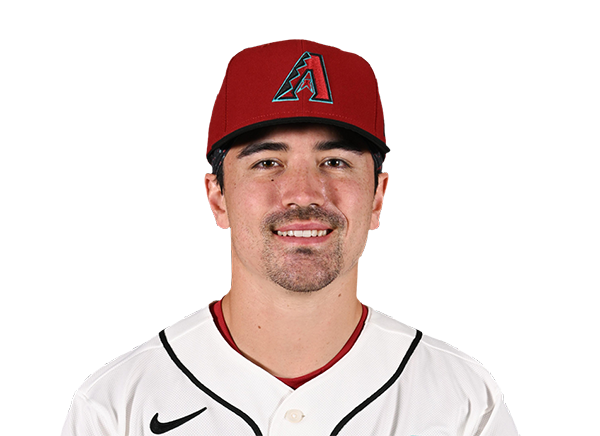 Corbin Carroll | 0-3 | 3 | 0 | 0 | 1 | 0 | 0 | 3 | 16 | .238 | .331 | .467 |
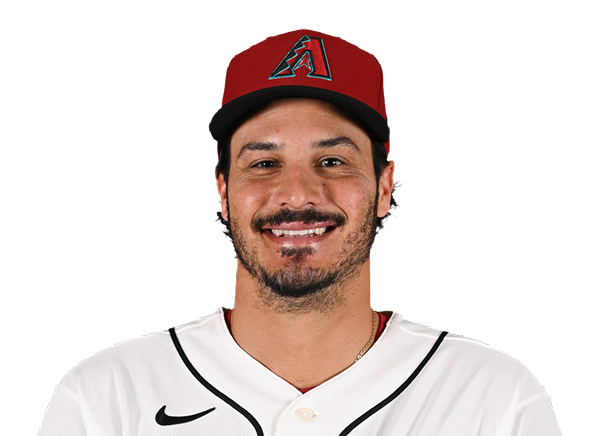 Nolan Arenado | 0-2 | 2 | 0 | 0 | 0 | 0 | 1 | 2 | 15 | .238 | .318 | .437 |
 Tim Tawa | 1-3 | 3 | 1 | 1 | 0 | 0 | 1 | 0 | 18 | .248 | .306 | .407 |
 Pavin Smith | 1-1 | 1 | 0 | 1 | 1 | 0 | 0 | 0 | 6 | .152 | .244 | .203 |
 Ildemaro Vargas | 1-3 | 3 | 0 | 1 | 0 | 0 | 0 | 0 | 11 | .253 | .296 | .381 |
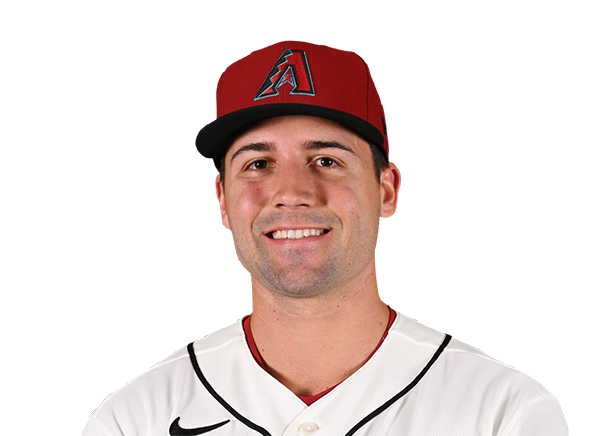 Ryan Waldschmidt | 0-4 | 4 | 0 | 0 | 0 | 0 | 0 | 3 | 20 | .256 | .326 | .362 |
Texas Rangers
| Player | IP | H | R | ER | BB | K | HR | PC-ST | ERA | PC |
|---|---|---|---|---|---|---|---|---|---|---|
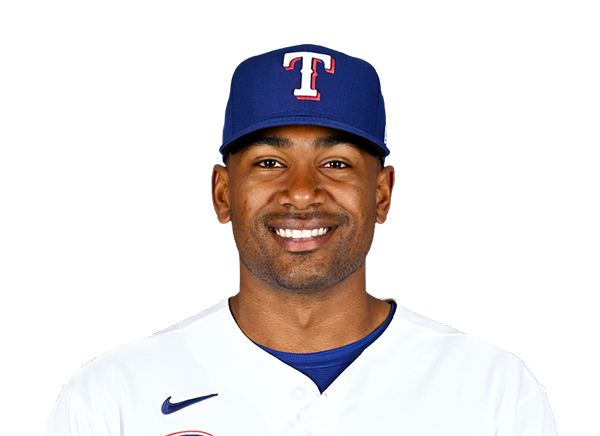 Kumar Rocker | 4.0 | 2 | 1 | 1 | 2 | 5 | 0 | 65-46 | 4.54 | 65 |
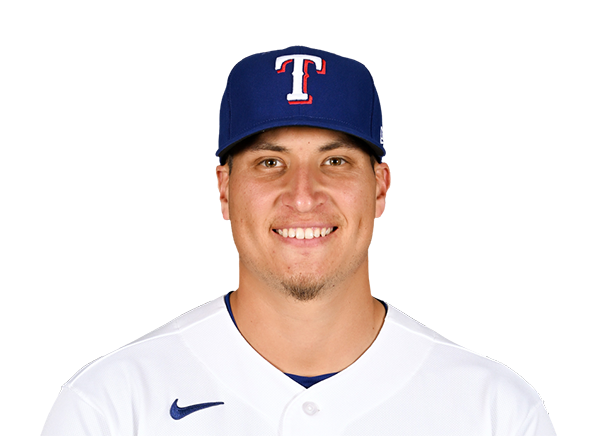 Robert Garcia | 1.0 | 0 | 0 | 0 | 0 | 1 | 0 | 16-10 | 2.45 | 16 |
 Nathan Eovaldi | 2.2 | 4 | 1 | 1 | 0 | 2 | 0 | 45-31 | 4.19 | 45 |
 Jacob Latz | 1.1 | 0 | 0 | 0 | 0 | 2 | 0 | 18-11 | 1.81 | 18 |
Arizona Diamondbacks
| Player | IP | H | R | ER | BB | K | HR | PC-ST | ERA | PC |
|---|---|---|---|---|---|---|---|---|---|---|
 Brandon Pfaadt | 6.2 | 10 | 6 | 6 | 0 | 7 | 1 | 99-70 | 3.77 | 99 |
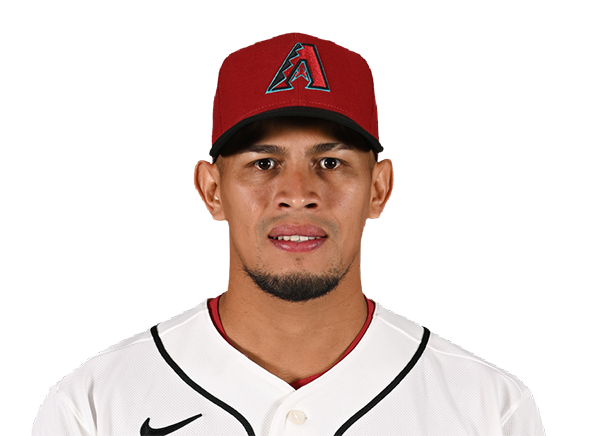 Jonathan Loaisiga | 0.1 | 0 | 0 | 0 | 0 | 0 | 0 | 3-2 | 2.41 | 3 |
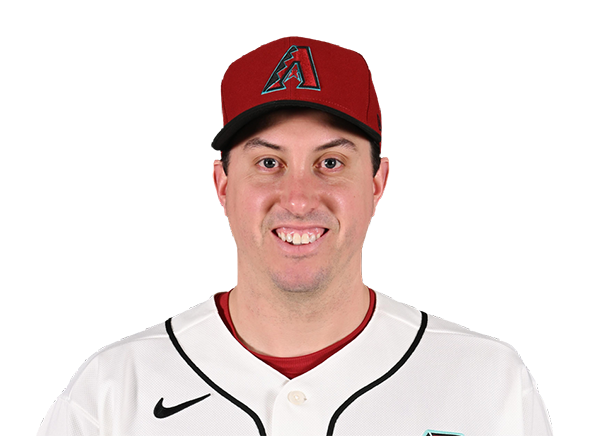 Derek Law | 1.2 | 3 | 0 | 0 | 1 | 2 | 0 | 39-23 | 1.00 | 39 |
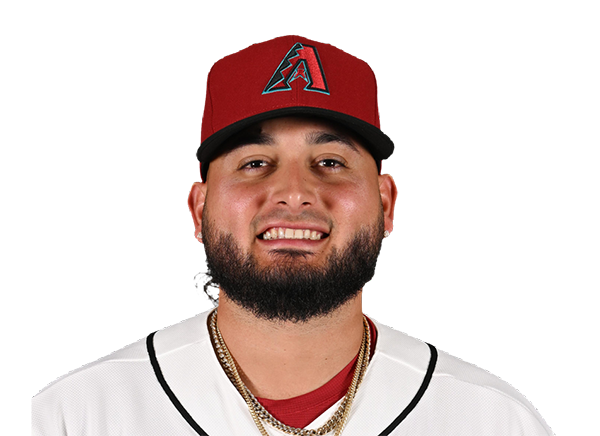 Juan Morillo | 0.1 | 0 | 0 | 0 | 0 | 0 | 0 | 1-1 | 2.31 | 1 |
H2H / Season Series
ARI2–6
TEX
ARI9–1
TEX
TEX6–5
ARI
TEX7–4
ARI
TEX0–1
ARI
ARI5–2
TEX
TEX4–6
ARI
Last 5 Games
| Date | Opponent | Result |
|---|---|---|
| Sep 12 | @ ARI | W6–2 |
| Sep 11 | @ ARI | L1–9 |
| Sep 10 |  @ SEA | L3–4 |
| Sep 9 | @ SEA | L2–3 |
| Sep 8 | @ SEA | W10–5 |
| Date | Opponent | Result |
|---|---|---|
| Sep 12 | vs TEX | L2–6 |
| Sep 11 | vs TEX | W9–1 |
| Sep 9 |  @ KC | L2–5 |
| Sep 8 | @ KC | W5–3 |
| Sep 7 | @ KC | W5–4 |
Standings
American League
| Team | W | L | PCT | GB | DIFF | STRK |
|---|---|---|---|---|---|---|
1 Rays | 89 | 59 | .601 | - | +59 | W2 |
2 White Sox | 76 | 72 | .514 | 13 | +36 | W1 |
3 Astros | 75 | 74 | .503 | 14.5 | -43 | L2 |
4 Yankees | 85 | 63 | .574 | 4 | +123 | L1 |
5 Red Sox | 81 | 68 | .544 | 8.5 | +85 | W1 |
6 Guardians | 75 | 74 | .503 | 14.5 | -14 | L1 |
7 Blue Jays | 74 | 75 | .497 | 15.5 | -38 | W1 |
| 8Rangers | 73 | 76 | .490 | 16.5 | -45 | W1 |
9 Orioles | 72 | 77 | .483 | 17.5 | -28 | L1 |
10 Twins | 70 | 78 | .473 | 19 | -55 | W1 |
| 11Mariners | 70 | 79 | .470 | 19.5 | -57 | W1 |
12 Tigers | 69 | 79 | .466 | 20 | +63 | W3 |
| 13Royals | 66 | 83 | .443 | 23.5 | -91 | L1 |
14 Athletics | 60 | 89 | .403 | 29.5 | -204 | L1 |
15 Angels | 56 | 92 | .378 | 33 | -75 | L2 |
National League
| Team | W | L | PCT | GB | DIFF | STRK |
|---|---|---|---|---|---|---|
1 Brewers | 93 | 56 | .624 | - | +196 | W5 |
2 Dodgers | 90 | 58 | .608 | 2.5 | +172 | L1 |
3 Braves | 88 | 61 | .591 | 5 | +121 | W3 |
4 Cubs | 83 | 66 | .557 | 10 | +139 | W2 |
5 Phillies | 82 | 67 | .550 | 11 | +26 | L3 |
6 Padres | 80 | 68 | .541 | 12.5 | +20 | W6 |
| 7Diamondbacks | 79 | 70 | .530 | 14 | +3 | L1 |
8 Pirates | 74 | 75 | .497 | 19 | +25 | L2 |
9 Marlins | 73 | 76 | .490 | 20 | +4 | W1 |
10 Cardinals | 73 | 76 | .490 | 20 | -9 | L1 |
11 Reds | 69 | 79 | .466 | 23.5 | -146 | L5 |
12 Mets | 69 | 79 | .466 | 23.5 | -32 | W1 |
13 Nationals | 69 | 81 | .460 | 24.5 | +2 | W2 |
14 Giants | 62 | 87 | .416 | 31 | -75 | L2 |
15 Rockies | 55 | 93 | .372 | 37.5 | -162 | L6 |
TEX
VS
ARI
Pitchers
Kumar Rocker
Catchers
Elias Diaz
Infielders
Corey Seager
Josh Jung
Jake Burger
Nicky Lopez
Outfielders
Brandon Nimmo
Ezequiel Duran
Wyatt Langford
Designated Hitters
Joc Pederson
Pitchers
Brandon Pfaadt
Catchers
Gabriel Moreno
Infielders
Ketel Marte
Geraldo Perdomo
Nolan Arenado
Tim Tawa
Outfielders
Lars Nootbaar
Corbin Carroll
Ryan Waldschmidt
Designated Hitters
Pavin Smith
Rangers
VS
Diamondbacks
Batting
149
Team Games Played
149
4951
At Bats
4988
1203
Hits
1209
597
Runs Batted In
629
172
Home Runs
145
73
Stolen Bases
98
.243
Batting Average
.242
617
Runs
659
216
Doubles
248
22
Triples
36
1979
Total Bases
1964
487
Walks
497
1270
Strikeouts
1089
.318
On Base Percentage
.315
.400
Slugging Percentage
.394
.717
OBP Pct + SLG Pct
.709
149
Games Played
149
149
Games Started
149
70
Hit By Pitch
53
0.0
Wins Above Replacement
0.0
0.0
Offensive Wins Above Replacement
0.0
20
Caught Stealing
23
1
Is Qualified
1
636.9
Runs Created
639.0
4.4
Runs Created Per 27 Outs
4.3
.087
Walks Per Plate Appearance
.088
0.38
Walk To Strikeout Ratio
0.46
.157
Isolated Power
.151
.266
Secondary Average
.266
3.88
Pitches Per Plate Appearance
3.94
410
Extra Base Hits
429
5574
Plate Appearances
5629
28.8
At Bats Per Home Run
34.4
33
Sacrifice Hit
38
32
Sacrifice Flies
50
Pitching
149
Team Games Played
149
48
Quality Starts
53
73
Wins
79
76
Losses
70
40
Saves
37
72
Holds
79
1254
Hits
1248
625
Earned runs
602
178
Home Runs
166
453
Walks
446
1251
Strikeouts
1029
8.6
Strikeouts Per 9 Innings
7.0
145.2
Pitches Per Start
141.6
1.31
Walks Plus Hits Per Inning Pitched
1.28
4.31
Earned Run Average
4.09
76
Losses
70
1304.1
Innings pitched
1325.0
.490
Win Percentage
.530
58
Save Opportunities
54
.249
Opponent Batting Average
.248
.317
Opponent's On-base pct.
.315
.412
Opponent's Slugging pct.
.409
.729
Opponent's OPB Pct + SLG Pct
.724
5031
At Bats
5024
239
Doubles
251
23
Triples
28
61
Batters Hit
62
91
Stolen Bases
89
149
Games Played
149
0
Complete Games
1
13
Shutouts
10
43
Wild Pitches
29
643
Runs Batted In
639
1
Balks
5
1304.1
Innings pitched
1325.0
8.6
Strikeouts Per 9 Innings
7.0
24
Caught Stealing
19
149
Games Started
149
0.0
Wins Above Replacement
0.0
1
Is Qualified
1
662
Runs
656
625
Earned Runs
602
2073
Total Bases
2053
Fielding
149
Team Games Played
149
1304
Full Innings
1325
5139
Total Chances
5325
3913
Putouts
3975
1162
Assists
1294
64
Errors
56
216
Double Plays
248
0.988
Fielding Percentage
0.989
35.0
Range Factor
35.8
0.0
Zone Rating
0.0
149
Games Played
149
0
Games Started
0
0.0
Defensive Wins Above Replacement
0.0
1
Qualified
1