

Rangers vs Rays Live Score (28 Jul, 2026)
Game Information
Stage
Standard
Season
2026
First Pitch
Tue, Jul 28, 6:40 pm
Venue
Tropicana Field
Location
St. Petersburg, Florida
Attendance
14,502
Live Situation
0Balls
0Strikes
0Outs
—Pitcher
—At Bat
Pitch Sequence
1
BALL IN PLAY
Four-seam FB
94 MPH
Injury Report

Team Stats
 TEX
TB


4
Runs
1
7
Hits
5
1
Errors
1
1
Home Runs
0
4
Walks
1
13
Strikeouts
9
Player Box Score
Texas Rangers
| Player | H-AB | AB | R | H | RBI | HR | BB | K | #P | AVG | OBP | SLG |
|---|---|---|---|---|---|---|---|---|---|---|---|---|
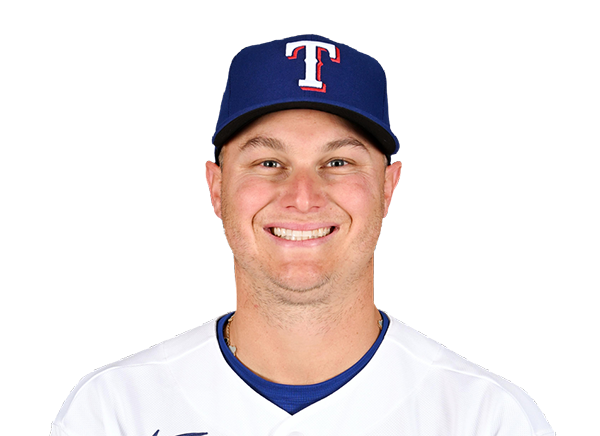 Joc Pederson | 1-5 | 5 | 1 | 1 | 0 | 0 | 0 | 3 | 27 | .254 | .340 | .507 |
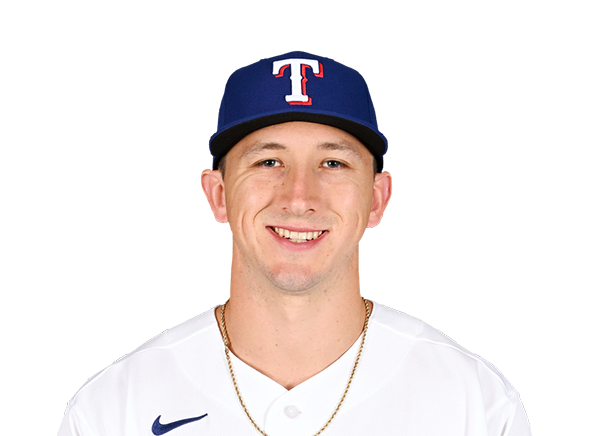 Wyatt Langford | 1-5 | 5 | 0 | 1 | 0 | 0 | 0 | 3 | 21 | .283 | .325 | .516 |
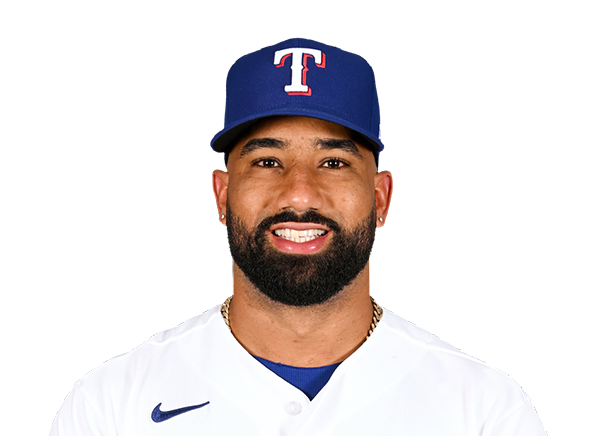 Ezequiel Duran | 1-2 | 2 | 1 | 1 | 1 | 0 | 0 | 0 | 10 | .275 | .326 | .457 |
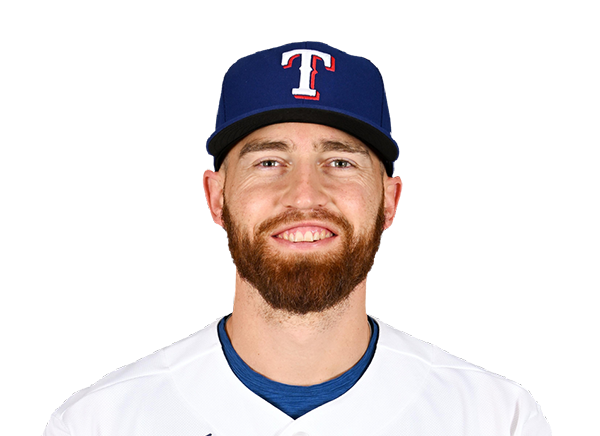 Brandon Nimmo | 0-4 | 4 | 0 | 0 | 0 | 0 | 0 | 2 | 17 | .268 | .333 | .430 |
 Evan Carter | 2-3 | 3 | 1 | 2 | 1 | 0 | 1 | 1 | 16 | .204 | .320 | .352 |
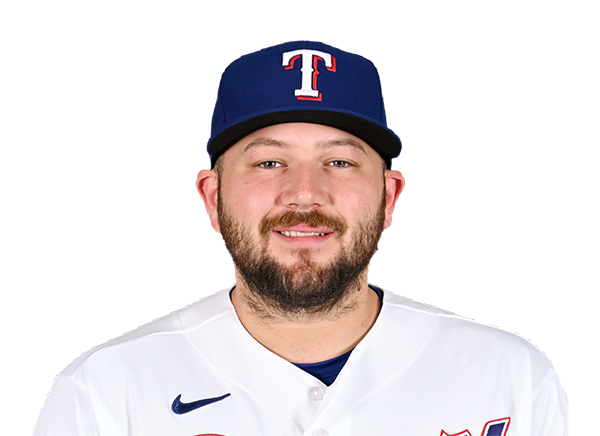 Jake Burger | 1-4 | 4 | 0 | 1 | 0 | 0 | 0 | 1 | 14 | .238 | .300 | .429 |
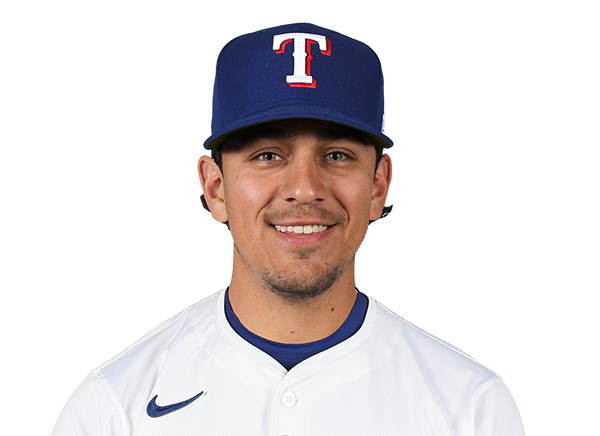 Nicky Lopez | 0-2 | 2 | 0 | 0 | 1 | 0 | 1 | 1 | 20 | .319 | .357 | .361 |
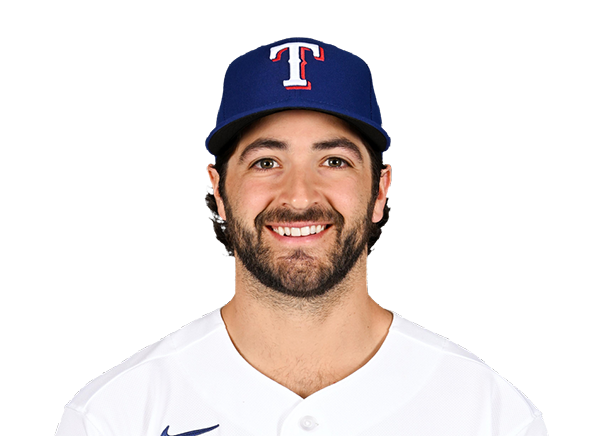 Josh Smith | 0-3 | 3 | 0 | 0 | 0 | 0 | 1 | 1 | 12 | .215 | .296 | .274 |
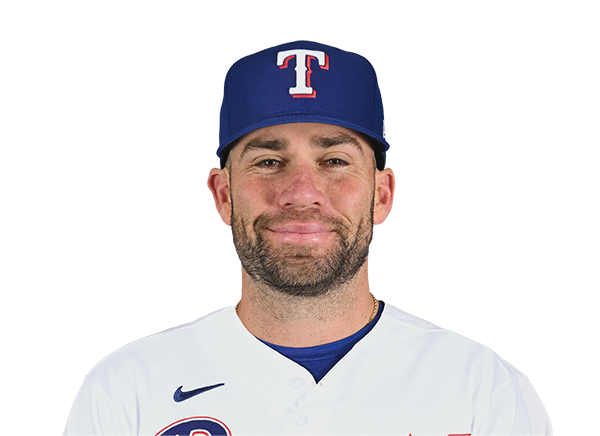 Austin Wynns | 1-3 | 3 | 1 | 1 | 1 | 1 | 1 | 1 | 20 | .250 | .333 | .625 |
Tampa Bay Rays
| Player | H-AB | AB | R | H | RBI | HR | BB | K | #P | AVG | OBP | SLG |
|---|---|---|---|---|---|---|---|---|---|---|---|---|
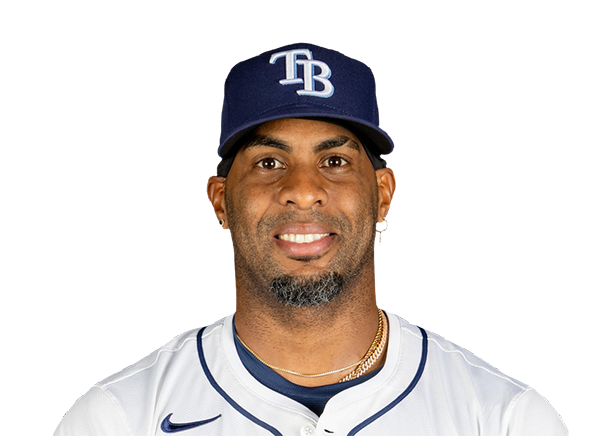 Yandy Diaz | 0-3 | 3 | 1 | 0 | 0 | 0 | 1 | 1 | 18 | .301 | .376 | .457 |
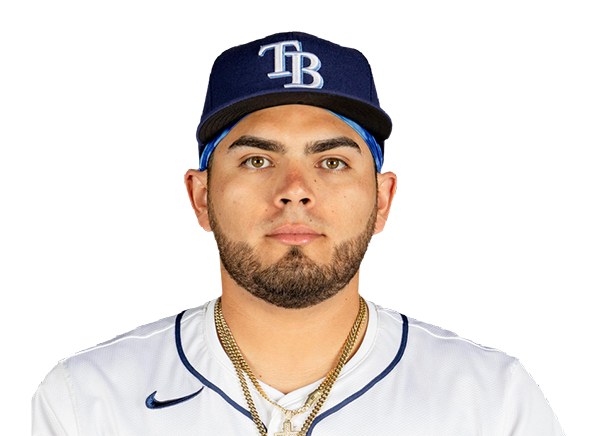 Jonathan Aranda | 2-4 | 4 | 0 | 2 | 0 | 0 | 0 | 1 | 11 | .285 | .378 | .439 |
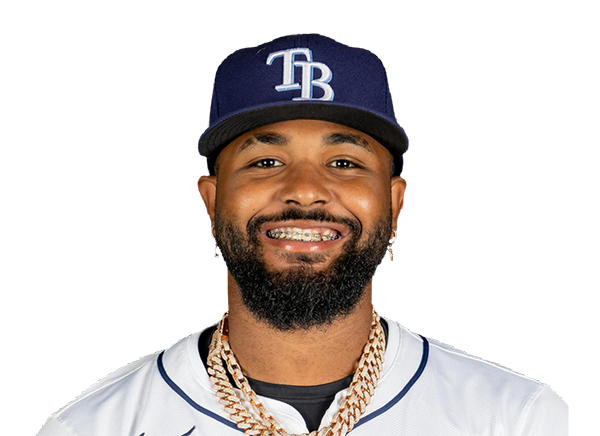 Junior Caminero | 2-4 | 4 | 0 | 2 | 1 | 0 | 0 | 0 | 17 | .285 | .373 | .550 |
 Cedric Mullins | 0-3 | 3 | 0 | 0 | 0 | 0 | 0 | 1 | 15 | .201 | .279 | .348 |
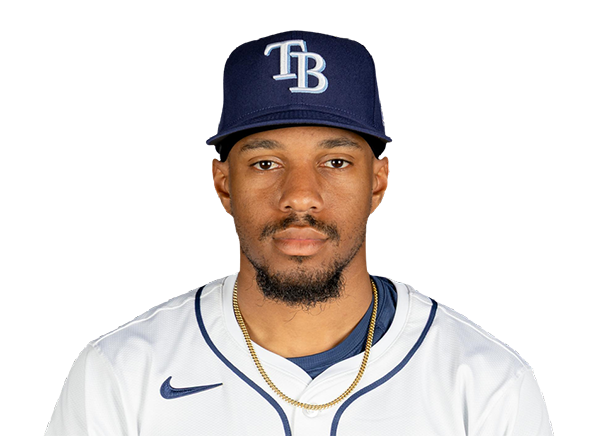 Chandler Simpson | 0-4 | 4 | 0 | 0 | 0 | 0 | 0 | 0 | 11 | .293 | .326 | .355 |
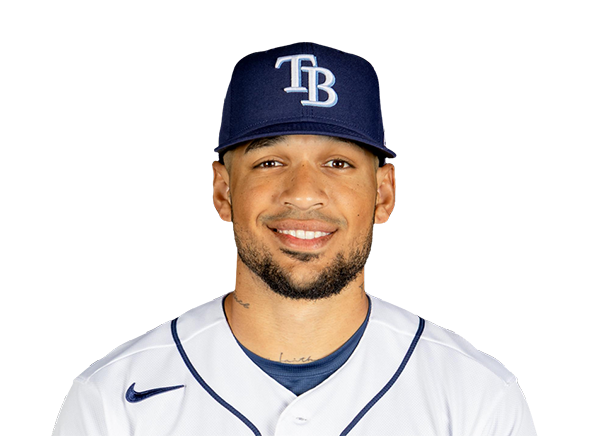 Victor Mesa Jr. | 0-2 | 2 | 0 | 0 | 0 | 0 | 0 | 1 | 6 | .223 | .313 | .455 |
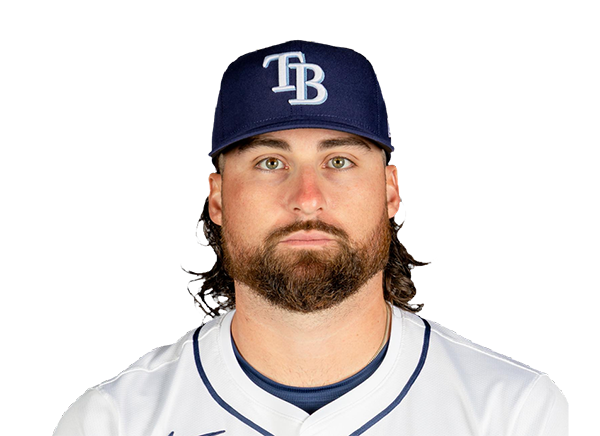 Ryan Vilade | 0-2 | 2 | 0 | 0 | 0 | 0 | 0 | 1 | 7 | .256 | .320 | .468 |
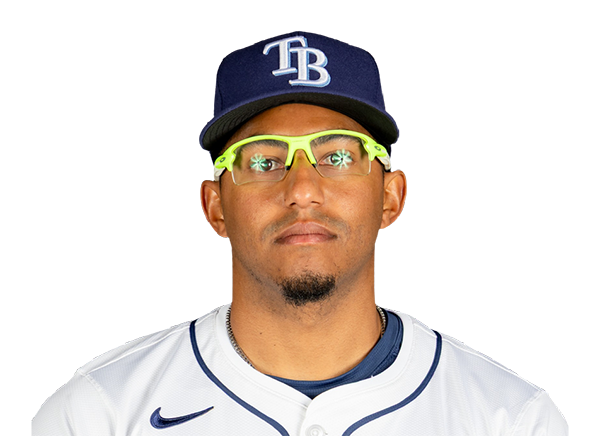 Richie Palacios | 0-2 | 2 | 0 | 0 | 0 | 0 | 0 | 2 | 9 | .230 | .325 | .338 |
 Jonny DeLuca | 0-1 | 1 | 0 | 0 | 0 | 0 | 0 | 0 | 1 | .262 | .298 | .431 |
 Taylor Walls | 0-2 | 2 | 0 | 0 | 0 | 0 | 0 | 2 | 8 | .221 | .311 | .293 |
 Ben Williamson | 1-1 | 1 | 0 | 1 | 0 | 0 | 0 | 0 | 4 | .252 | .315 | .330 |
 Hunter Feduccia | 0-2 | 2 | 0 | 0 | 0 | 0 | 0 | 0 | 4 | .230 | .305 | .333 |
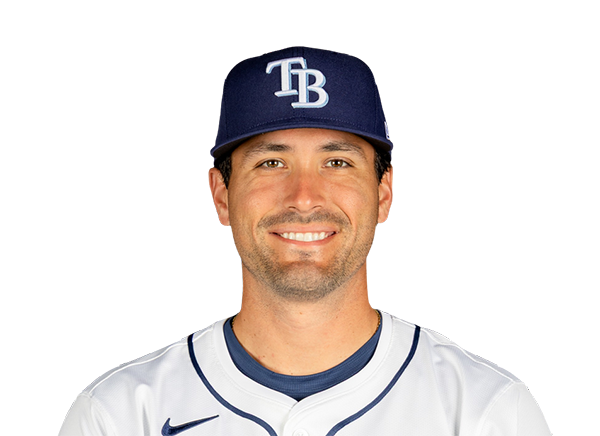 Nick Fortes | 0-1 | 1 | 0 | 0 | 0 | 0 | 0 | 0 | 3 | .280 | .320 | .388 |
Texas Rangers
| Player | IP | H | R | ER | BB | K | HR | PC-ST | ERA | PC |
|---|---|---|---|---|---|---|---|---|---|---|
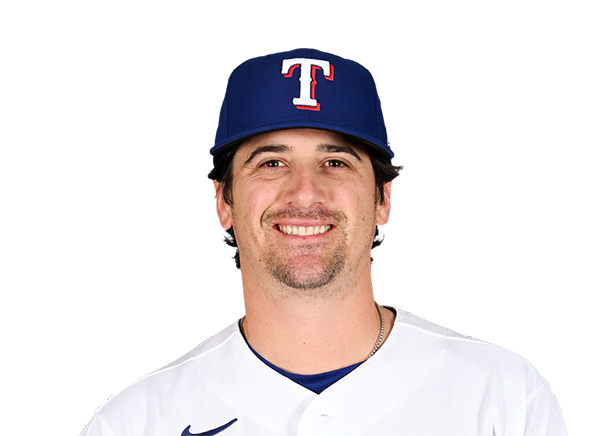 Cal Quantrill | 5.1 | 2 | 1 | 1 | 1 | 7 | 0 | 69-45 | 3.84 | 69 |
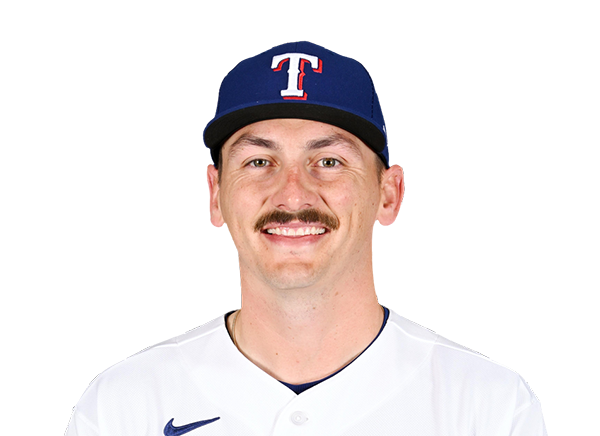 Peyton Gray | 0.2 | 1 | 0 | 0 | 0 | 1 | 0 | 13-9 | 3.43 | 13 |
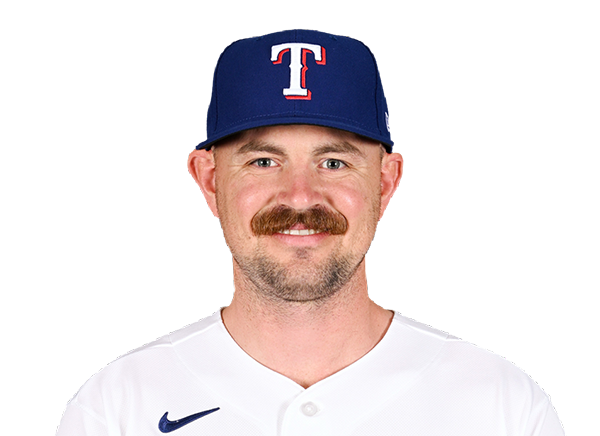 Tyler Alexander | 1.0 | 1 | 0 | 0 | 0 | 1 | 0 | 13-8 | 3.13 | 13 |
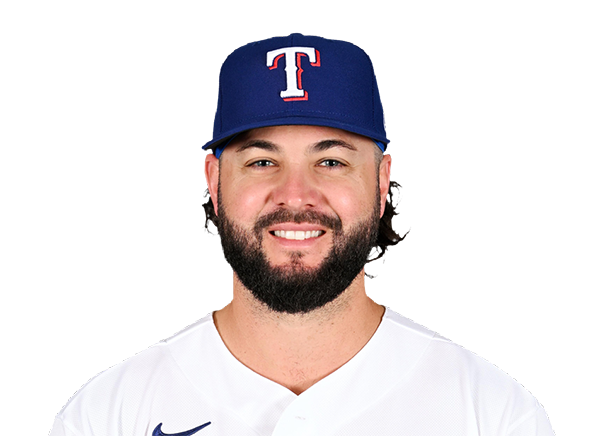 Jakob Junis | 1.0 | 1 | 0 | 0 | 0 | 0 | 0 | 9-6 | 2.70 | 9 |
 Jacob Latz | 1.0 | 0 | 0 | 0 | 0 | 0 | 0 | 10-8 | 1.80 | 10 |
Tampa Bay Rays
| Player | IP | H | R | ER | BB | K | HR | PC-ST | ERA | PC |
|---|---|---|---|---|---|---|---|---|---|---|
 Griffin Jax | 5.2 | 5 | 2 | 1 | 3 | 10 | 0 | 93-62 | 3.74 | 93 |
 Steven Matz | 1.1 | 1 | 1 | 1 | 0 | 0 | 1 | 22-14 | 6.29 | 22 |
 Craig Kimbrel | 1.0 | 1 | 1 | 1 | 1 | 1 | 0 | 30-20 | 4.50 | 30 |
 Kevin Kelly | 1.0 | 0 | 0 | 0 | 0 | 2 | 0 | 12-8 | 2.22 | 12 |
H2H / Season Series
TB3–2
TEX
TB3–0
TEX
TB1–4
TEX
Last 5 Games
| Date | Opponent | Result |
|---|---|---|
| Aug 23 |  vs LAA | W5–3 |
| Aug 22 | vs LAA | L0–3 |
| Aug 21 | vs LAA | W2–1 |
| Aug 20 |  vs WSH | W2–0 |
| Aug 19 | vs WSH | L0–6 |
| Date | Opponent | Result |
|---|---|---|
| Aug 23 |  @ BAL | W3–1 |
| Aug 22 | @ BAL | L2–3 |
| Aug 21 | @ BAL | L3–5 |
| Aug 20 |  vs TOR | L1–5 |
| Aug 19 | vs TOR | W7–6 |
Standings
American League
| Team | W | L | PCT | GB | DIFF | STRK |
|---|---|---|---|---|---|---|
| 1Rays | 77 | 53 | .592 | - | +44 | W1 |
2 White Sox | 68 | 62 | .523 | 9 | +43 | W1 |
3 Astros | 65 | 66 | .496 | 12.5 | -44 | L2 |
4 Yankees | 74 | 56 | .569 | 3 | +100 | W1 |
5 Red Sox | 71 | 59 | .546 | 6 | +99 | W3 |
| 6Rangers | 65 | 66 | .496 | 12.5 | -46 | W1 |
7 Guardians | 65 | 66 | .496 | 12.5 | -9 | W4 |
| 8Blue Jays | 64 | 68 | .485 | 14 | -55 | L1 |
9 Twins | 63 | 68 | .481 | 14.5 | -54 | L3 |
| 10Orioles | 63 | 68 | .481 | 14.5 | -35 | L1 |
11 Mariners | 62 | 69 | .473 | 15.5 | -61 | L1 |
12 Tigers | 61 | 69 | .469 | 16 | +73 | L5 |
13 Royals | 58 | 74 | .439 | 20 | -91 | W8 |
| 14Angels | 52 | 79 | .397 | 25.5 | -70 | L1 |
15 Athletics | 51 | 80 | .389 | 26.5 | -187 | W2 |
National League
| Team | W | L | PCT | GB | DIFF | STRK |
|---|---|---|---|---|---|---|
1 Brewers | 81 | 49 | .623 | - | +163 | W3 |
2 Dodgers | 80 | 51 | .611 | 1.5 | +151 | W6 |
3 Braves | 75 | 55 | .577 | 6 | +108 | L2 |
4 Cubs | 75 | 56 | .573 | 6.5 | +115 | W1 |
5 Phillies | 73 | 58 | .557 | 8.5 | +27 | W9 |
6 Padres | 71 | 60 | .542 | 10.5 | +16 | W3 |
7 Diamondbacks | 69 | 62 | .527 | 12.5 | +9 | W1 |
8 Marlins | 67 | 64 | .511 | 14.5 | +21 | W3 |
9 Cardinals | 66 | 66 | .500 | 16 | -2 | L3 |
10 Pirates | 63 | 69 | .477 | 19 | +25 | L3 |
11 Reds | 62 | 69 | .473 | 19.5 | -94 | L1 |
| 12Nationals | 61 | 71 | .462 | 21 | +10 | L4 |
13 Mets | 59 | 72 | .450 | 22.5 | -40 | L1 |
14 Giants | 52 | 78 | .400 | 29 | -80 | L4 |
15 Rockies | 50 | 80 | .385 | 31 | -136 | L6 |
TEX
VS
TB
Pitchers
Cal Quantrill
Peyton Gray
Tyler Alexander
Jakob Junis
Jacob Latz
Catchers
Austin Wynns
Infielders
Ezequiel Duran
Jake Burger
Nicky Lopez
Josh Smith
Outfielders
Wyatt Langford
Brandon Nimmo
Evan Carter
Designated Hitters
Joc Pederson
Pitchers
Griffin Jax
Steven Matz
Craig Kimbrel
Kevin Kelly
Catchers
Hunter Feduccia
Nick Fortes
Infielders
Jonathan Aranda
Junior Caminero
Ryan Vilade
Richie Palacios
Taylor Walls
Ben Williamson
Outfielders
Cedric Mullins
Chandler Simpson
Victor Mesa Jr.
Jonny DeLuca
Designated Hitters
Yandy Diaz
Rangers
VS
Rays
Batting
131
Team Games Played
130
4343
At Bats
4368
1047
Hits
1138
502
Runs Batted In
558
143
Home Runs
135
63
Stolen Bases
128
.241
Batting Average
.261
521
Runs
587
185
Doubles
183
21
Triples
20
1703
Total Bases
1766
416
Walks
421
1118
Strikeouts
916
.314
On Base Percentage
.330
.392
Slugging Percentage
.404
.706
OBP Pct + SLG Pct
.734
131
Games Played
130
0
Games Started
0
59
Hit By Pitch
47
0.0
Wins Above Replacement
0.0
0.0
Offensive Wins Above Replacement
0.0
18
Caught Stealing
44
1
Is Qualified
1
539.1
Runs Created
591.2
4.2
Runs Created Per 27 Outs
4.6
.085
Walks Per Plate Appearance
.086
0.37
Walk To Strikeout Ratio
0.46
.151
Isolated Power
.144
.257
Secondary Average
.259
3.86
Pitches Per Plate Appearance
3.78
349
Extra Base Hits
338
4871
Plate Appearances
4910
30.4
At Bats Per Home Run
32.4
25
Sacrifice Hit
36
27
Sacrifice Flies
35
Pitching
131
Team Games Played
130
42
Quality Starts
40
65
Wins
77
66
Losses
53
37
Saves
51
66
Holds
99
1093
Hits
1016
535
Earned runs
494
156
Home Runs
167
387
Walks
329
1104
Strikeouts
1061
8.7
Strikeouts Per 9 Innings
8.2
0.0
Pitches Per Start
0.0
1.29
Walks Plus Hits Per Inning Pitched
1.16
4.19
Earned Run Average
3.83
66
Losses
53
1148.1
Innings pitched
1160.0
.496
Win Percentage
.592
53
Save Opportunities
66
.247
Opponent Batting Average
.233
.314
Opponent's On-base pct.
.292
.410
Opponent's Slugging pct.
.400
.723
Opponent's OPB Pct + SLG Pct
.691
4421
At Bats
4361
209
Doubles
200
21
Triples
13
52
Batters Hit
48
81
Stolen Bases
109
131
Games Played
130
0
Complete Games
1
0
Shutouts
0
41
Wild Pitches
35
0
Runs Batted In
0
1
Balks
3
1148.1
Innings pitched
1160.0
8.7
Strikeouts Per 9 Innings
8.2
23
Caught Stealing
29
131
Games Started
130
0.0
Wins Above Replacement
0.0
1
Is Qualified
1
567
Runs
543
532
Earned Runs
493
1812
Total Bases
1743
Fielding
131
Team Games Played
130
1148
Full Innings
1160
4505
Total Chances
4582
3445
Putouts
3480
1007
Assists
1024
53
Errors
78
185
Double Plays
183
0.988
Fielding Percentage
0.983
34.9
Range Factor
34.9
0.0
Zone Rating
0.0
131
Games Played
130
0
Games Started
0
0.0
Defensive Wins Above Replacement
0.0
1
Qualified
1