

Rangers vs Rays Live Score (30 Jul, 2026)
Game Information
Stage
Standard
Season
2026
First Pitch
Thu, Jul 30, 12:10 pm
Venue
Tropicana Field
Location
St. Petersburg, Florida
Attendance
15,322
Live Situation
0Balls
3Strikes
0Outs
—Pitcher
—At Bat
Pitch Sequence
1
STRIKE FOUL
Four-seam FB
93 MPH
2
STRIKE FOUL
Changeup
83 MPH
3
STRIKE FOUL
Four-seam FB
95 MPH
4
STRIKE SWINGING
Four-seam FB
95 MPH
Injury Report






Team Stats
 TEX
TB


2
Runs
3
2
Hits
9
0
Errors
1
0
Home Runs
2
7
Walks
2
13
Strikeouts
5
Player Box Score
Texas Rangers
| Player | H-AB | AB | R | H | RBI | HR | BB | K | #P | AVG | OBP | SLG |
|---|---|---|---|---|---|---|---|---|---|---|---|---|
 Wyatt Langford | 1-4 | 4 | 0 | 1 | 1 | 0 | 1 | 1 | 23 | .277 | .321 | .506 |
 Ezequiel Duran | 0-3 | 3 | 1 | 0 | 0 | 0 | 1 | 2 | 19 | .269 | .324 | .447 |
 Brandon Nimmo | 0-2 | 2 | 0 | 0 | 0 | 0 | 2 | 0 | 21 | .266 | .334 | .429 |
 Jake Burger | 0-4 | 4 | 0 | 0 | 0 | 0 | 0 | 3 | 16 | .236 | .296 | .425 |
 Justin Foscue | 0-1 | 1 | 0 | 0 | 0 | 0 | 0 | 1 | 4 | .262 | .324 | .484 |
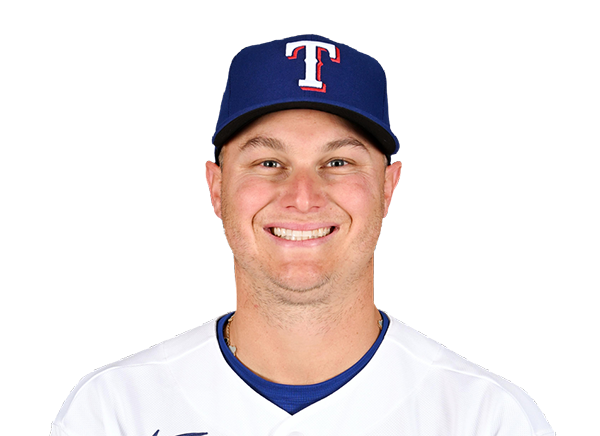 Joc Pederson | 0-1 | 1 | 0 | 0 | 1 | 0 | 0 | 0 | 3 | .252 | .338 | .503 |
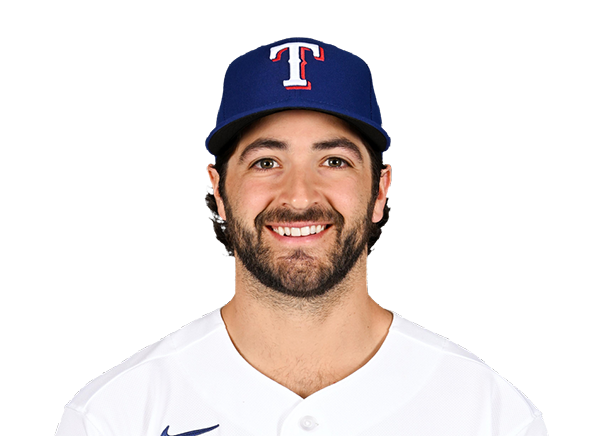 Josh Smith | 0-1 | 1 | 0 | 0 | 0 | 0 | 1 | 0 | 9 | .213 | .299 | .272 |
 Cam Cauley | 0-4 | 4 | 0 | 0 | 0 | 0 | 0 | 2 | 19 | .233 | .313 | .419 |
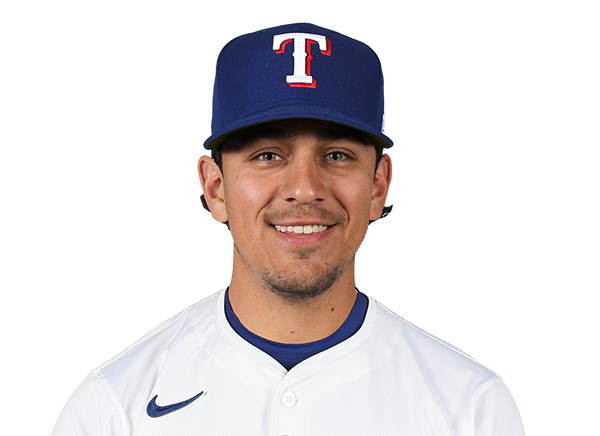 Nicky Lopez | 0-3 | 3 | 0 | 0 | 0 | 0 | 1 | 0 | 17 | .307 | .352 | .347 |
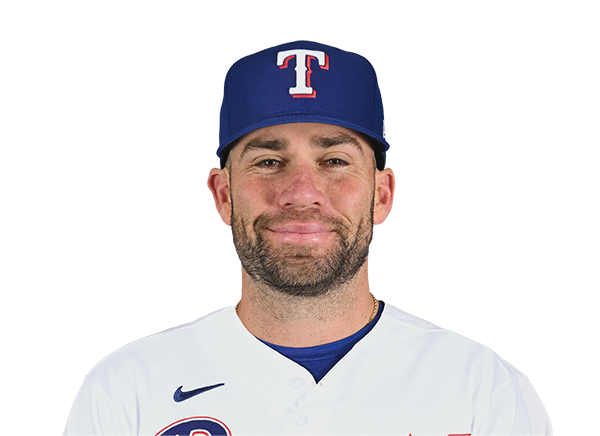 Austin Wynns | 0-3 | 3 | 0 | 0 | 0 | 0 | 0 | 3 | 13 | .182 | .250 | .455 |
 Evan Carter | 0-1 | 1 | 0 | 0 | 0 | 0 | 0 | 0 | 4 | .202 | .318 | .349 |
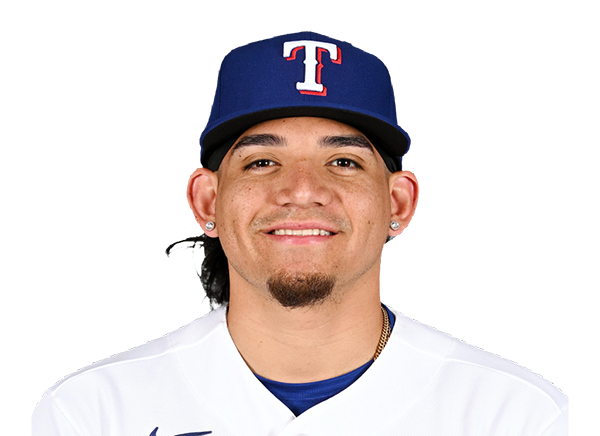 Alejandro Osuna | 1-3 | 3 | 1 | 1 | 0 | 0 | 1 | 1 | 18 | .258 | .349 | .301 |
Tampa Bay Rays
| Player | H-AB | AB | R | H | RBI | HR | BB | K | #P | AVG | OBP | SLG |
|---|---|---|---|---|---|---|---|---|---|---|---|---|
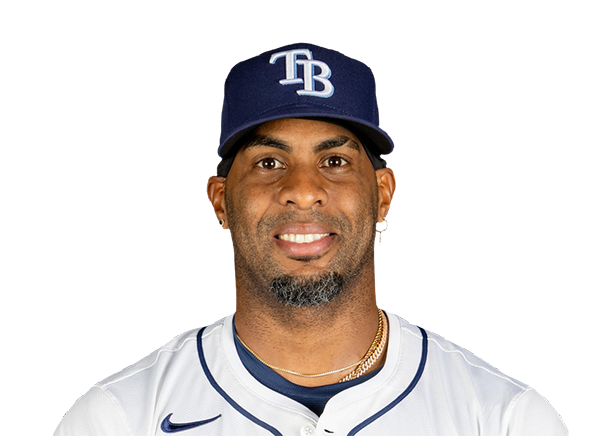 Yandy Diaz | 2-4 | 4 | 0 | 2 | 1 | 0 | 0 | 1 | 21 | .303 | .379 | .464 |
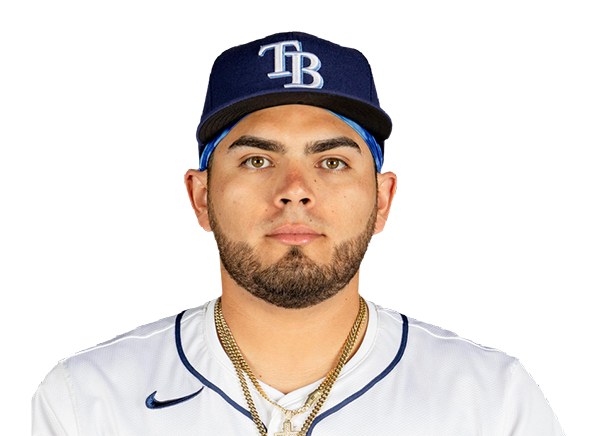 Jonathan Aranda | 1-4 | 4 | 0 | 1 | 0 | 0 | 0 | 1 | 19 | .284 | .376 | .437 |
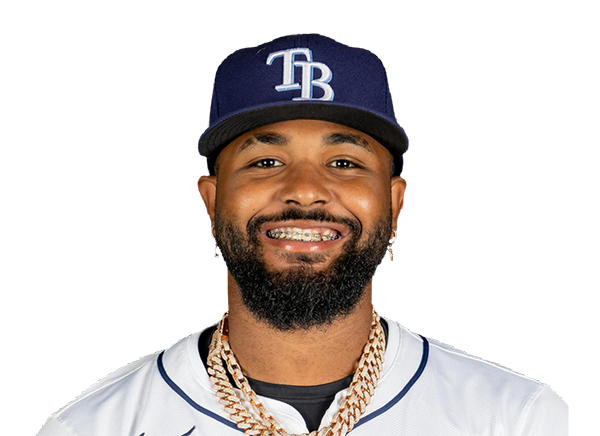 Junior Caminero | 0-3 | 3 | 0 | 0 | 0 | 0 | 1 | 0 | 11 | .280 | .369 | .541 |
 Cedric Mullins | 1-4 | 4 | 1 | 1 | 1 | 1 | 0 | 0 | 16 | .202 | .279 | .356 |
 Jonny DeLuca | 2-4 | 4 | 1 | 2 | 1 | 1 | 0 | 0 | 16 | .262 | .297 | .441 |
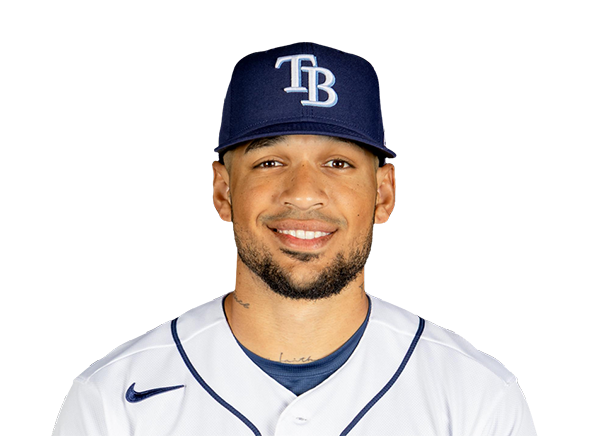 Victor Mesa Jr. | 1-4 | 4 | 0 | 1 | 0 | 0 | 0 | 2 | 14 | .224 | .311 | .448 |
 Ben Williamson | 1-3 | 3 | 0 | 1 | 0 | 0 | 0 | 0 | 9 | .251 | .315 | .328 |
 Taylor Walls | 0-2 | 2 | 0 | 0 | 0 | 0 | 1 | 0 | 11 | .217 | .308 | .287 |
 Hunter Feduccia | 1-3 | 3 | 1 | 1 | 0 | 0 | 0 | 1 | 19 | .232 | .305 | .341 |
Texas Rangers
| Player | IP | H | R | ER | BB | K | HR | PC-ST | ERA | PC |
|---|---|---|---|---|---|---|---|---|---|---|
 Cole Winn | 1.0 | 1 | 0 | 0 | 0 | 0 | 0 | 12-10 | 5.94 | 12 |
 Marco Gonzales | 3.0 | 5 | 1 | 1 | 2 | 1 | 0 | 68-42 | 1.50 | 68 |
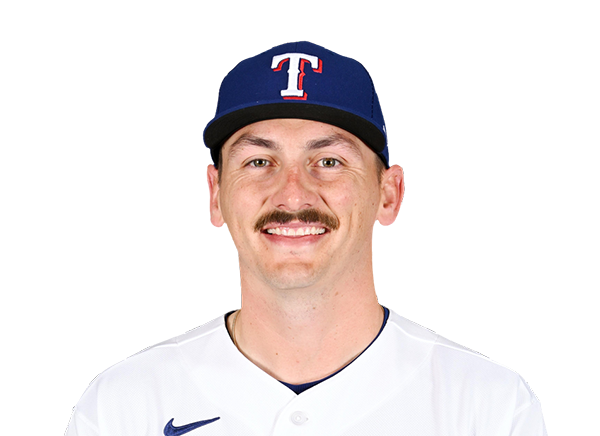 Peyton Gray | 2.0 | 1 | 1 | 1 | 0 | 2 | 1 | 28-21 | 3.48 | 28 |
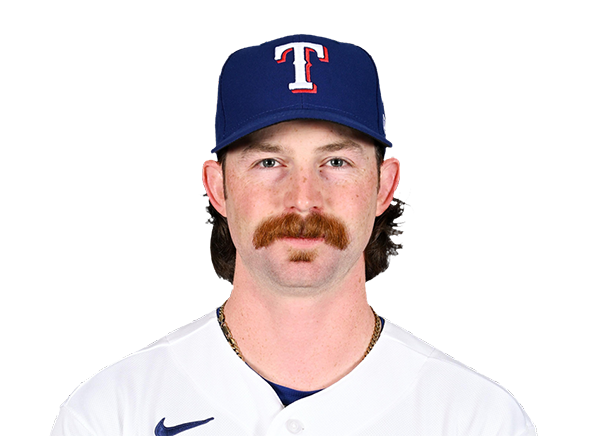 Robby Ahlstrom | 1.1 | 0 | 0 | 0 | 0 | 1 | 0 | 15-11 | 4.71 | 15 |
 Ben Peoples | 0.2 | 2 | 1 | 1 | 0 | 1 | 1 | 13-11 | 2.70 | 13 |
Tampa Bay Rays
| Player | IP | H | R | ER | BB | K | HR | PC-ST | ERA | PC |
|---|---|---|---|---|---|---|---|---|---|---|
 Shane McClanahan | 3.0 | 0 | 1 | 1 | 2 | 3 | 0 | 49-29 | 3.09 | 49 |
 Casey Legumina | 0.2 | 0 | 0 | 0 | 0 | 1 | 0 | 9-7 | 3.74 | 9 |
 Cam Booser | 0.2 | 1 | 1 | 1 | 0 | 1 | 0 | 11-9 | 2.11 | 11 |
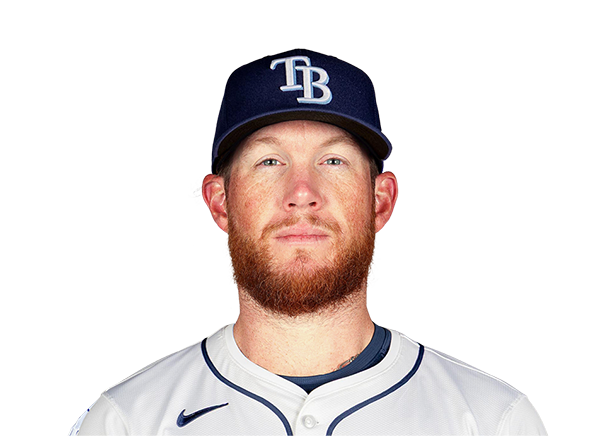 Craig Kimbrel | 0.2 | 1 | 0 | 0 | 1 | 1 | 0 | 14-8 | 4.41 | 14 |
 Steven Matz | 2.0 | 0 | 0 | 0 | 1 | 3 | 0 | 33-19 | 6.07 | 33 |
 Garrett Cleavinger | 1.0 | 0 | 0 | 0 | 1 | 2 | 0 | 20-9 | 3.31 | 20 |
 Bryan Baker | 1.0 | 0 | 0 | 0 | 2 | 2 | 0 | 30-18 | 1.49 | 30 |
H2H / Season Series
TB3–2
TEX
TB3–0
TEX
TB1–4
TEX
Last 5 Games
| Date | Opponent | Result |
|---|---|---|
| Aug 21 |  vs LAA | W2–1 |
| Aug 20 |  vs WSH | W2–0 |
| Aug 19 | vs WSH | L0–6 |
| Aug 18 | vs WSH | W5–0 |
| Aug 16 |  @ ATH | L2–5 |
| Date | Opponent | Result |
|---|---|---|
| Aug 21 |  @ BAL | L3–5 |
| Aug 20 |  vs TOR | L1–5 |
| Aug 19 | vs TOR | W7–6 |
| Aug 18 | vs TOR | L5–10 |
| Aug 17 | vs BAL | W7–6 |
Standings
American League
| Team | W | L | PCT | GB | DIFF | STRK |
|---|---|---|---|---|---|---|
| 1Rays | 76 | 52 | .594 | - | +43 | L2 |
2 White Sox | 67 | 61 | .523 | 9 | +47 | W1 |
3 Astros | 65 | 64 | .504 | 11.5 | -42 | W1 |
4 Yankees | 73 | 56 | .566 | 3.5 | +95 | L1 |
5 Red Sox | 69 | 59 | .539 | 7 | +97 | W1 |
| 6Rangers | 64 | 65 | .496 | 12.5 | -45 | W2 |
| 7Blue Jays | 64 | 67 | .489 | 13.5 | -50 | W1 |
8 Twins | 63 | 66 | .488 | 13.5 | -45 | L1 |
9 Guardians | 63 | 66 | .488 | 13.5 | -15 | W2 |
| 10Orioles | 62 | 67 | .481 | 14.5 | -34 | W1 |
11 Tigers | 61 | 67 | .477 | 15 | +79 | L3 |
12 Mariners | 61 | 68 | .473 | 15.5 | -45 | W1 |
13 Royals | 56 | 74 | .431 | 21 | -97 | W6 |
| 14Angels | 51 | 78 | .395 | 25.5 | -71 | L1 |
| 15Athletics | 49 | 80 | .380 | 27.5 | -189 | L5 |
National League
| Team | W | L | PCT | GB | DIFF | STRK |
|---|---|---|---|---|---|---|
1 Brewers | 81 | 49 | .623 | - | +163 | W3 |
2 Dodgers | 78 | 51 | .605 | 2.5 | +146 | W4 |
3 Braves | 75 | 55 | .577 | 6 | +108 | L2 |
4 Cubs | 74 | 55 | .574 | 6.5 | +99 | L2 |
5 Phillies | 72 | 58 | .554 | 9 | +25 | W8 |
6 Padres | 69 | 60 | .535 | 11.5 | +7 | W1 |
7 Diamondbacks | 68 | 61 | .527 | 12.5 | +13 | W2 |
8 Marlins | 66 | 64 | .508 | 15 | +17 | W2 |
9 Cardinals | 66 | 65 | .504 | 15.5 | 0 | L2 |
10 Pirates | 63 | 67 | .485 | 18 | +30 | L1 |
11 Reds | 61 | 68 | .473 | 19.5 | -98 | L2 |
| 12Nationals | 61 | 70 | .466 | 20.5 | +14 | L3 |
13 Mets | 58 | 71 | .450 | 22.5 | -44 | L1 |
14 Giants | 52 | 76 | .406 | 28 | -78 | L2 |
15 Rockies | 50 | 78 | .391 | 30 | -130 | L4 |
TEX
VS
TB
Pitchers
Cole Winn
Marco Gonzales
Peyton Gray
Robby Ahlstrom
Ben Peoples
Catchers
Austin Wynns
Infielders
Ezequiel Duran
Jake Burger
Justin Foscue
Josh Smith
Nicky Lopez
Outfielders
Wyatt Langford
Cam Cauley
Alejandro Osuna
Designated Hitters
Brandon Nimmo
Other Players
Joc Pederson
Evan Carter
Pitchers
Shane McClanahan
Casey Legumina
Cam Booser
Craig Kimbrel
Steven Matz
Garrett Cleavinger
Bryan Baker
Catchers
Hunter Feduccia
Infielders
Jonathan Aranda
Junior Caminero
Ben Williamson
Taylor Walls
Outfielders
Cedric Mullins
Jonny DeLuca
Victor Mesa Jr.
Designated Hitters
Yandy Diaz
Rangers
VS
Rays
Batting
129
Team Games Played
128
4288
At Bats
4303
1038
Hits
1123
497
Runs Batted In
554
141
Home Runs
134
62
Stolen Bases
128
.242
Batting Average
.261
516
Runs
582
184
Doubles
181
20
Triples
20
1685
Total Bases
1746
411
Walks
413
1105
Strikeouts
909
.315
On Base Percentage
.330
.393
Slugging Percentage
.406
.708
OBP Pct + SLG Pct
.736
129
Games Played
128
129
Games Started
128
56
Hit By Pitch
47
0.0
Wins Above Replacement
0.0
0.0
Offensive Wins Above Replacement
0.0
17
Caught Stealing
41
1
Is Qualified
1
534.7
Runs Created
586.5
4.2
Runs Created Per 27 Outs
4.7
.086
Walks Per Plate Appearance
.085
0.37
Walk To Strikeout Ratio
0.45
.151
Isolated Power
.145
.257
Secondary Average
.261
3.86
Pitches Per Plate Appearance
3.78
345
Extra Base Hits
335
4806
Plate Appearances
4837
30.4
At Bats Per Home Run
32.1
25
Sacrifice Hit
36
25
Sacrifice Flies
35
Pitching
129
Team Games Played
128
41
Quality Starts
39
64
Wins
76
65
Losses
52
36
Saves
50
65
Holds
96
1072
Hits
1006
529
Earned runs
491
155
Home Runs
165
385
Walks
328
1086
Strikeouts
1047
8.6
Strikeouts Per 9 Innings
8.3
144.5
Pitches Per Start
139.8
1.29
Walks Plus Hits Per Inning Pitched
1.17
4.21
Earned Run Average
3.87
65
Losses
52
1130.1
Innings pitched
1142.0
.496
Win Percentage
.594
52
Save Opportunities
64
.247
Opponent Batting Average
.234
.314
Opponent's On-base pct.
.293
.409
Opponent's Slugging pct.
.401
.722
Opponent's OPB Pct + SLG Pct
.695
4348
At Bats
4296
200
Doubles
197
20
Triples
13
52
Batters Hit
48
79
Stolen Bases
109
129
Games Played
128
0
Complete Games
1
12
Shutouts
11
41
Wild Pitches
35
543
Runs Batted In
515
1
Balks
2
1130.1
Innings pitched
1142.0
8.6
Strikeouts Per 9 Innings
8.3
23
Caught Stealing
29
129
Games Started
128
0.0
Wins Above Replacement
0.0
1
Is Qualified
1
561
Runs
539
529
Earned Runs
491
1777
Total Bases
1724
Fielding
129
Team Games Played
128
1130
Full Innings
1142
4432
Total Chances
4513
3391
Putouts
3426
988
Assists
1010
53
Errors
77
184
Double Plays
181
0.988
Fielding Percentage
0.983
34.9
Range Factor
35.0
0.0
Zone Rating
0.0
129
Games Played
128
0
Games Started
0
0.0
Defensive Wins Above Replacement
0.0
1
Qualified
1