

Rangers vs Twins Live Score (26 Sep, 2026)
Game Information
Stage
STD
Season
2026
First Pitch
Fri, Sep 25, 8:10 pm
Venue
Target Field
Location
Minneapolis, Minnesota
Venue Type
Outdoor
Broadcast
MLB.TV
Attendance
25,768
Live Situation
0Balls
0Strikes
0Outs
—Pitcher
—At Bat
Pitch Sequence
1
BALL IN PLAY
Sweeper
78 MPH
Injury Report




Team Stats
 TEX
MIN


2
Runs
10
6
Hits
11
0
Errors
0
0
Home Runs
1
2
Walks
3
10
Strikeouts
9
Player Box Score
Texas Rangers
| Player | H-AB | AB | R | H | RBI | HR | BB | K | #P | AVG | OBP | SLG |
|---|---|---|---|---|---|---|---|---|---|---|---|---|
 Brandon Nimmo | 1-4 | 4 | 1 | 1 | 0 | 0 | 0 | 3 | 20 | .260 | .325 | .406 |
 Josh Jung | 0-0 | 0 | 1 | 0 | 0 | 0 | 0 | 0 | 8 | .299 | .365 | .462 |
 Alejandro Osuna | 0-1 | 1 | 0 | 0 | 0 | 0 | 0 | 1 | 5 | .256 | .348 | .296 |
 Justin Foscue | 1-1 | 1 | 0 | 1 | 0 | 0 | 0 | 0 | 3 | .274 | .335 | .489 |
 Corey Seager | 1-4 | 4 | 0 | 1 | 1 | 0 | 0 | 1 | 16 | .227 | .314 | .421 |
 Wyatt Langford | 0-3 | 3 | 0 | 0 | 1 | 0 | 1 | 1 | 17 | .239 | .335 | .425 |
 Ezequiel Duran | 1-4 | 4 | 0 | 1 | 0 | 0 | 0 | 1 | 9 | .259 | .320 | .421 |
 Nicky Lopez | 0-3 | 3 | 0 | 0 | 0 | 0 | 0 | 1 | 15 | .266 | .319 | .305 |
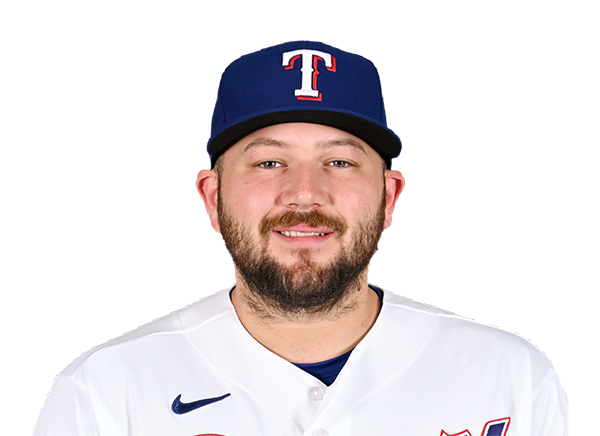 Jake Burger | 1-3 | 3 | 0 | 1 | 0 | 0 | 1 | 0 | 18 | .230 | .304 | .420 |
 Evan Carter | 0-3 | 3 | 0 | 0 | 0 | 0 | 0 | 2 | 12 | .192 | .286 | .311 |
 Cody Freeman | 0-1 | 1 | 0 | 0 | 0 | 0 | 0 | 0 | 2 | .253 | .319 | .325 |
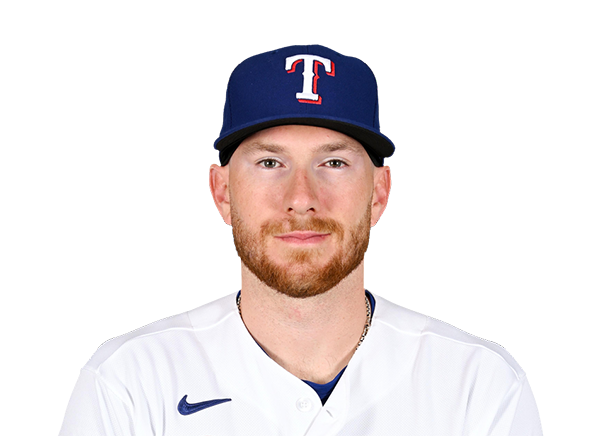 Danny Jansen | 1-4 | 4 | 0 | 1 | 0 | 0 | 0 | 0 | 16 | .195 | .292 | .347 |
Minnesota Twins
| Player | H-AB | AB | R | H | RBI | HR | BB | K | #P | AVG | OBP | SLG |
|---|---|---|---|---|---|---|---|---|---|---|---|---|
 Luke Keaschall | 4-5 | 5 | 3 | 4 | 3 | 0 | 0 | 0 | 16 | .281 | .369 | .402 |
 Brooks Lee | 0-5 | 5 | 0 | 0 | 0 | 0 | 0 | 1 | 19 | .253 | .301 | .429 |
 Ben Ross | 0-0 | 0 | 0 | 0 | 0 | 0 | 0 | 0 | 0 | .190 | .190 | .381 |
 Kody Clemens | 3-4 | 4 | 1 | 3 | 3 | 1 | 0 | 0 | 12 | .239 | .299 | .463 |
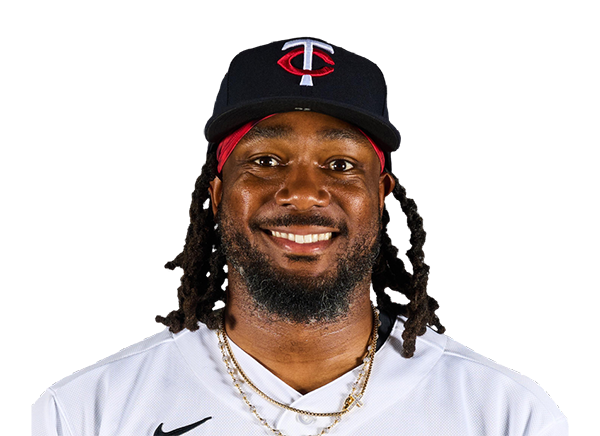 Josh Bell | 0-2 | 2 | 1 | 0 | 0 | 0 | 2 | 0 | 26 | .254 | .318 | .415 |
 Ryan Jeffers | 1-4 | 4 | 1 | 1 | 0 | 0 | 0 | 1 | 16 | .252 | .349 | .455 |
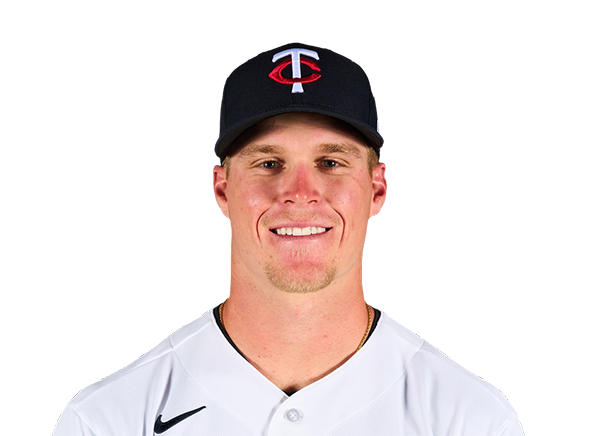 Walker Jenkins | 1-4 | 4 | 1 | 1 | 0 | 0 | 0 | 1 | 12 | .224 | .298 | .408 |
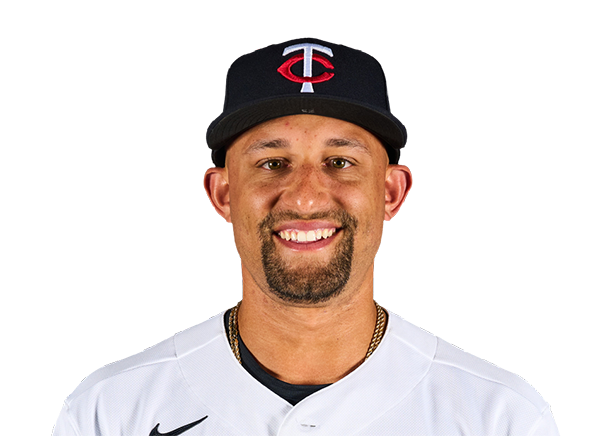 Royce Lewis | 1-4 | 4 | 1 | 1 | 2 | 0 | 0 | 2 | 16 | .226 | .287 | .376 |
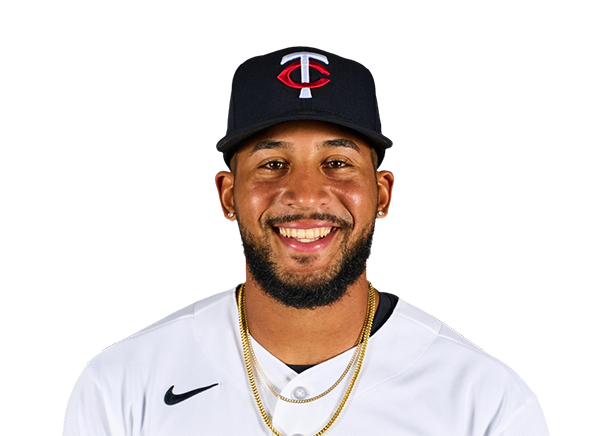 Emmanuel Rodriguez | 0-4 | 4 | 0 | 0 | 0 | 0 | 0 | 2 | 13 | .178 | .229 | .400 |
 Ryan Kreidler | 1-2 | 2 | 2 | 1 | 1 | 0 | 1 | 1 | 15 | .218 | .286 | .379 |
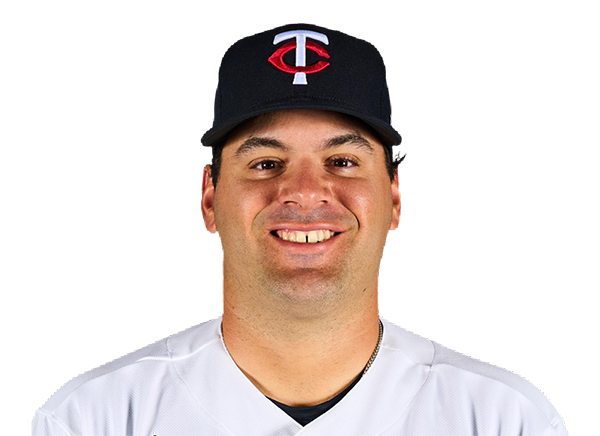 Aaron Sabato | 0-1 | 1 | 0 | 0 | 0 | 0 | 0 | 1 | 6 | .000 | .000 | .000 |
Texas Rangers
| Player | IP | H | R | ER | BB | K | HR | PC-ST | ERA | PC |
|---|---|---|---|---|---|---|---|---|---|---|
 Jacob deGrom | 4.0 | 8 | 8 | 8 | 3 | 5 | 0 | 89-58 | 4.20 | 89 |
 Gavin Collyer | 2.0 | 2 | 2 | 2 | 0 | 1 | 1 | 34-26 | 5.40 | 34 |
 Trevor Williams | 2.0 | 1 | 0 | 0 | 0 | 3 | 0 | 28-16 | 3.14 | 28 |
Minnesota Twins
| Player | IP | H | R | ER | BB | K | HR | PC-ST | ERA | PC |
|---|---|---|---|---|---|---|---|---|---|---|
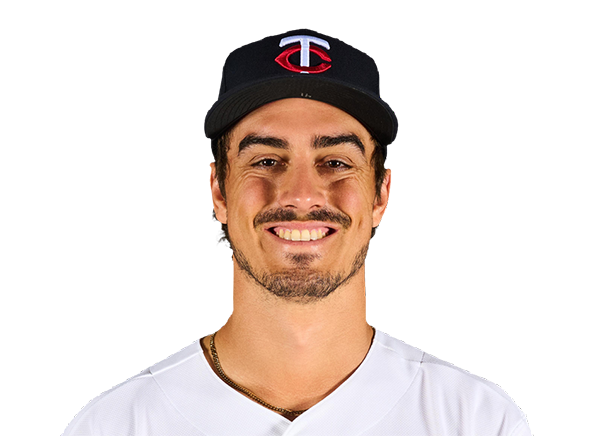 Joe Ryan | 6.0 | 4 | 2 | 2 | 1 | 8 | 0 | 103-68 | 3.79 | 103 |
 Kody Funderburk | 1.0 | 1 | 0 | 0 | 0 | 2 | 0 | 19-9 | 3.71 | 19 |
 Tommy Nance | 1.0 | 0 | 0 | 0 | 1 | 0 | 0 | 11-6 | 3.92 | 11 |
 Taylor Rogers | 1.0 | 1 | 0 | 0 | 0 | 0 | 0 | 8-6 | 4.40 | 8 |
H2H / Season Series
MIN10–2
TEX
TEX3–9
MIN
TEX2–12
MIN
TEX2–4
MIN
Last 5 Games
| Date | Opponent | Result |
|---|---|---|
| Sep 25 | @ MIN | L2–10 |
| Sep 24 |  vs NYM | W3–1 |
| Sep 23 | vs NYM | L2–7 |
| Sep 22 | vs NYM | L3–6 |
| Sep 20 |  vs TOR | L2–7 |
| Date | Opponent | Result |
|---|---|---|
| Sep 25 | vs TEX | W10–2 |
| Sep 23 |  @ SF | W4–2 |
| Sep 22 | @ SF | W3–2 |
| Sep 21 | @ SF | L2–5 |
| Sep 20 |  @ LAA | W8–0 |
Standings
American League
| Team | W | L | PCT | GB | DIFF | STRK |
|---|---|---|---|---|---|---|
1 Rays | 97 | 63 | .606 | - | +79 | W1 |
2 Guardians | 84 | 76 | .525 | 13 | +6 | W2 |
3 Astros | 79 | 81 | .494 | 18 | -52 | L1 |
4 Yankees | 93 | 68 | .578 | 4.5 | +138 | W1 |
5 Red Sox | 87 | 74 | .540 | 10.5 | +82 | W2 |
6 White Sox | 83 | 77 | .519 | 14 | +57 | W2 |
| 7Rangers | 79 | 81 | .494 | 18 | -48 | L1 |
8 Orioles | 79 | 82 | .491 | 18.5 | -21 | L1 |
| 9Blue Jays | 78 | 82 | .488 | 19 | -46 | W1 |
| 10Twins | 76 | 84 | .475 | 21 | -56 | W3 |
11 Tigers | 75 | 85 | .469 | 22 | +72 | W1 |
12 Mariners | 74 | 86 | .463 | 23 | -66 | L2 |
13 Royals | 68 | 92 | .425 | 29 | -115 | L2 |
14 Athletics | 64 | 96 | .400 | 33 | -218 | W1 |
| 15Angels | 62 | 98 | .388 | 35 | -89 | W2 |
National League
| Team | W | L | PCT | GB | DIFF | STRK |
|---|---|---|---|---|---|---|
1 Brewers | 101 | 59 | .631 | - | +211 | W3 |
2 Dodgers | 98 | 62 | .613 | 3 | +196 | W1 |
3 Braves | 93 | 67 | .581 | 8 | +113 | L2 |
4 Padres | 89 | 71 | .556 | 12 | +33 | L1 |
5 Cubs | 88 | 73 | .547 | 13.5 | +143 | L2 |
6 Phillies | 87 | 73 | .544 | 14 | +22 | L3 |
7 Diamondbacks | 86 | 74 | .538 | 15 | +17 | W6 |
8 Pirates | 81 | 79 | .506 | 20 | +27 | L1 |
9 Marlins | 79 | 81 | .494 | 22 | +6 | W1 |
10 Cardinals | 77 | 83 | .481 | 24 | -26 | L2 |
11 Nationals | 76 | 84 | .475 | 25 | +10 | W3 |
12 Reds | 74 | 86 | .463 | 27 | -160 | L1 |
| 13Mets | 73 | 87 | .456 | 28 | -36 | L2 |
| 14Giants | 65 | 95 | .406 | 36 | -86 | L3 |
15 Rockies | 57 | 103 | .356 | 44 | -193 | L5 |
TEX
VS
MIN
Pitchers
Jacob deGrom
Catchers
Danny Jansen
Infielders
Corey Seager
Ezequiel Duran
Nicky Lopez
Jake Burger
Outfielders
Brandon Nimmo
Wyatt Langford
Evan Carter
Designated Hitters
Josh Jung
Pitchers
Joe Ryan
Catchers
Ryan Jeffers
Infielders
Brooks Lee
Kody Clemens
Royce Lewis
Ryan Kreidler
Outfielders
Luke Keaschall
Walker Jenkins
Emmanuel Rodriguez
Designated Hitters
Josh Bell
Rangers
VS
Twins
Batting
160
Team Games Played
160
5293
At Bats
5404
1277
Hits
1319
639
Runs Batted In
699
178
Home Runs
185
77
Stolen Bases
90
.241
Batting Average
.244
663
Runs
731
231
Doubles
251
22
Triples
25
2086
Total Bases
2175
523
Walks
500
1373
Strikeouts
1284
.317
On Base Percentage
.316
.394
Slugging Percentage
.402
.711
OBP Pct + SLG Pct
.719
160
Games Played
160
160
Games Started
160
80
Hit By Pitch
91
0.0
Wins Above Replacement
0.0
0.0
Offensive Wins Above Replacement
0.0
23
Caught Stealing
35
1
Is Qualified
1
669.7
Runs Created
695.8
4.3
Runs Created Per 27 Outs
4.4
.088
Walks Per Plate Appearance
.083
0.38
Walk To Strikeout Ratio
0.39
.153
Isolated Power
.158
.262
Secondary Average
.261
3.88
Pitches Per Plate Appearance
3.86
431
Extra Base Hits
461
5971
Plate Appearances
6053
29.7
At Bats Per Home Run
29.2
37
Sacrifice Hit
11
37
Sacrifice Flies
46
Pitching
160
Team Games Played
160
49
Quality Starts
53
79
Wins
76
81
Losses
84
43
Saves
45
83
Holds
110
1335
Hits
1349
673
Earned runs
717
188
Home Runs
181
490
Walks
579
1324
Strikeouts
1365
8.5
Strikeouts Per 9 Innings
8.7
145.0
Pitches Per Start
150.2
1.30
Walks Plus Hits Per Inning Pitched
1.36
4.32
Earned Run Average
4.55
81
Losses
84
1402.1
Innings pitched
1417.2
.494
Win Percentage
.475
63
Save Opportunities
66
.247
Opponent Batting Average
.248
.316
Opponent's On-base pct.
.326
.408
Opponent's Slugging pct.
.406
.724
Opponent's OPB Pct + SLG Pct
.733
5396
At Bats
5433
256
Doubles
278
24
Triples
19
67
Batters Hit
73
96
Stolen Bases
136
160
Games Played
160
0
Complete Games
1
13
Shutouts
5
44
Wild Pitches
44
689
Runs Batted In
753
2
Balks
6
1402.1
Innings pitched
1417.2
8.5
Strikeouts Per 9 Innings
8.7
25
Caught Stealing
21
160
Games Started
160
0.0
Wins Above Replacement
0.0
1
Is Qualified
1
711
Runs
787
673
Earned Runs
717
2203
Total Bases
2208
Fielding
160
Team Games Played
160
1402
Full Innings
1418
5529
Total Chances
5541
4207
Putouts
4253
1254
Assists
1216
68
Errors
72
231
Double Plays
251
0.988
Fielding Percentage
0.987
35.0
Range Factor
34.7
0.0
Zone Rating
0.0
160
Games Played
160
0
Games Started
0
0.0
Defensive Wins Above Replacement
0.0
1
Qualified
1