

Rays vs Braves Live Score (9 Sep, 2026)
Game Information
Stage
STD
Season
2026
First Pitch
Wed, Sep 9, 7:15 pm
Venue
Truist Park
Location
Atlanta, Georgia
Venue Type
Outdoor
Broadcast
MLB.TV
Attendance
30,969
Live Situation
0Balls
0Strikes
0Outs
—Pitcher
—At Bat
Pitch Sequence
1
BALL IN PLAY
Sinker
93 MPH
Injury Report

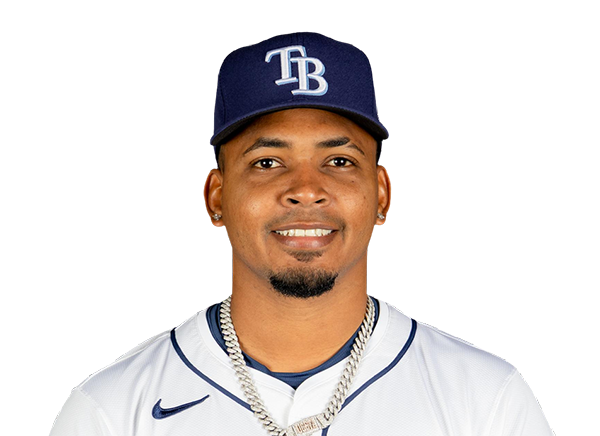



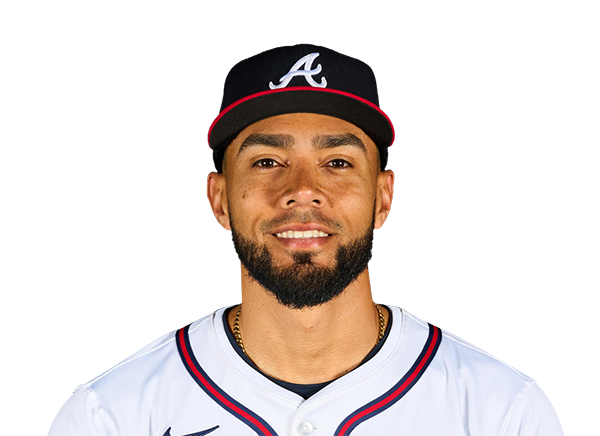
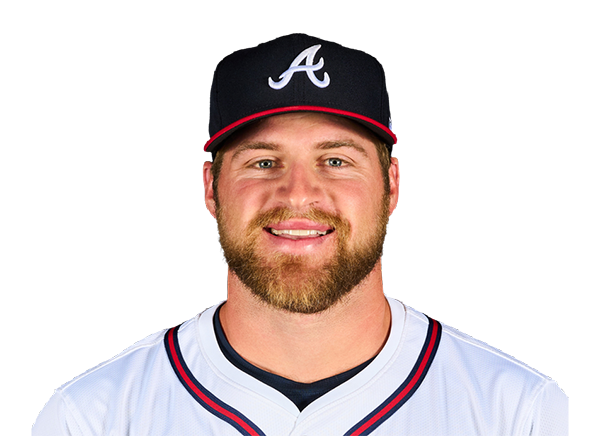
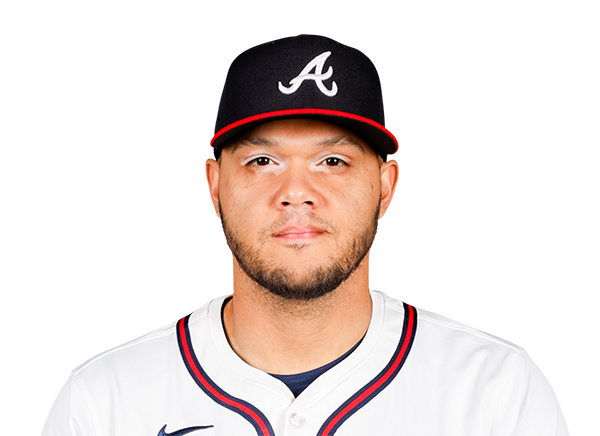
Team Stats
 TB
ATL


7
Runs
2
10
Hits
3
0
Errors
0
1
Home Runs
1
3
Walks
3
6
Strikeouts
5
Player Box Score
Tampa Bay Rays
| Player | H-AB | AB | R | H | RBI | HR | BB | K | #P | AVG | OBP | SLG |
|---|---|---|---|---|---|---|---|---|---|---|---|---|
 Yandy Diaz | 1-4 | 4 | 0 | 1 | 1 | 0 | 0 | 0 | 15 | .305 | .371 | .472 |
 Jonathan Aranda | 0-4 | 4 | 1 | 0 | 0 | 0 | 0 | 2 | 18 | .277 | .360 | .427 |
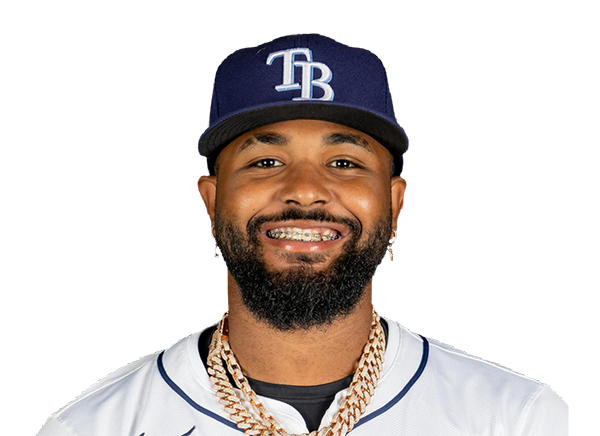 Junior Caminero | 1-5 | 5 | 0 | 1 | 0 | 0 | 0 | 1 | 19 | .281 | .367 | .533 |
 Liam Hicks | 1-4 | 4 | 0 | 1 | 1 | 0 | 0 | 1 | 13 | .288 | .371 | .444 |
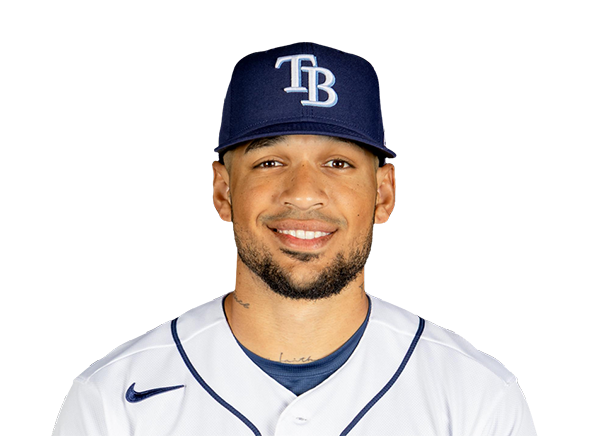 Victor Mesa Jr. | 2-3 | 3 | 2 | 2 | 1 | 1 | 1 | 0 | 15 | .238 | .303 | .455 |
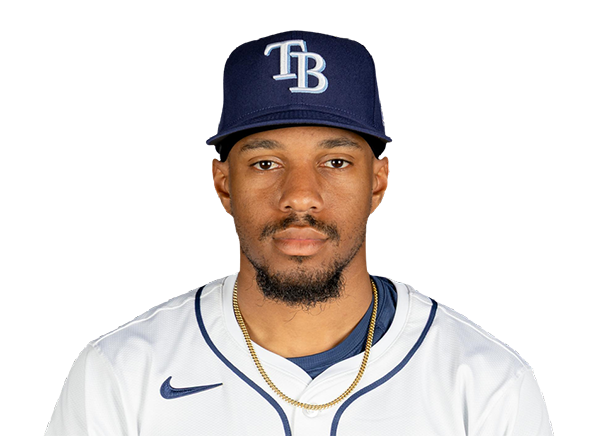 Chandler Simpson | 2-3 | 3 | 2 | 2 | 0 | 0 | 1 | 0 | 10 | .309 | .338 | .360 |
 Cedric Mullins | 1-4 | 4 | 1 | 1 | 1 | 0 | 0 | 1 | 14 | .206 | .289 | .348 |
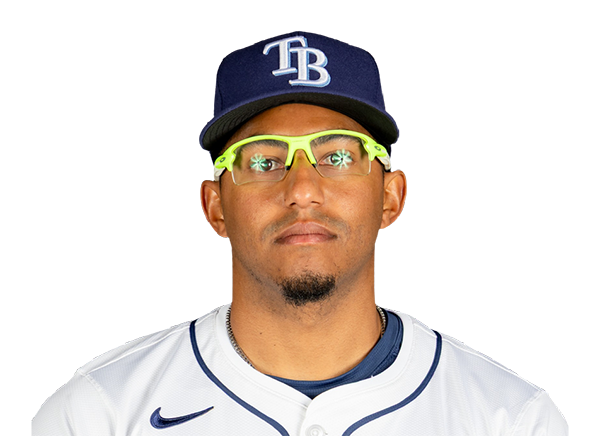 Richie Palacios | 1-3 | 3 | 1 | 1 | 1 | 0 | 1 | 0 | 12 | .228 | .324 | .367 |
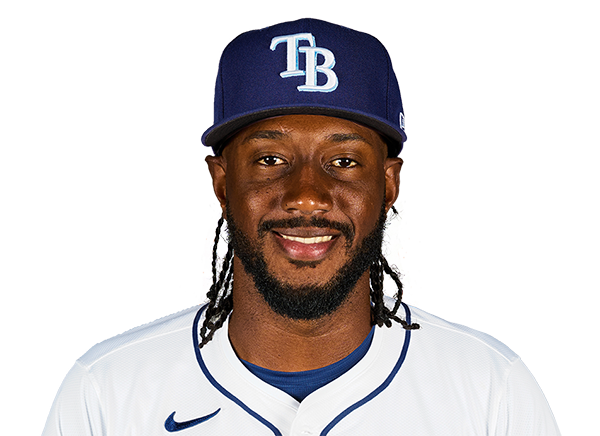 Jorge Mateo | 1-3 | 3 | 0 | 1 | 2 | 0 | 0 | 1 | 9 | .216 | .261 | .341 |
Atlanta Braves
| Player | H-AB | AB | R | H | RBI | HR | BB | K | #P | AVG | OBP | SLG |
|---|---|---|---|---|---|---|---|---|---|---|---|---|
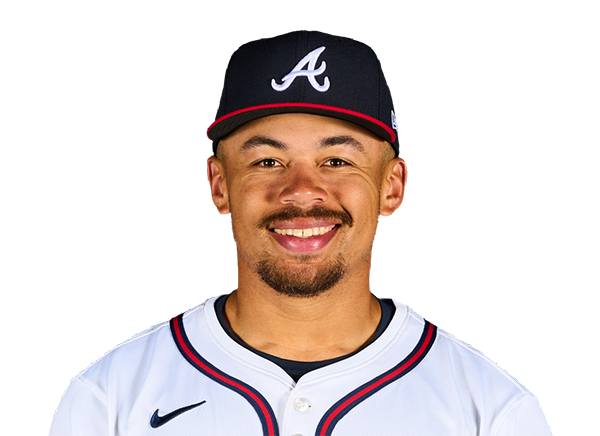 Drake Baldwin | 1-3 | 3 | 2 | 1 | 1 | 1 | 1 | 0 | 18 | .276 | .353 | .452 |
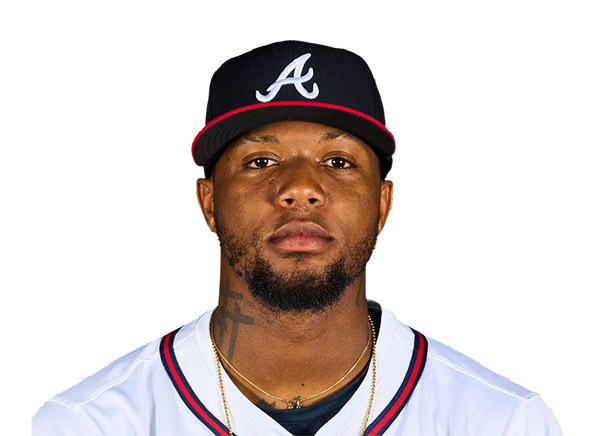 Ronald Acuna Jr. | 1-4 | 4 | 0 | 1 | 0 | 0 | 0 | 1 | 15 | .253 | .348 | .440 |
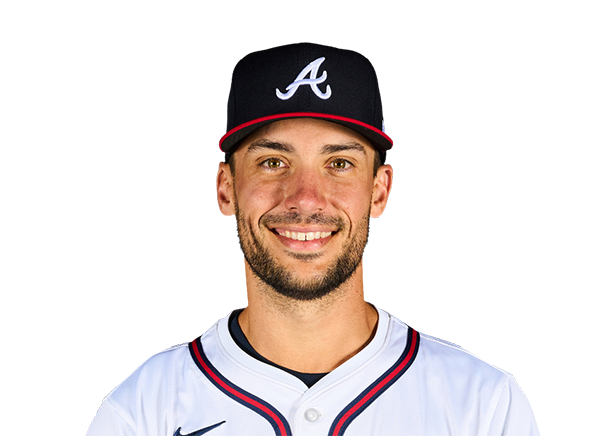 Matt Olson | 0-2 | 2 | 0 | 0 | 1 | 0 | 1 | 0 | 21 | .248 | .323 | .504 |
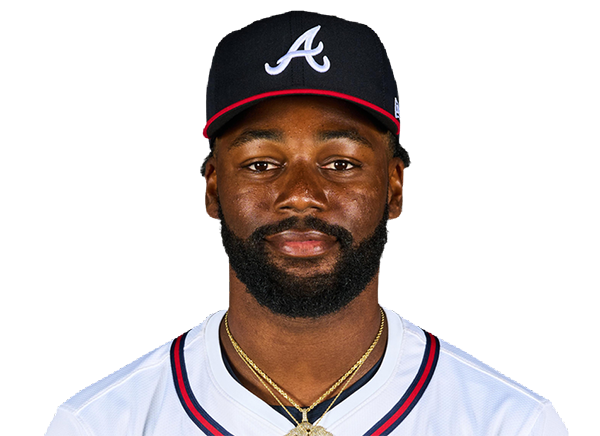 Michael Harris II | 0-3 | 3 | 0 | 0 | 0 | 0 | 1 | 1 | 15 | .287 | .315 | .488 |
 Mauricio Dubon | 1-4 | 4 | 0 | 1 | 0 | 0 | 0 | 0 | 16 | .266 | .309 | .386 |
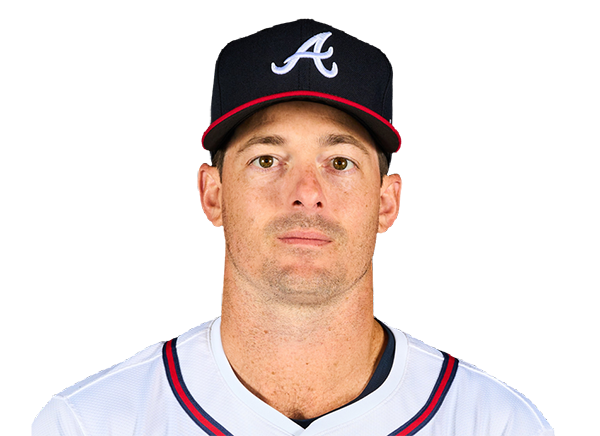 Mike Yastrzemski | 0-3 | 3 | 0 | 0 | 0 | 0 | 0 | 0 | 6 | .222 | .307 | .366 |
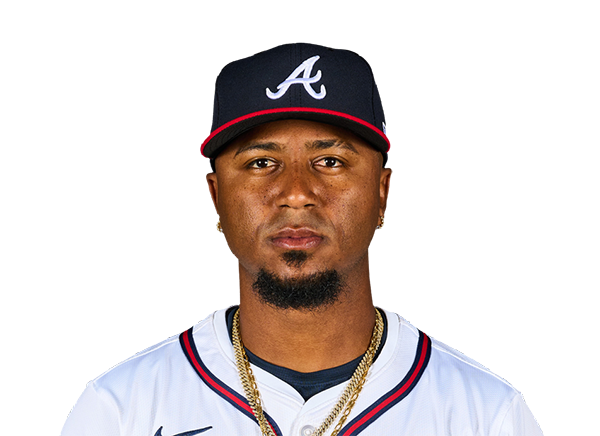 Ozzie Albies | 0-3 | 3 | 0 | 0 | 0 | 0 | 0 | 1 | 14 | .247 | .303 | .407 |
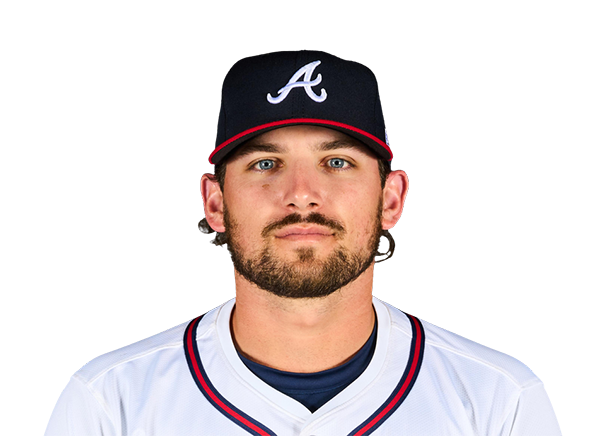 Austin Riley | 0-3 | 3 | 0 | 0 | 0 | 0 | 0 | 1 | 13 | .222 | .293 | .365 |
 Sean Murphy | 0-3 | 3 | 0 | 0 | 0 | 0 | 0 | 1 | 10 | .203 | .263 | .365 |
Tampa Bay Rays
| Player | IP | H | R | ER | BB | K | HR | PC-ST | ERA | PC |
|---|---|---|---|---|---|---|---|---|---|---|
 Griffin Jax | 5.0 | 2 | 1 | 1 | 1 | 2 | 1 | 66-45 | 3.99 | 66 |
 Ty Johnson | 0.2 | 1 | 1 | 1 | 1 | 1 | 0 | 19-10 | 5.40 | 19 |
 Cam Booser | 0.1 | 0 | 0 | 0 | 0 | 1 | 0 | 5-3 | 2.31 | 5 |
 Cole Sulser | 1.0 | 0 | 0 | 0 | 0 | 0 | 0 | 8-5 | 4.74 | 8 |
 Steven Matz | 2.0 | 0 | 0 | 0 | 1 | 1 | 0 | 30-21 | 5.72 | 30 |
Atlanta Braves
| Player | IP | H | R | ER | BB | K | HR | PC-ST | ERA | PC |
|---|---|---|---|---|---|---|---|---|---|---|
 Reynaldo Lopez | 4.2 | 7 | 6 | 6 | 3 | 5 | 1 | 80-47 | 4.13 | 80 |
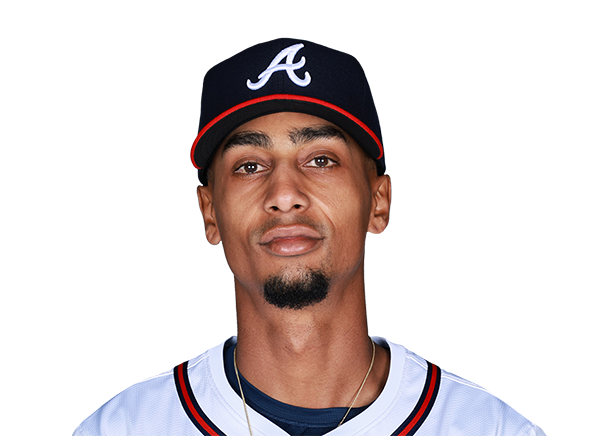 Ray Kerr | 1.1 | 1 | 0 | 0 | 0 | 0 | 0 | 9-7 | 1.59 | 9 |
 Victor Mederos | 1.0 | 2 | 1 | 1 | 0 | 0 | 0 | 19-13 | 3.03 | 19 |
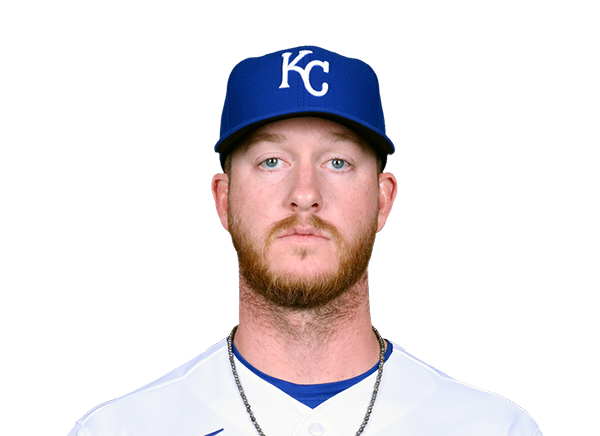 Bailey Falter | 2.0 | 0 | 0 | 0 | 0 | 1 | 0 | 17-16 | 11.57 | 17 |
H2H / Season Series
ATL2–7
TB
ATL1–7
TB
ATL3–2
TB
ATL11–2
TB
ATL5–3
TB
TB9–8
ATL
ATL5–3
TB
TB1–5
ATL
Last 5 Games
| Date | Opponent | Result |
|---|---|---|
| Sep 9 | @ ATL | W7–2 |
| Sep 8 | @ ATL | W7–1 |
| Sep 6 |  @ TEX | L6–8 |
| Sep 5 | @ TEX | W6–3 |
| Sep 4 | @ TEX | W7–6 |
| Date | Opponent | Result |
|---|---|---|
| Sep 9 | vs TB | L2–7 |
| Sep 8 | vs TB | L1–7 |
| Sep 7 |  @ PHI | L0–1 |
| Sep 6 | @ PHI | W5–4 |
| Sep 5 | @ PHI | L2–4 |
Standings
American League
| Team | W | L | PCT | GB | DIFF | STRK |
|---|---|---|---|---|---|---|
| 1Rays | 87 | 58 | .600 | - | +58 | W2 |
2 White Sox | 75 | 70 | .517 | 12 | +41 | L2 |
3 Astros | 74 | 72 | .507 | 13.5 | -41 | L1 |
4 Yankees | 83 | 62 | .572 | 4 | +124 | W2 |
5 Red Sox | 80 | 67 | .544 | 8 | +82 | L2 |
6 Guardians | 74 | 73 | .503 | 14 | -16 | L1 |
7 Blue Jays | 73 | 74 | .497 | 15 | -39 | L1 |
| 8Rangers | 72 | 74 | .493 | 15.5 | -40 | L1 |
9 Orioles | 71 | 76 | .483 | 17 | -27 | W1 |
10 Twins | 69 | 77 | .473 | 18.5 | -53 | L1 |
11 Mariners | 68 | 78 | .466 | 19.5 | -75 | W1 |
12 Tigers | 67 | 79 | .459 | 20.5 | +55 | W1 |
13 Royals | 65 | 82 | .442 | 23 | -88 | W1 |
14 Athletics | 59 | 88 | .401 | 29 | -187 | W1 |
15 Angels | 56 | 90 | .384 | 31.5 | -73 | W2 |
National League
| Team | W | L | PCT | GB | DIFF | STRK |
|---|---|---|---|---|---|---|
1 Brewers | 91 | 56 | .619 | - | +172 | W3 |
2 Dodgers | 89 | 57 | .610 | 1.5 | +169 | W7 |
| 3Braves | 85 | 61 | .582 | 5.5 | +108 | L3 |
| 4Phillies | 82 | 64 | .562 | 8.5 | +38 | W1 |
5 Cubs | 81 | 66 | .551 | 10 | +128 | L4 |
6 Padres | 78 | 68 | .534 | 12.5 | +17 | W4 |
7 Diamondbacks | 78 | 69 | .531 | 13 | -1 | L1 |
8 Pirates | 73 | 73 | .500 | 17.5 | +34 | W3 |
9 Marlins | 72 | 75 | .490 | 19 | +7 | L3 |
10 Cardinals | 72 | 75 | .490 | 19 | -12 | L3 |
11 Reds | 69 | 77 | .473 | 21.5 | -122 | L3 |
12 Mets | 68 | 78 | .466 | 22.5 | -40 | W4 |
13 Nationals | 67 | 81 | .453 | 24.5 | 0 | L7 |
14 Giants | 62 | 85 | .422 | 29 | -72 | W3 |
15 Rockies | 55 | 90 | .379 | 35 | -147 | L3 |
TB
VS
ATL
Pitchers
Griffin Jax
Catchers
Liam Hicks
Infielders
Jonathan Aranda
Junior Caminero
Richie Palacios
Jorge Mateo
Outfielders
Victor Mesa Jr.
Chandler Simpson
Cedric Mullins
Designated Hitters
Yandy Diaz
Pitchers
Reynaldo Lopez
Catchers
Sean Murphy
Infielders
Matt Olson
Mauricio Dubon
Ozzie Albies
Austin Riley
Outfielders
Ronald Acuna Jr.
Michael Harris II
Mike Yastrzemski
Designated Hitters
Drake Baldwin
Rays
VS
Braves
Batting
145
Team Games Played
146
4884
At Bats
4922
1274
Hits
1210
629
Runs Batted In
641
154
Home Runs
183
147
Stolen Bases
76
.261
Batting Average
.246
661
Runs
668
200
Doubles
232
21
Triples
10
1978
Total Bases
2011
463
Walks
419
1011
Strikeouts
1185
.329
On Base Percentage
.309
.405
Slugging Percentage
.409
.734
OBP Pct + SLG Pct
.718
145
Games Played
146
145
Games Started
146
55
Hit By Pitch
51
0.0
Wins Above Replacement
0.0
0.0
Offensive Wins Above Replacement
0.0
50
Caught Stealing
23
1
Is Qualified
1
663.4
Runs Created
633.9
4.7
Runs Created Per 27 Outs
4.4
.084
Walks Per Plate Appearance
.077
0.46
Walk To Strikeout Ratio
0.35
.144
Isolated Power
.163
.259
Secondary Average
.259
3.76
Pitches Per Plate Appearance
3.89
375
Extra Base Hits
425
5490
Plate Appearances
5445
31.7
At Bats Per Home Run
26.9
44
Sacrifice Hit
9
41
Sacrifice Flies
41
Pitching
145
Team Games Played
146
49
Quality Starts
55
87
Wins
85
58
Losses
61
55
Saves
45
108
Holds
100
1120
Hits
1126
545
Earned runs
517
182
Home Runs
162
366
Walks
489
1174
Strikeouts
1234
8.2
Strikeouts Per 9 Innings
8.6
139.6
Pitches Per Start
144.1
1.15
Walks Plus Hits Per Inning Pitched
1.25
3.79
Earned Run Average
3.59
58
Losses
61
1295.0
Innings pitched
1295.0
.600
Win Percentage
.582
72
Save Opportunities
64
.231
Opponent Batting Average
.233
.289
Opponent's On-base pct.
.308
.393
Opponent's Slugging pct.
.379
.682
Opponent's OPB Pct + SLG Pct
.687
4859
At Bats
4843
215
Doubles
184
15
Triples
20
51
Batters Hit
55
117
Stolen Bases
107
145
Games Played
146
1
Complete Games
1
12
Shutouts
10
36
Wild Pitches
29
574
Runs Batted In
539
3
Balks
4
1295.0
Innings pitched
1295.0
8.2
Strikeouts Per 9 Innings
8.6
32
Caught Stealing
19
145
Games Started
146
0.0
Wins Above Replacement
0.0
1
Is Qualified
1
603
Runs
560
545
Earned Runs
517
1911
Total Bases
1836
Fielding
145
Team Games Played
146
1295
Full Innings
1295
5118
Total Chances
5145
3885
Putouts
3885
1146
Assists
1196
87
Errors
64
200
Double Plays
232
0.983
Fielding Percentage
0.988
35.0
Range Factor
35.3
0.0
Zone Rating
0.0
145
Games Played
146
0
Games Started
0
0.0
Defensive Wins Above Replacement
0.0
1
Qualified
1