

Rays vs Phillies Live Score (26 Sep, 2026)
Game Information
Stage
STD
Season
2026
First Pitch
Sat, Sep 26, 7:15 pm
Venue
Citizens Bank Park
Location
Philadelphia, Pennsylvania
Venue Type
Outdoor
Broadcast
MLB.TV
Attendance
43,076
Live Situation
1Balls
1Strikes
0Outs
—Pitcher
—At Bat
Pitch Sequence
1
STRIKE FOUL
Four-seam FB
91 MPH
2
BALL
Changeup
84 MPH
3
BALL IN PLAY
Changeup
83 MPH
Injury Report

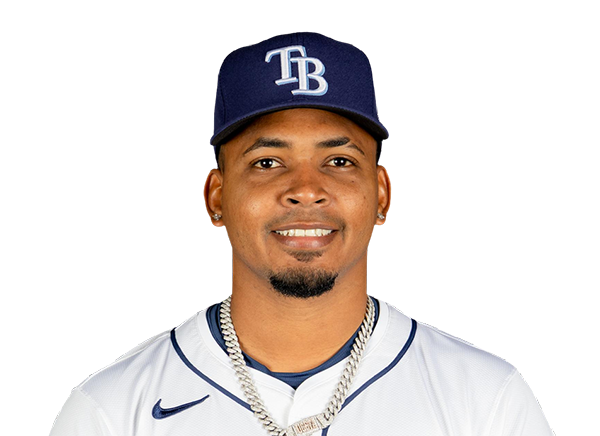

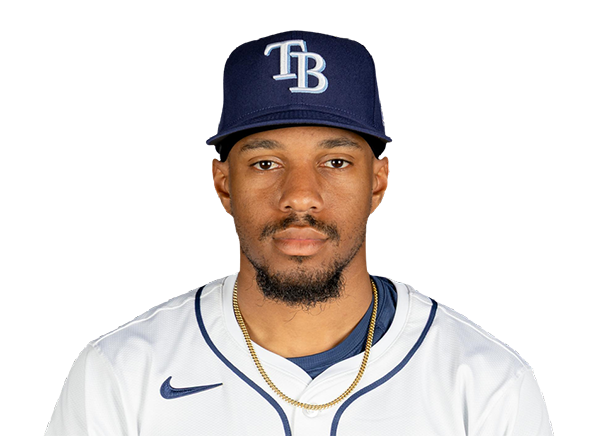
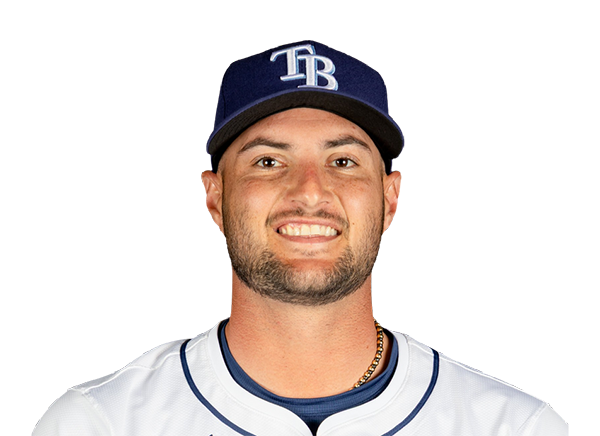


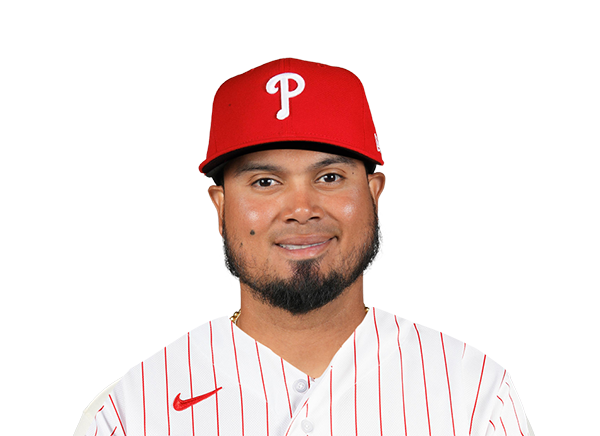


Team Stats
 TB
PHI


12
Runs
1
17
Hits
7
1
Errors
1
1
Home Runs
0
5
Walks
5
9
Strikeouts
8
Player Box Score
Tampa Bay Rays
| Player | H-AB | AB | R | H | RBI | HR | BB | K | #P | AVG | OBP | SLG |
|---|---|---|---|---|---|---|---|---|---|---|---|---|
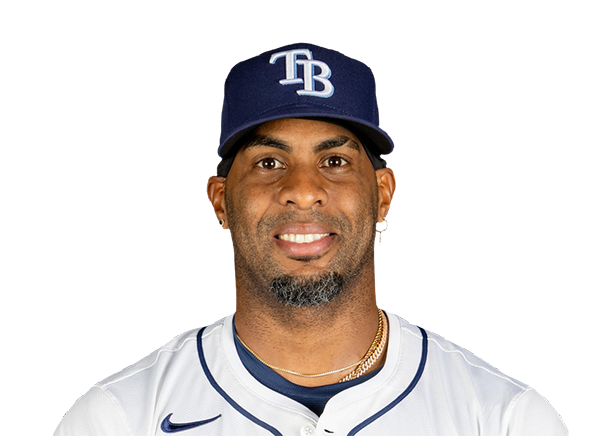 Yandy Diaz | 3-4 | 4 | 3 | 3 | 0 | 0 | 0 | 0 | 19 | .293 | .359 | .446 |
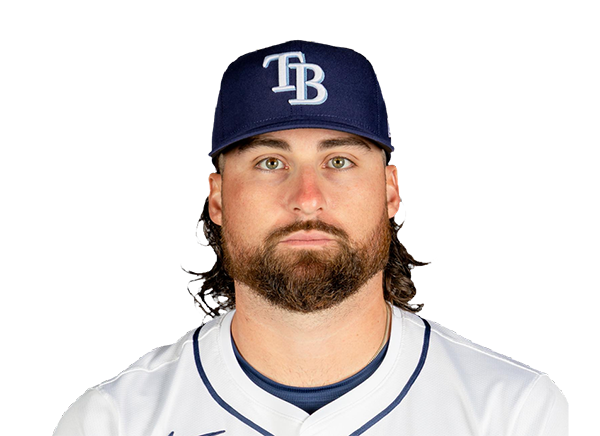 Ryan Vilade | 1-2 | 2 | 0 | 1 | 2 | 0 | 0 | 0 | 6 | .247 | .324 | .432 |
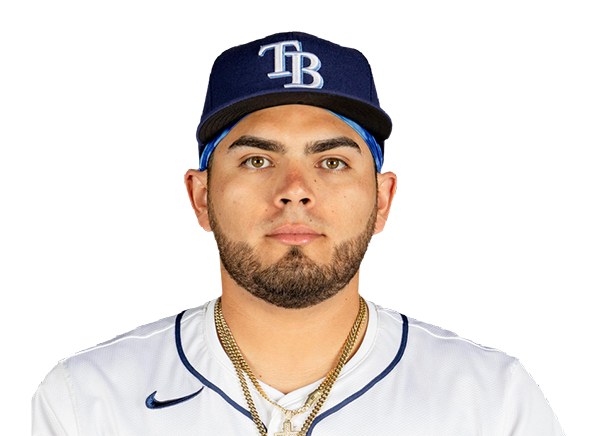 Jonathan Aranda | 0-4 | 4 | 0 | 0 | 0 | 0 | 2 | 2 | 31 | .273 | .357 | .433 |
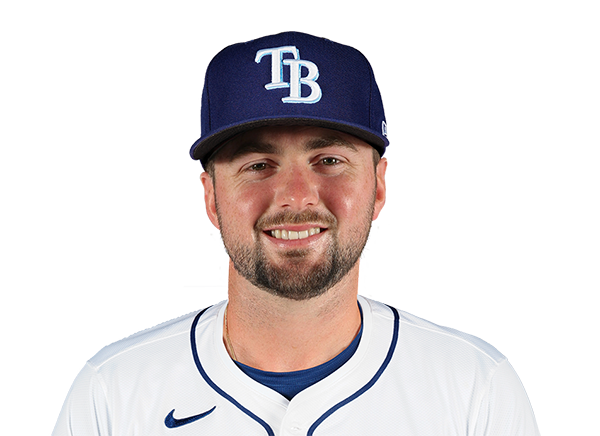 Liam Hicks | 2-6 | 6 | 1 | 2 | 0 | 0 | 0 | 0 | 22 | .282 | .366 | .429 |
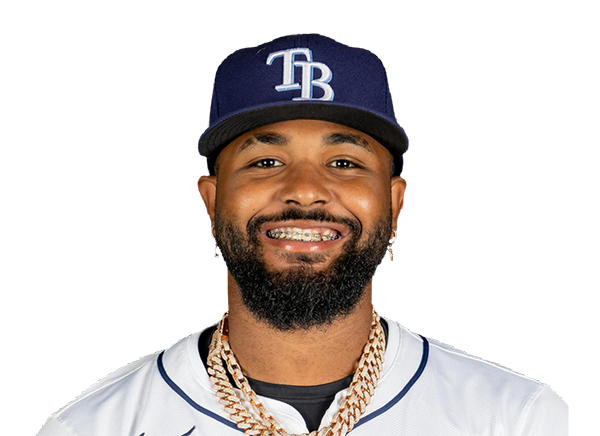 Junior Caminero | 2-3 | 3 | 3 | 2 | 2 | 1 | 1 | 1 | 12 | .277 | .361 | .526 |
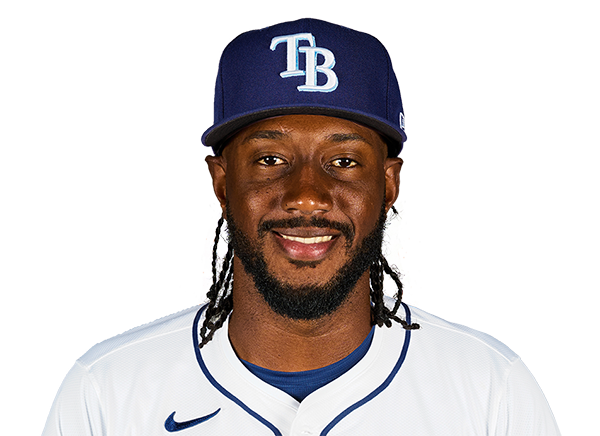 Jorge Mateo | 0-2 | 2 | 0 | 0 | 0 | 0 | 0 | 0 | 3 | .201 | .244 | .309 |
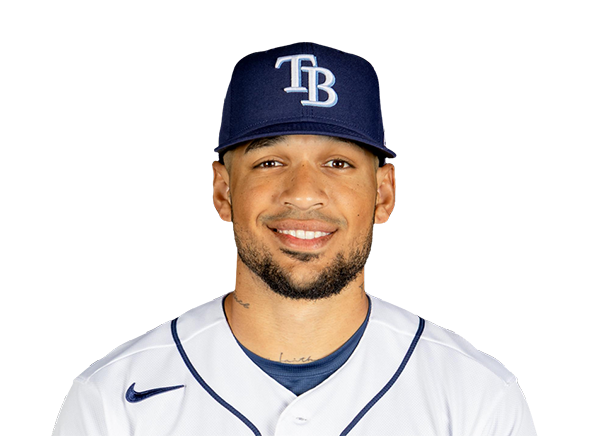 Victor Mesa Jr. | 4-5 | 5 | 3 | 4 | 2 | 0 | 0 | 0 | 9 | .260 | .328 | .502 |
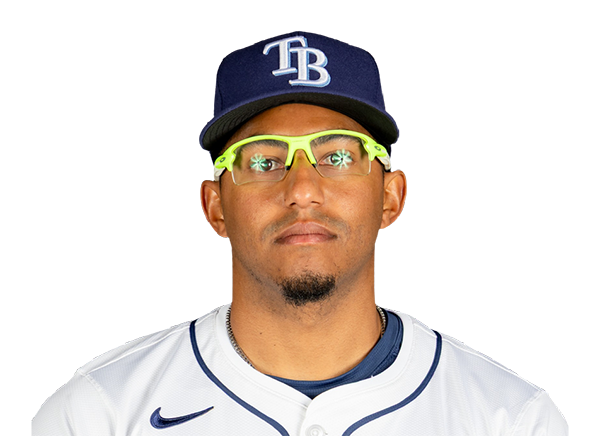 Richie Palacios | 2-4 | 4 | 0 | 2 | 4 | 0 | 1 | 1 | 14 | .238 | .333 | .378 |
 Jonny DeLuca | 1-4 | 4 | 1 | 1 | 0 | 0 | 1 | 1 | 19 | .263 | .298 | .410 |
 Cedric Mullins | 1-5 | 5 | 0 | 1 | 2 | 0 | 0 | 1 | 16 | .205 | .284 | .345 |
 Taylor Walls | 1-5 | 5 | 1 | 1 | 0 | 0 | 0 | 3 | 16 | .222 | .309 | .298 |
Philadelphia Phillies
| Player | H-AB | AB | R | H | RBI | HR | BB | K | #P | AVG | OBP | SLG |
|---|---|---|---|---|---|---|---|---|---|---|---|---|
 Trea Turner | 2-5 | 5 | 0 | 2 | 0 | 0 | 0 | 1 | 25 | .241 | .296 | .378 |
 Kyle Schwarber | 0-4 | 4 | 0 | 0 | 0 | 0 | 1 | 1 | 31 | .231 | .353 | .501 |
 Bryce Harper | 1-5 | 5 | 0 | 1 | 0 | 0 | 0 | 1 | 21 | .269 | .381 | .483 |
 Alec Bohm | 0-4 | 4 | 0 | 0 | 0 | 0 | 0 | 0 | 22 | .250 | .314 | .384 |
 Bryson Stott | 2-4 | 4 | 1 | 2 | 0 | 0 | 0 | 0 | 16 | .251 | .330 | .394 |
 Bryan De La Cruz | 0-2 | 2 | 0 | 0 | 0 | 0 | 2 | 1 | 22 | .280 | .349 | .413 |
 Brandon Marsh | 1-3 | 3 | 0 | 1 | 0 | 0 | 1 | 1 | 18 | .261 | .306 | .410 |
 J.T. Realmuto | 0-2 | 2 | 0 | 0 | 0 | 0 | 0 | 0 | 5 | .205 | .283 | .329 |
 Garrett Stubbs | 0-1 | 1 | 0 | 0 | 0 | 0 | 1 | 1 | 8 | .153 | .215 | .153 |
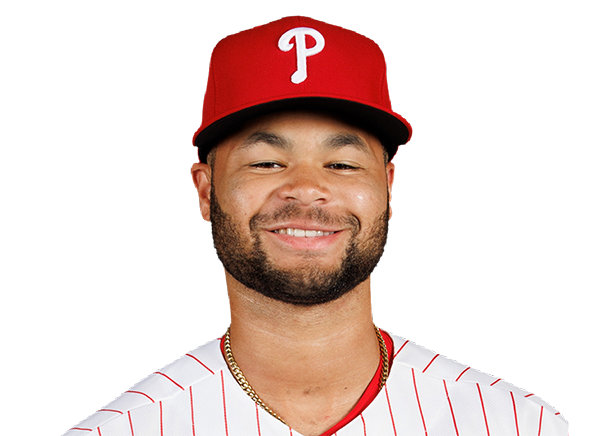 Justin Crawford | 1-4 | 4 | 0 | 1 | 0 | 0 | 0 | 2 | 20 | .264 | .310 | .354 |
Tampa Bay Rays
| Player | IP | H | R | ER | BB | K | HR | PC-ST | ERA | PC |
|---|---|---|---|---|---|---|---|---|---|---|
 Griffin Jax | 3.0 | 2 | 0 | 0 | 0 | 1 | 0 | 52-33 | 3.53 | 52 |
 Steven Matz | 1.0 | 0 | 0 | 0 | 0 | 1 | 0 | 10-7 | 5.49 | 10 |
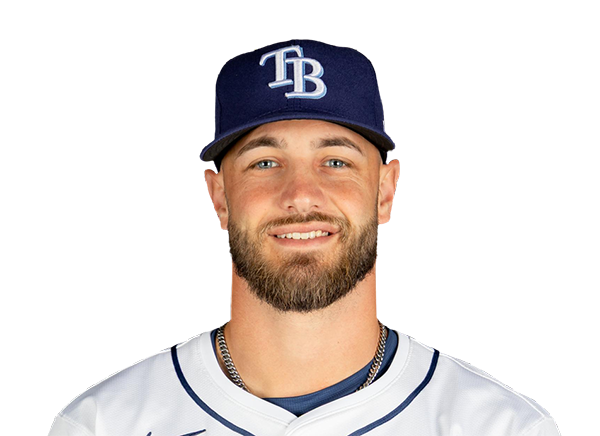 Brody Hopkins | 1.0 | 0 | 0 | 0 | 1 | 1 | 0 | 16-10 | 5.06 | 16 |
 Cam Booser | 1.0 | 1 | 0 | 0 | 0 | 2 | 0 | 21-13 | 1.98 | 21 |
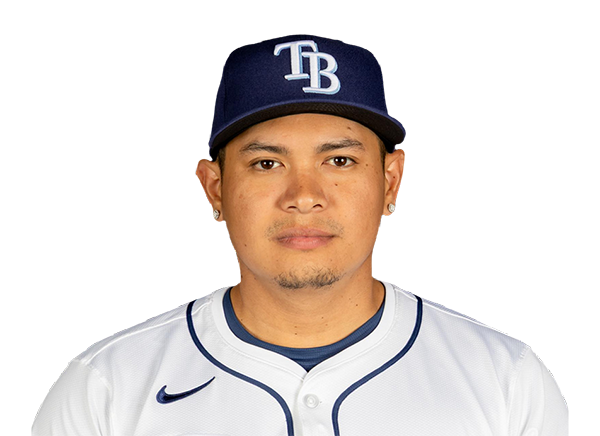 Manuel Rodriguez | 1.0 | 1 | 1 | 0 | 2 | 1 | 0 | 26-15 | 3.18 | 26 |
 Ty Johnson | 1.0 | 2 | 0 | 0 | 1 | 0 | 0 | 38-25 | 3.52 | 38 |
 Cole Sulser | 1.0 | 1 | 0 | 0 | 1 | 2 | 0 | 25-16 | 4.31 | 25 |
Philadelphia Phillies
| Player | IP | H | R | ER | BB | K | HR | PC-ST | ERA | PC |
|---|---|---|---|---|---|---|---|---|---|---|
 Aaron Nola | 1.0 | 4 | 3 | 3 | 0 | 0 | 1 | 21-15 | 4.67 | 21 |
 Tanner Banks | 1.1 | 0 | 0 | 0 | 1 | 1 | 0 | 21-12 | 6.19 | 21 |
 Chase Shugart | 1.2 | 1 | 1 | 1 | 1 | 3 | 0 | 29-18 | 4.02 | 29 |
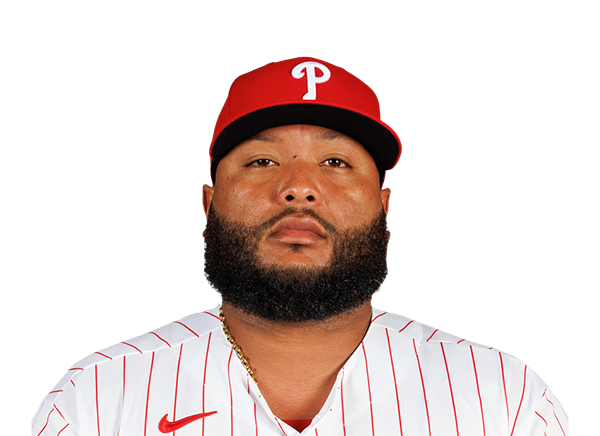 Jose Alvarado | 0.1 | 1 | 3 | 3 | 3 | 0 | 0 | 17-8 | 5.86 | 17 |
 Jose Urquidy | 2.2 | 5 | 3 | 3 | 0 | 3 | 0 | 50-35 | 4.95 | 50 |
 Brooks Raley | 1.0 | 2 | 0 | 0 | 0 | 0 | 0 | 11-9 | 3.25 | 11 |
 Max Lazar | 1.0 | 4 | 2 | 2 | 0 | 2 | 0 | 18-14 | 6.30 | 18 |
H2H / Season Series
PHI1–12
TB
PHI0–2
TB
PHI0–7
TB
PHI8–2
TB
TB3–1
PHI
Last 5 Games
| Date | Opponent | Result |
|---|---|---|
| Sep 26 | @ PHI | W12–1 |
| Sep 25 | @ PHI | W2–0 |
| Sep 24 |  @ NYY | L4–6 |
| Sep 23 | @ NYY | L2–9 |
| Sep 22 | @ NYY | W6–1 |
| Date | Opponent | Result |
|---|---|---|
| Sep 26 | vs TB | L1–12 |
| Sep 25 | vs TB | L0–2 |
| Sep 24 |  vs MIL | L1–5 |
| Sep 23 | vs MIL | L1–4 |
| Sep 22 | vs MIL | W6–4 |
Standings
American League
| Team | W | L | PCT | GB | DIFF | STRK |
|---|---|---|---|---|---|---|
| 1Rays | 98 | 63 | .609 | - | +90 | W2 |
2 Guardians | 85 | 76 | .528 | 13 | +12 | W3 |
3 Astros | 80 | 81 | .497 | 18 | -41 | W1 |
| 4Yankees | 93 | 68 | .578 | 5 | +138 | W1 |
5 Red Sox | 87 | 74 | .540 | 11 | +82 | W2 |
6 White Sox | 83 | 78 | .516 | 15 | +54 | L1 |
7 Rangers | 80 | 81 | .497 | 18 | -44 | W1 |
8 Orioles | 79 | 82 | .491 | 19 | -21 | L1 |
9 Blue Jays | 78 | 83 | .484 | 20 | -50 | L1 |
10 Twins | 76 | 85 | .472 | 22 | -60 | L1 |
11 Tigers | 76 | 85 | .472 | 22 | +73 | W2 |
12 Mariners | 75 | 86 | .466 | 23 | -62 | W1 |
13 Royals | 68 | 93 | .422 | 30 | -121 | L3 |
14 Athletics | 64 | 97 | .398 | 34 | -229 | L1 |
15 Angels | 62 | 99 | .385 | 36 | -93 | L1 |
National League
| Team | W | L | PCT | GB | DIFF | STRK |
|---|---|---|---|---|---|---|
| 1Brewers | 102 | 59 | .634 | - | +212 | W4 |
2 Dodgers | 99 | 62 | .615 | 3 | +197 | W2 |
3 Braves | 94 | 67 | .584 | 8 | +118 | W1 |
4 Padres | 90 | 71 | .559 | 12 | +36 | W1 |
5 Cubs | 88 | 73 | .547 | 14 | +143 | L2 |
| 6Phillies | 87 | 74 | .540 | 15 | +11 | L4 |
7 Diamondbacks | 86 | 75 | .534 | 16 | +14 | L1 |
8 Pirates | 81 | 80 | .503 | 21 | +26 | L2 |
9 Marlins | 79 | 82 | .491 | 23 | +1 | L1 |
10 Cardinals | 77 | 84 | .478 | 25 | -27 | L3 |
11 Nationals | 76 | 85 | .472 | 26 | +4 | L1 |
12 Reds | 75 | 86 | .466 | 27 | -156 | W1 |
13 Mets | 74 | 87 | .460 | 28 | -30 | W1 |
14 Giants | 65 | 96 | .404 | 37 | -87 | L4 |
15 Rockies | 58 | 103 | .360 | 44 | -190 | W1 |
TB
VS
PHI
Pitchers
Griffin Jax
Catchers
Liam Hicks
Infielders
Jonathan Aranda
Junior Caminero
Richie Palacios
Taylor Walls
Outfielders
Victor Mesa Jr.
Jonny DeLuca
Cedric Mullins
Designated Hitters
Yandy Diaz
Pitchers
Aaron Nola
Catchers
J.T. Realmuto
Infielders
Trea Turner
Bryce Harper
Alec Bohm
Bryson Stott
Outfielders
Bryan De La Cruz
Brandon Marsh
Justin Crawford
Designated Hitters
Kyle Schwarber
Rays
VS
Phillies
Batting
161
Team Games Played
161
5409
At Bats
5384
1397
Hits
1289
697
Runs Batted In
684
167
Home Runs
180
164
Stolen Bases
104
.258
Batting Average
.239
733
Runs
706
226
Doubles
241
22
Triples
23
2168
Total Bases
2116
514
Walks
525
1137
Strikeouts
1313
.327
On Base Percentage
.311
.401
Slugging Percentage
.393
.728
OBP Pct + SLG Pct
.704
161
Games Played
161
161
Games Started
161
58
Hit By Pitch
60
0.0
Wins Above Replacement
0.0
0.0
Offensive Wins Above Replacement
0.0
54
Caught Stealing
19
1
Is Qualified
1
723.9
Runs Created
673.8
4.6
Runs Created Per 27 Outs
4.2
.085
Walks Per Plate Appearance
.087
0.45
Walk To Strikeout Ratio
0.40
.143
Isolated Power
.154
.258
Secondary Average
.267
3.76
Pitches Per Plate Appearance
3.90
415
Extra Base Hits
444
6071
Plate Appearances
6040
32.4
At Bats Per Home Run
29.9
45
Sacrifice Hit
14
42
Sacrifice Flies
54
Pitching
161
Team Games Played
161
54
Quality Starts
74
98
Wins
87
63
Losses
74
58
Saves
42
116
Holds
73
1223
Hits
1358
587
Earned runs
643
199
Home Runs
189
405
Walks
484
1317
Strikeouts
1569
8.3
Strikeouts Per 9 Innings
9.9
139.3
Pitches Per Start
148.3
1.13
Walks Plus Hits Per Inning Pitched
1.29
3.68
Earned Run Average
4.05
63
Losses
74
1435.0
Innings pitched
1429.1
.609
Win Percentage
.540
77
Save Opportunities
65
.228
Opponent Batting Average
.248
.286
Opponent's On-base pct.
.315
.389
Opponent's Slugging pct.
.401
.675
Opponent's OPB Pct + SLG Pct
.716
5371
At Bats
5477
234
Doubles
224
17
Triples
24
52
Batters Hit
69
130
Stolen Bases
90
161
Games Played
161
1
Complete Games
2
13
Shutouts
19
42
Wild Pitches
40
612
Runs Batted In
661
3
Balks
3
1435.0
Innings pitched
1429.1
8.3
Strikeouts Per 9 Innings
9.9
34
Caught Stealing
37
161
Games Started
161
0.0
Wins Above Replacement
0.0
1
Is Qualified
1
643
Runs
695
587
Earned Runs
643
2088
Total Bases
2197
Fielding
161
Team Games Played
161
1435
Full Innings
1429
5664
Total Chances
5696
4305
Putouts
4288
1267
Assists
1328
92
Errors
80
226
Double Plays
241
0.984
Fielding Percentage
0.986
34.9
Range Factor
35.4
0.0
Zone Rating
0.0
161
Games Played
161
0
Games Started
0
0.0
Defensive Wins Above Replacement
0.0
1
Qualified
1