

Rays vs Rangers Live Score (6 Sep, 2026)
Game Information
Stage
STD
Season
2026
First Pitch
Sun, Sep 6, 2:35 pm
Venue
Globe Life Field
Location
Arlington, Texas
Venue Type
Indoor
Broadcast
MLB.TV
Attendance
33,285
Live Situation
0Balls
1Strikes
0Outs
—Pitcher
—At Bat
Pitch Sequence
1
STRIKE LOOKING
Sweeper
81 MPH
2
BALL IN PLAY
Sweeper
82 MPH
Injury Report







Team Stats
 TB
TEX


6
Runs
8
10
Hits
12
2
Errors
2
0
Home Runs
3
4
Walks
5
4
Strikeouts
8
Player Box Score
Tampa Bay Rays
| Player | H-AB | AB | R | H | RBI | HR | BB | K | #P | AVG | OBP | SLG |
|---|---|---|---|---|---|---|---|---|---|---|---|---|
 Yandy Diaz | 2-5 | 5 | 1 | 2 | 1 | 0 | 0 | 1 | 27 | .305 | .372 | .467 |
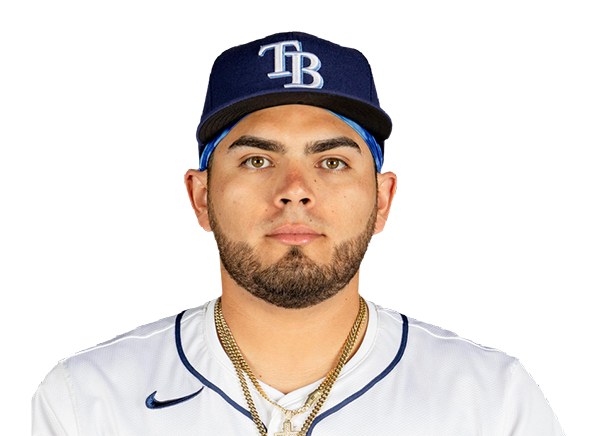 Jonathan Aranda | 2-4 | 4 | 0 | 2 | 1 | 0 | 0 | 0 | 16 | .279 | .361 | .432 |
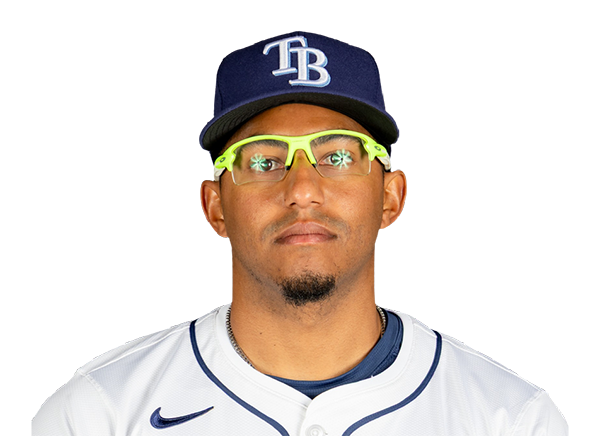 Richie Palacios | 0-0 | 0 | 0 | 0 | 0 | 0 | 0 | 0 | 0 | .227 | .321 | .359 |
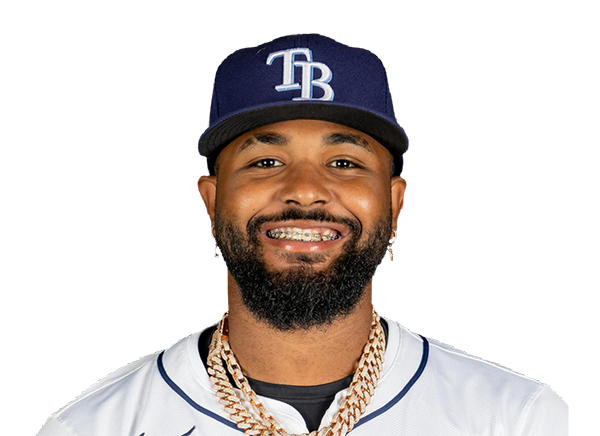 Junior Caminero | 0-2 | 2 | 0 | 0 | 1 | 0 | 2 | 0 | 14 | .280 | .365 | .530 |
 Ryan Vilade | 0-2 | 2 | 0 | 0 | 0 | 0 | 2 | 1 | 22 | .257 | .323 | .471 |
 Liam Hicks | 0-1 | 1 | 0 | 0 | 0 | 0 | 0 | 0 | 4 | .288 | .369 | .440 |
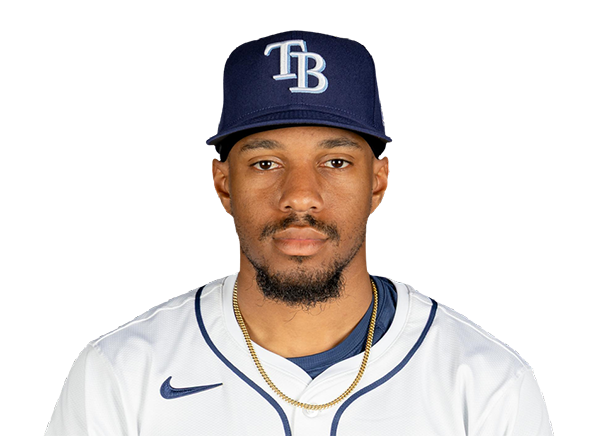 Chandler Simpson | 2-5 | 5 | 2 | 2 | 0 | 0 | 0 | 0 | 17 | .308 | .336 | .360 |
 Jonny DeLuca | 2-5 | 5 | 0 | 2 | 1 | 0 | 0 | 0 | 12 | .262 | .295 | .422 |
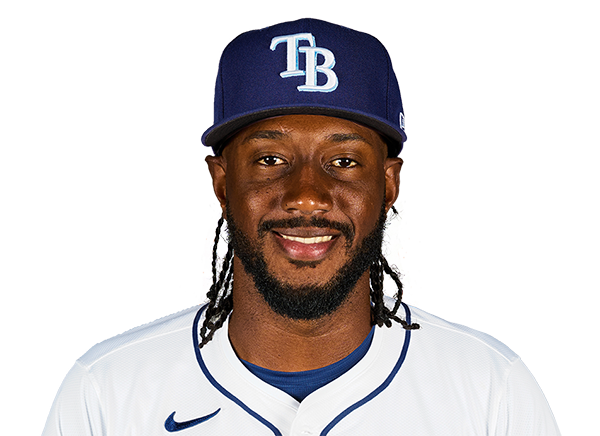 Jorge Mateo | 0-4 | 4 | 1 | 0 | 0 | 0 | 0 | 1 | 13 | .214 | .261 | .345 |
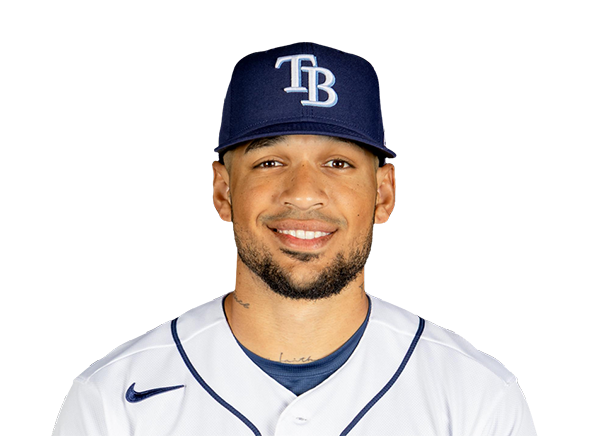 Victor Mesa Jr. | 1-4 | 4 | 1 | 1 | 1 | 0 | 0 | 0 | 12 | .227 | .291 | .431 |
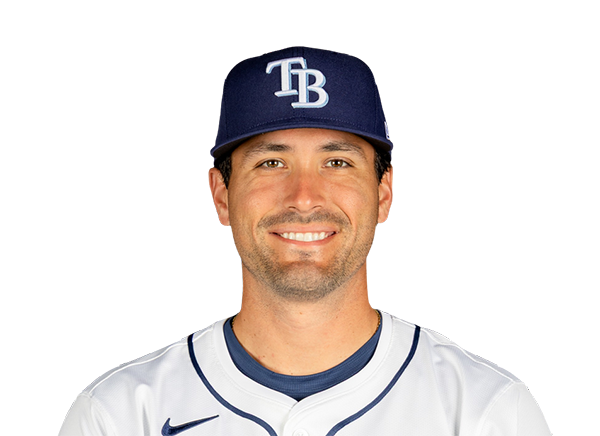 Nick Fortes | 1-4 | 4 | 1 | 1 | 1 | 0 | 0 | 1 | 14 | .265 | .307 | .364 |
Texas Rangers
| Player | H-AB | AB | R | H | RBI | HR | BB | K | #P | AVG | OBP | SLG |
|---|---|---|---|---|---|---|---|---|---|---|---|---|
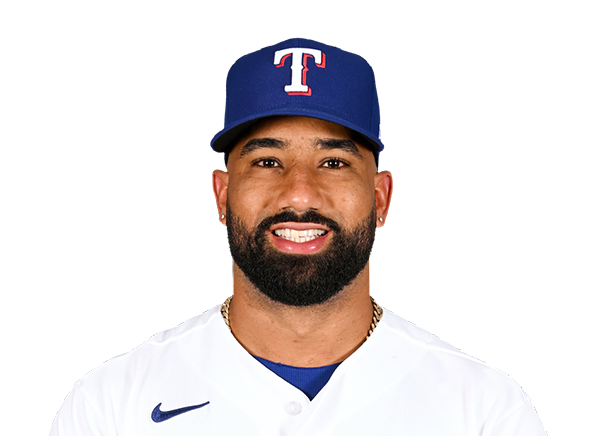 Ezequiel Duran | 3-5 | 5 | 1 | 3 | 1 | 0 | 0 | 2 | 12 | .277 | .337 | .457 |
 Corey Seager | 1-5 | 5 | 1 | 1 | 1 | 1 | 0 | 0 | 17 | .227 | .322 | .417 |
 Justin Foscue | 1-4 | 4 | 0 | 1 | 2 | 0 | 0 | 0 | 24 | .265 | .326 | .505 |
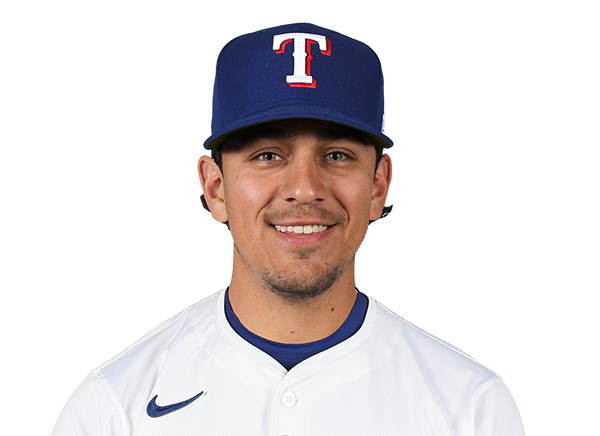 Nicky Lopez | 1-1 | 1 | 0 | 1 | 0 | 0 | 0 | 0 | 4 | .262 | .303 | .306 |
 Brandon Nimmo | 1-5 | 5 | 0 | 1 | 0 | 0 | 0 | 0 | 12 | .264 | .329 | .417 |
 Wyatt Langford | 0-2 | 2 | 1 | 0 | 0 | 0 | 3 | 1 | 24 | .245 | .331 | .436 |
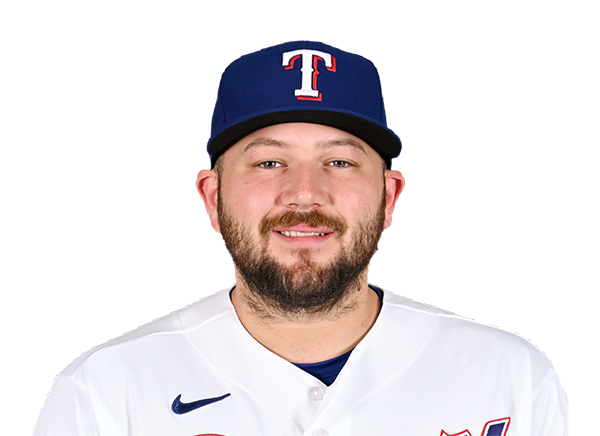 Jake Burger | 2-4 | 4 | 3 | 2 | 3 | 2 | 1 | 2 | 30 | .239 | .305 | .433 |
 Logan O'Hoppe | 2-3 | 3 | 2 | 2 | 0 | 0 | 0 | 0 | 11 | .218 | .274 | .302 |
 Joc Pederson | 0-0 | 0 | 0 | 0 | 0 | 0 | 1 | 0 | 6 | .235 | .329 | .485 |
 Cam Cauley | 0-0 | 0 | 0 | 0 | 0 | 0 | 0 | 0 | 0 | .207 | .281 | .345 |
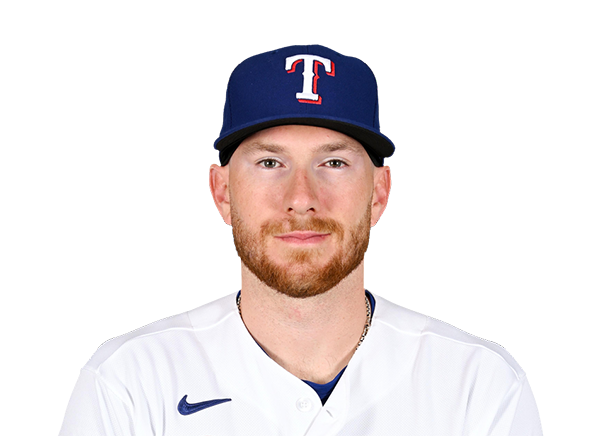 Danny Jansen | 0-1 | 1 | 0 | 0 | 0 | 0 | 0 | 0 | 4 | .170 | .262 | .327 |
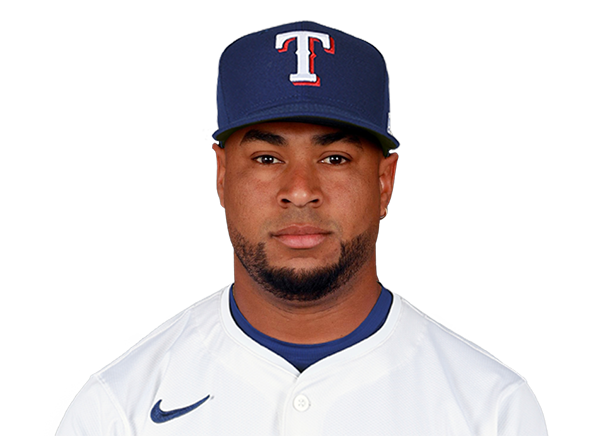 Elias Diaz | 1-3 | 3 | 0 | 1 | 1 | 0 | 0 | 1 | 11 | .233 | .267 | .404 |
 Cody Freeman | 0-1 | 1 | 0 | 0 | 0 | 0 | 0 | 0 | 3 | .256 | .326 | .333 |
 Evan Carter | 0-3 | 3 | 0 | 0 | 0 | 0 | 0 | 2 | 15 | .194 | .291 | .326 |
Tampa Bay Rays
| Player | IP | H | R | ER | BB | K | HR | PC-ST | ERA | PC |
|---|---|---|---|---|---|---|---|---|---|---|
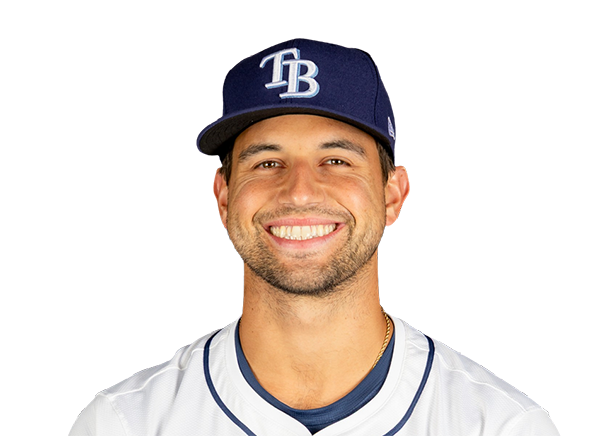 Ian Seymour | 3.0 | 5 | 4 | 3 | 1 | 2 | 2 | 75-49 | 4.33 | 75 |
 Kevin Kelly | 0.2 | 1 | 1 | 0 | 0 | 1 | 0 | 12-8 | 2.16 | 12 |
 Steven Matz | 1.0 | 3 | 2 | 2 | 1 | 1 | 0 | 33-24 | 5.88 | 33 |
 Casey Legumina | 1.1 | 1 | 0 | 0 | 1 | 1 | 0 | 18-11 | 3.76 | 18 |
 Ty Johnson | 1.0 | 0 | 0 | 0 | 1 | 2 | 0 | 14-10 | 0.00 | 14 |
 Cole Sulser | 1.0 | 2 | 1 | 1 | 1 | 1 | 1 | 21-12 | 4.94 | 21 |
Texas Rangers
| Player | IP | H | R | ER | BB | K | HR | PC-ST | ERA | PC |
|---|---|---|---|---|---|---|---|---|---|---|
 MacKenzie Gore | 3.0 | 7 | 5 | 5 | 3 | 1 | 0 | 68-41 | 4.51 | 68 |
 Trevor Williams | 2.0 | 0 | 0 | 0 | 1 | 0 | 0 | 30-15 | 3.38 | 30 |
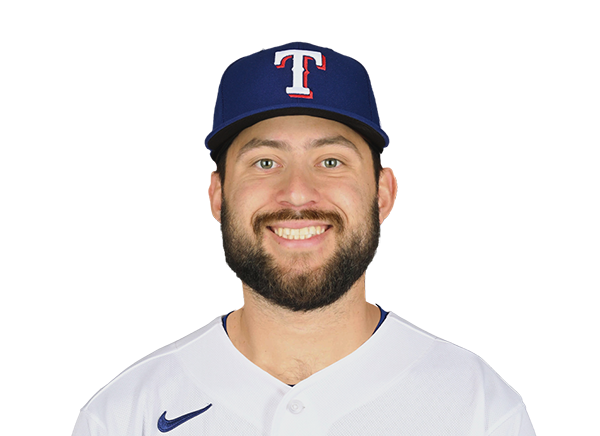 Chase Silseth | 1.0 | 0 | 0 | 0 | 0 | 1 | 0 | 7-6 | 2.98 | 7 |
 Tyler Alexander | 1.0 | 2 | 1 | 1 | 0 | 1 | 0 | 17-10 | 3.30 | 17 |
 Jacob Latz | 1.0 | 1 | 0 | 0 | 0 | 1 | 0 | 18-11 | 1.85 | 18 |
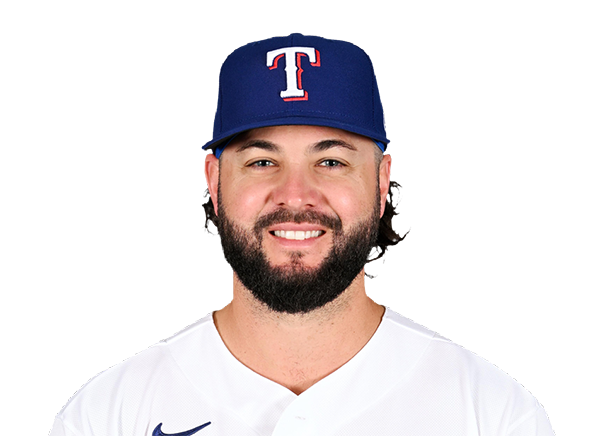 Jakob Junis | 1.0 | 0 | 0 | 0 | 0 | 0 | 0 | 11-7 | 2.74 | 11 |
H2H / Season Series
TEX8–6
TB
TEX3–6
TB
TEX6–7
TB
TEX6–0
TB
TB3–2
TEX
TB3–0
TEX
TB1–4
TEX
Last 5 Games
| Date | Opponent | Result |
|---|---|---|
| Sep 6 | @ TEX | L6–8 |
| Sep 5 | @ TEX | W6–3 |
| Sep 4 | @ TEX | W7–6 |
| Sep 3 | @ TEX | L0–6 |
| Sep 2 |  vs NYM | L4–10 |
| Date | Opponent | Result |
|---|---|---|
| Sep 6 | vs TB | W8–6 |
| Sep 5 | vs TB | L3–6 |
| Sep 4 | vs TB | L6–7 |
| Sep 3 | vs TB | W6–0 |
| Sep 2 |  vs ATH | L2–9 |
Standings
American League
| Team | W | L | PCT | GB | DIFF | STRK |
|---|---|---|---|---|---|---|
| 1Rays | 85 | 58 | .594 | - | +47 | L1 |
2 White Sox | 75 | 68 | .524 | 10 | +49 | W1 |
3 Astros | 73 | 71 | .507 | 12.5 | -38 | L2 |
4 Yankees | 81 | 62 | .566 | 4 | +117 | L1 |
5 Red Sox | 79 | 65 | .549 | 6.5 | +86 | W4 |
6 Guardians | 73 | 71 | .507 | 12.5 | -14 | W1 |
7 Blue Jays | 72 | 72 | .500 | 13.5 | -38 | L1 |
| 8Rangers | 71 | 73 | .493 | 14.5 | -44 | W1 |
9 Orioles | 69 | 75 | .479 | 16.5 | -29 | L6 |
10 Twins | 68 | 75 | .476 | 17 | -48 | L1 |
11 Mariners | 67 | 77 | .465 | 18.5 | -71 | W1 |
12 Tigers | 65 | 78 | .455 | 20 | +50 | L1 |
13 Royals | 64 | 80 | .444 | 21.5 | -88 | W1 |
| 14Athletics | 57 | 87 | .396 | 28.5 | -188 | L1 |
15 Angels | 54 | 89 | .378 | 31 | -77 | L1 |
National League
| Team | W | L | PCT | GB | DIFF | STRK |
|---|---|---|---|---|---|---|
1 Brewers | 88 | 56 | .611 | - | +168 | L2 |
2 Dodgers | 85 | 57 | .599 | 2 | +150 | W3 |
3 Braves | 85 | 58 | .594 | 2.5 | +120 | W1 |
4 Cubs | 81 | 63 | .563 | 7 | +132 | L1 |
5 Phillies | 80 | 63 | .559 | 7.5 | +34 | L1 |
6 Diamondbacks | 76 | 68 | .528 | 12 | -1 | W2 |
7 Padres | 75 | 68 | .524 | 12.5 | +8 | W1 |
8 Marlins | 72 | 72 | .500 | 16 | +15 | W1 |
9 Cardinals | 72 | 72 | .500 | 16 | -9 | W1 |
10 Pirates | 71 | 73 | .493 | 17 | +26 | W1 |
11 Reds | 69 | 74 | .483 | 18.5 | -105 | W2 |
12 Nationals | 67 | 77 | .465 | 21 | +11 | L3 |
| 13Mets | 65 | 78 | .455 | 22.5 | -48 | W1 |
14 Giants | 59 | 85 | .410 | 29 | -75 | L1 |
15 Rockies | 55 | 88 | .385 | 32.5 | -140 | L1 |
TB
VS
TEX
Pitchers
Ian Seymour
Catchers
Nick Fortes
Infielders
Jonathan Aranda
Junior Caminero
Ryan Vilade
Jorge Mateo
Outfielders
Chandler Simpson
Jonny DeLuca
Victor Mesa Jr.
Designated Hitters
Yandy Diaz
Pitchers
MacKenzie Gore
Catchers
Elias Diaz
Infielders
Corey Seager
Justin Foscue
Jake Burger
Cody Freeman
Outfielders
Ezequiel Duran
Brandon Nimmo
Wyatt Langford
Designated Hitters
Logan O'Hoppe
Rays
VS
Rangers
Batting
143
Team Games Played
144
4812
At Bats
4784
1252
Hits
1163
615
Runs Batted In
575
149
Home Runs
165
141
Stolen Bases
67
.260
Batting Average
.243
647
Runs
595
198
Doubles
211
21
Triples
22
1939
Total Bases
1913
456
Walks
470
996
Strikeouts
1215
.328
On Base Percentage
.317
.403
Slugging Percentage
.400
.731
OBP Pct + SLG Pct
.717
143
Games Played
144
143
Games Started
144
52
Hit By Pitch
65
0.0
Wins Above Replacement
0.0
0.0
Offensive Wins Above Replacement
0.0
48
Caught Stealing
20
1
Is Qualified
1
648.1
Runs Created
613.8
4.6
Runs Created Per 27 Outs
4.4
.084
Walks Per Plate Appearance
.087
0.46
Walk To Strikeout Ratio
0.39
.143
Isolated Power
.157
.257
Secondary Average
.265
3.77
Pitches Per Plate Appearance
3.88
368
Extra Base Hits
398
5406
Plate Appearances
5382
32.3
At Bats Per Home Run
29.0
43
Sacrifice Hit
30
40
Sacrifice Flies
32
Pitching
143
Team Games Played
144
48
Quality Starts
46
85
Wins
71
58
Losses
73
55
Saves
40
108
Holds
72
1112
Hits
1217
542
Earned runs
603
181
Home Runs
174
362
Walks
440
1166
Strikeouts
1210
8.2
Strikeouts Per 9 Innings
8.6
139.7
Pitches Per Start
145.4
1.15
Walks Plus Hits Per Inning Pitched
1.31
3.82
Earned Run Average
4.30
58
Losses
73
1277.0
Innings pitched
1262.1
.594
Win Percentage
.493
72
Save Opportunities
57
.232
Opponent Batting Average
.250
.290
Opponent's On-base pct.
.318
.396
Opponent's Slugging pct.
.413
.686
Opponent's OPB Pct + SLG Pct
.730
4799
At Bats
4871
214
Doubles
227
15
Triples
22
51
Batters Hit
58
117
Stolen Bases
91
143
Games Played
144
1
Complete Games
0
12
Shutouts
13
36
Wild Pitches
41
571
Runs Batted In
620
3
Balks
1
1277.0
Innings pitched
1262.1
8.2
Strikeouts Per 9 Innings
8.6
31
Caught Stealing
24
143
Games Started
144
0.0
Wins Above Replacement
0.0
1
Is Qualified
1
600
Runs
639
542
Earned Runs
603
1899
Total Bases
2010
Fielding
143
Team Games Played
144
1277
Full Innings
1262
5047
Total Chances
4980
3831
Putouts
3787
1129
Assists
1130
87
Errors
63
198
Double Plays
211
0.983
Fielding Percentage
0.987
35.0
Range Factor
35.1
0.0
Zone Rating
0.0
143
Games Played
144
0
Games Started
0
0.0
Defensive Wins Above Replacement
0.0
1
Qualified
1