

Rays vs Yankees Live Score (24 Sep, 2026)
Game Information
Stage
STD
Season
2026
First Pitch
Thu, Sep 24, 7:05 pm
Venue
Yankee Stadium
Location
Bronx, New York
Venue Type
Outdoor
Broadcast
MLB.TV
Attendance
44,136
Live Situation
0Balls
1Strikes
0Outs
—Pitcher
—At Bat
Pitch Sequence
1
STRIKE LOOKING
Four-seam FB
91 MPH
2
BALL IN PLAY
Four-seam FB
91 MPH
Injury Report


Team Stats
 TB
NYY


4
Runs
6
9
Hits
7
1
Errors
2
0
Home Runs
2
7
Walks
3
8
Strikeouts
7
Player Box Score
Tampa Bay Rays
| Player | H-AB | AB | R | H | RBI | HR | BB | K | #P | AVG | OBP | SLG |
|---|---|---|---|---|---|---|---|---|---|---|---|---|
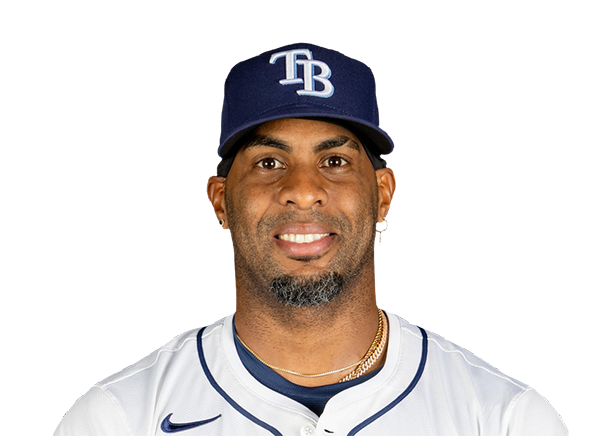 Yandy Diaz | 2-4 | 4 | 2 | 2 | 0 | 0 | 1 | 0 | 18 | .292 | .358 | .446 |
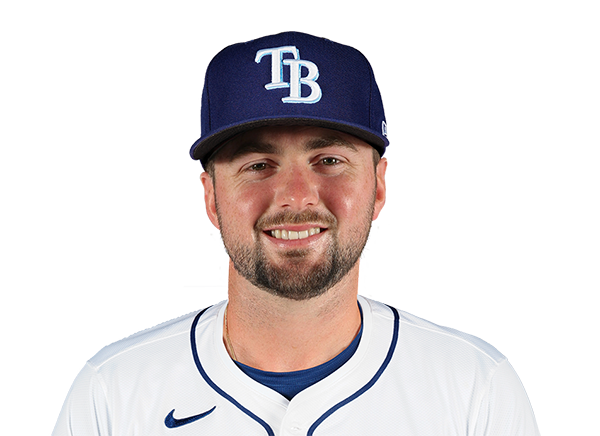 Liam Hicks | 0-5 | 5 | 0 | 0 | 1 | 0 | 0 | 2 | 31 | .281 | .366 | .431 |
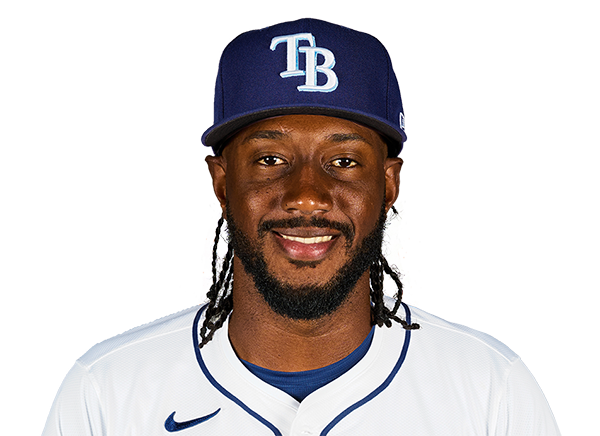 Jorge Mateo | 0-0 | 0 | 0 | 0 | 0 | 0 | 0 | 0 | 0 | .206 | .250 | .317 |
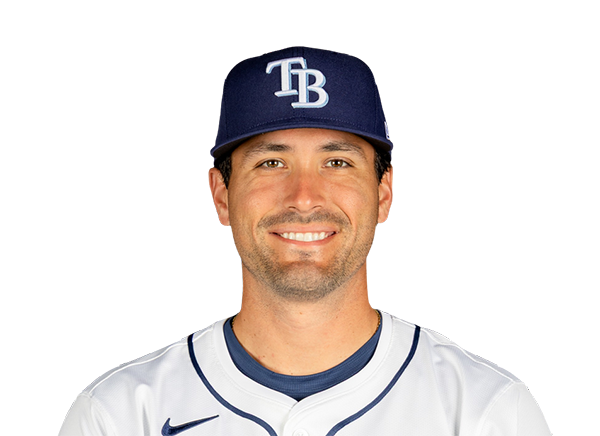 Nick Fortes | 0-0 | 0 | 0 | 0 | 0 | 0 | 0 | 0 | 0 | .262 | .309 | .372 |
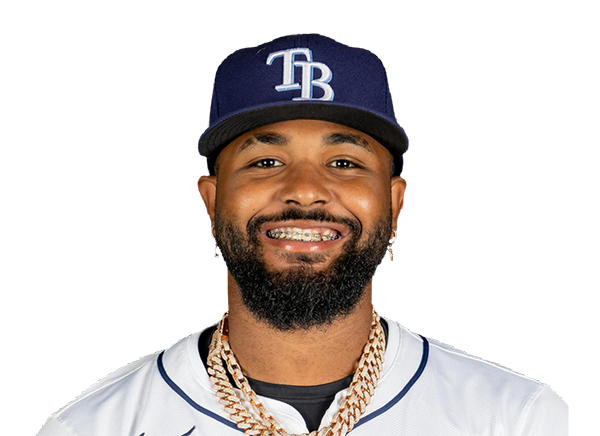 Junior Caminero | 2-5 | 5 | 0 | 2 | 2 | 0 | 0 | 0 | 19 | .275 | .360 | .522 |
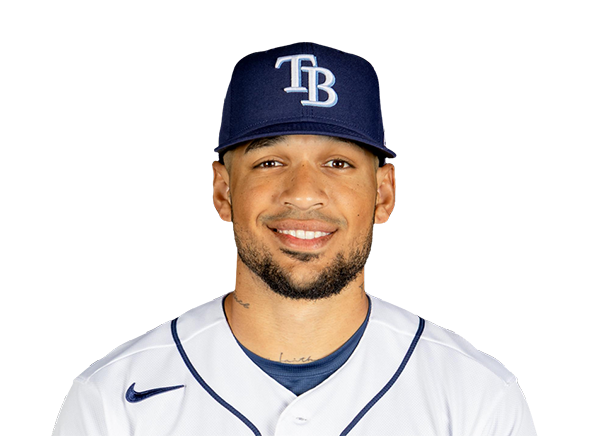 Victor Mesa Jr. | 1-5 | 5 | 0 | 1 | 0 | 0 | 0 | 2 | 19 | .248 | .319 | .487 |
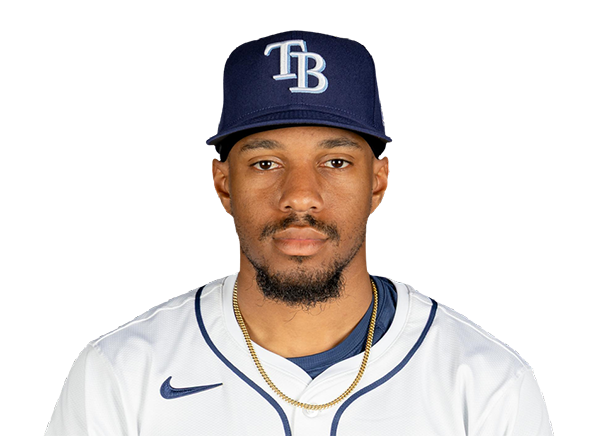 Chandler Simpson | 1-5 | 5 | 0 | 1 | 0 | 0 | 0 | 0 | 13 | .308 | .335 | .357 |
 Jonny DeLuca | 1-3 | 3 | 0 | 1 | 0 | 0 | 2 | 1 | 25 | .263 | .297 | .414 |
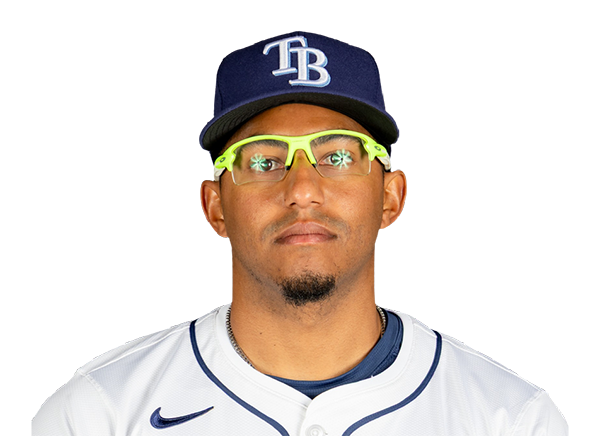 Richie Palacios | 1-1 | 1 | 0 | 1 | 0 | 0 | 1 | 0 | 9 | .234 | .330 | .374 |
 Ben Williamson | 0-2 | 2 | 0 | 0 | 0 | 0 | 1 | 0 | 9 | .242 | .305 | .324 |
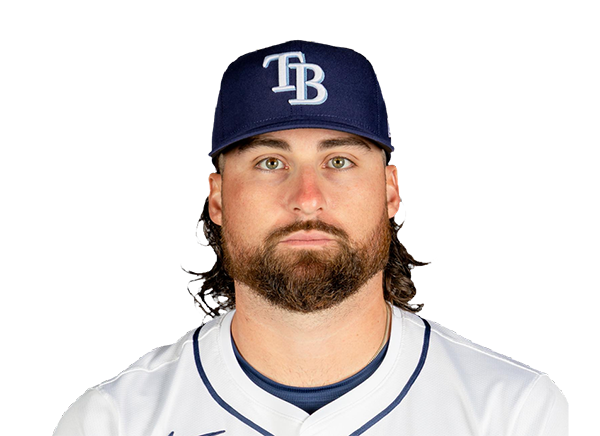 Ryan Vilade | 0-3 | 3 | 1 | 0 | 0 | 0 | 1 | 2 | 18 | .245 | .323 | .435 |
 Taylor Walls | 1-3 | 3 | 1 | 1 | 0 | 0 | 1 | 1 | 20 | .223 | .310 | .297 |
New York Yankees
| Player | H-AB | AB | R | H | RBI | HR | BB | K | #P | AVG | OBP | SLG |
|---|---|---|---|---|---|---|---|---|---|---|---|---|
 Paul Goldschmidt | 2-4 | 4 | 0 | 2 | 1 | 0 | 0 | 1 | 19 | .255 | .317 | .457 |
 Cody Bellinger | 0-4 | 4 | 0 | 0 | 0 | 0 | 0 | 0 | 10 | .266 | .341 | .433 |
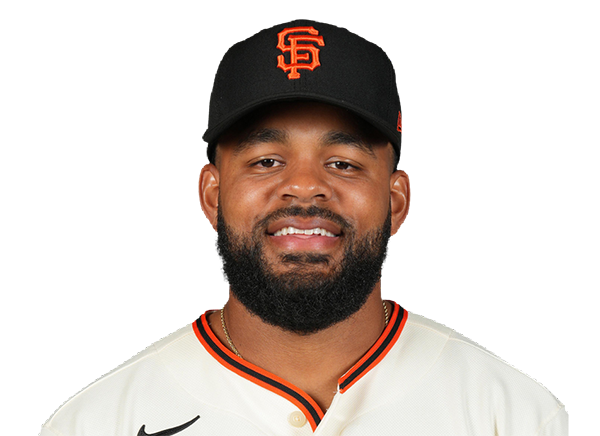 Heliot Ramos | 1-4 | 4 | 0 | 1 | 0 | 0 | 0 | 2 | 16 | .242 | .302 | .406 |
 Ben Rice | 0-3 | 3 | 1 | 0 | 0 | 0 | 1 | 1 | 18 | .262 | .362 | .535 |
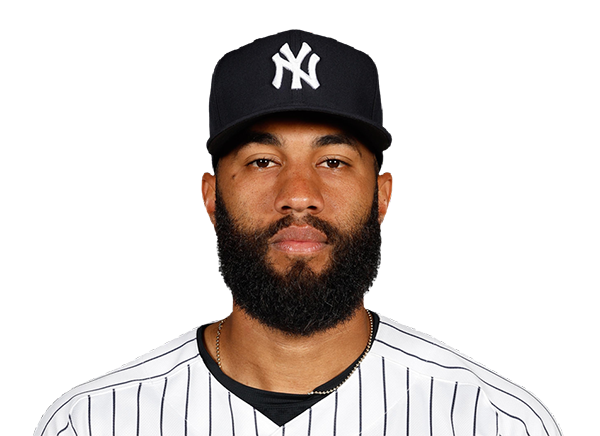 Amed Rosario | 1-4 | 4 | 1 | 1 | 0 | 0 | 0 | 0 | 11 | .233 | .275 | .404 |
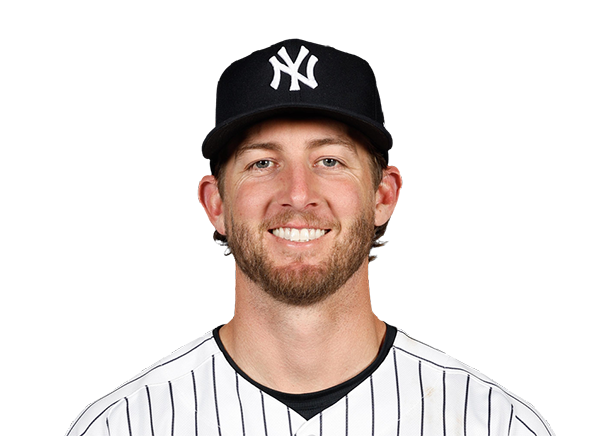 Ryan McMahon | 0-0 | 0 | 0 | 0 | 0 | 0 | 0 | 0 | 0 | .210 | .276 | .352 |
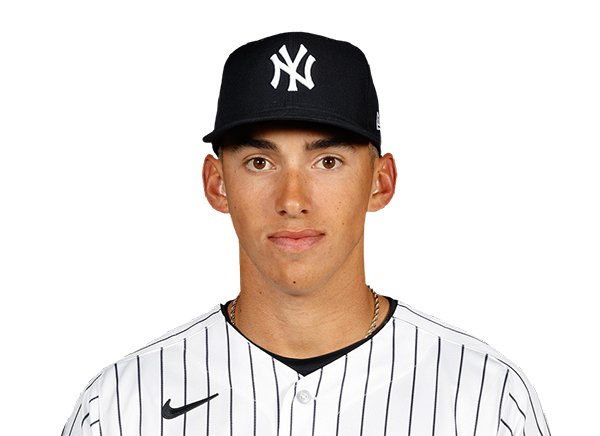 George Lombard Jr. | 2-4 | 4 | 2 | 2 | 3 | 1 | 0 | 0 | 13 | .243 | .292 | .426 |
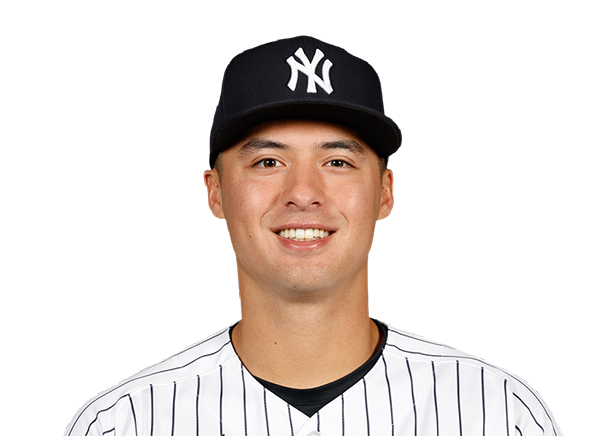 Anthony Volpe | 0-3 | 3 | 0 | 0 | 0 | 0 | 1 | 1 | 17 | .241 | .319 | .330 |
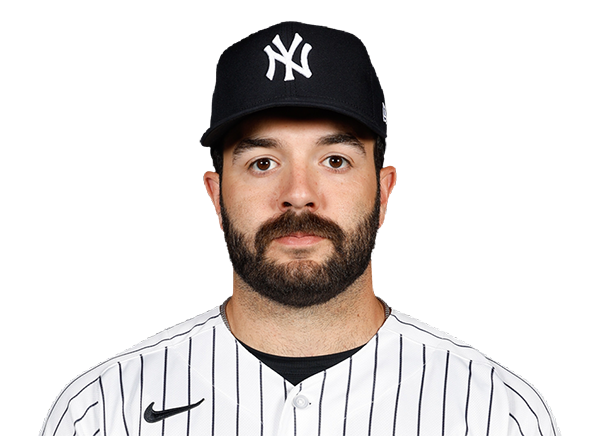 Austin Wells | 1-2 | 2 | 2 | 1 | 1 | 1 | 1 | 0 | 10 | .187 | .290 | .334 |
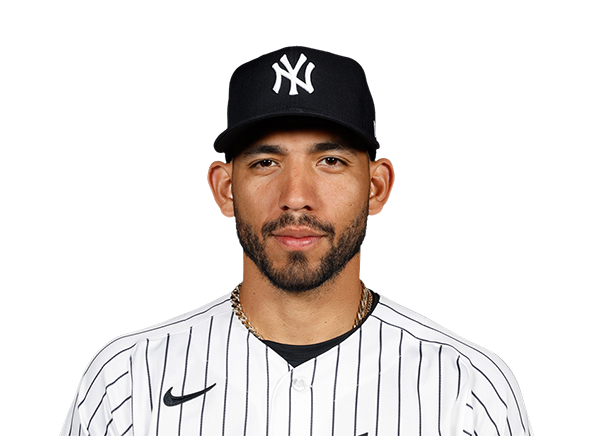 Jose Caballero | 0-3 | 3 | 0 | 0 | 0 | 0 | 0 | 2 | 13 | .233 | .290 | .368 |
Tampa Bay Rays
| Player | IP | H | R | ER | BB | K | HR | PC-ST | ERA | PC |
|---|---|---|---|---|---|---|---|---|---|---|
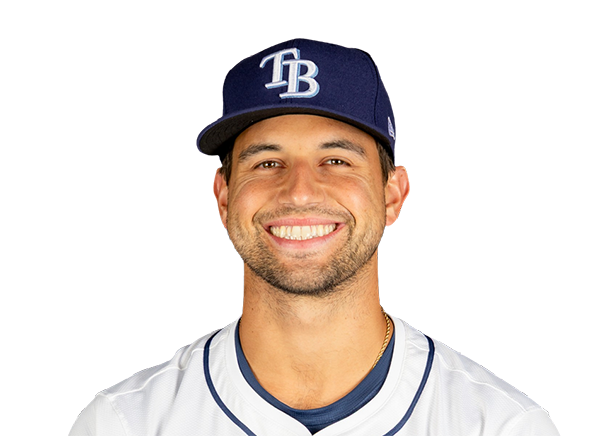 Ian Seymour | 5.0 | 1 | 0 | 0 | 0 | 3 | 0 | 58-41 | 4.22 | 58 |
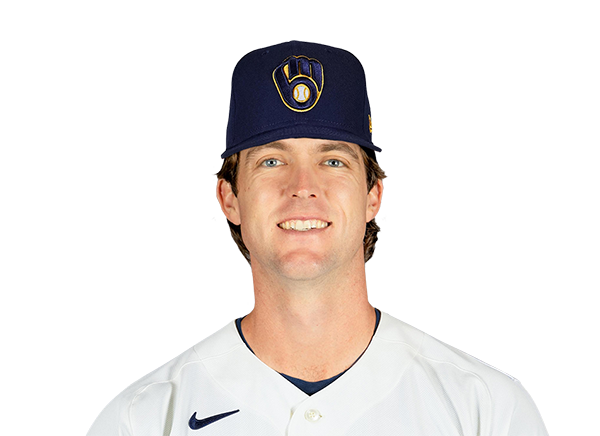 Jake Woodford | 1.1 | 3 | 3 | 3 | 1 | 2 | 1 | 28-16 | 7.81 | 28 |
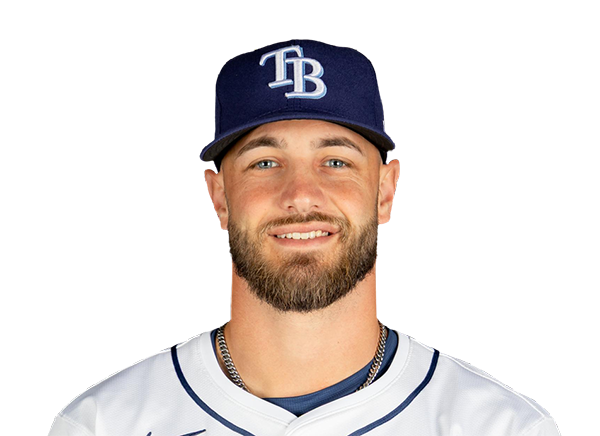 Brody Hopkins | 0.1 | 1 | 1 | 1 | 2 | 0 | 0 | 18-9 | 6.23 | 18 |
 Steven Matz | 1.1 | 2 | 2 | 2 | 0 | 2 | 1 | 23-16 | 5.56 | 23 |
New York Yankees
| Player | IP | H | R | ER | BB | K | HR | PC-ST | ERA | PC |
|---|---|---|---|---|---|---|---|---|---|---|
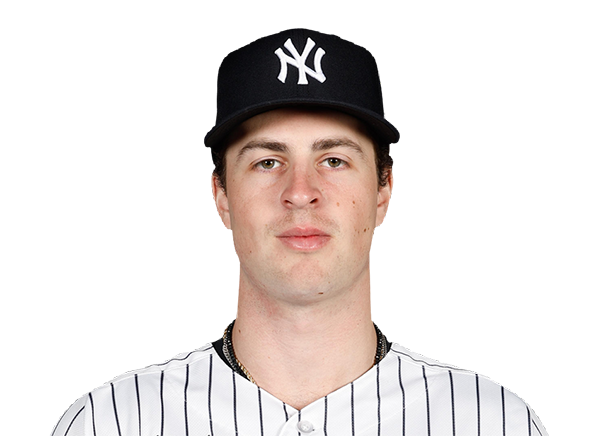 Cam Schlittler | 3.0 | 3 | 2 | 1 | 2 | 5 | 0 | 70-47 | 1.95 | 70 |
 Michael Fulmer | 1.1 | 2 | 1 | 1 | 1 | 3 | 0 | 28-19 | 3.29 | 28 |
 Tim Hill | 0.2 | 2 | 0 | 0 | 0 | 0 | 0 | 12-8 | 4.60 | 12 |
 Luis Gil | 2.0 | 0 | 1 | 0 | 4 | 0 | 0 | 41-18 | 4.61 | 41 |
 Bradley Hanner | 2.0 | 2 | 0 | 0 | 0 | 0 | 0 | 30-19 | 8.59 | 30 |
H2H / Season Series
NYY6–4
TB
NYY9–2
TB
NYY1–6
TB
NYY2–0
TB
TB4–12
NYY
TB3–0
NYY
TB6–4
NYY
TB1–5
NYY
NYY2–0
TB
NYY2–4
TB
Last 5 Games
| Date | Opponent | Result |
|---|---|---|
| Sep 24 | @ NYY | L4–6 |
| Sep 23 | @ NYY | L2–9 |
| Sep 22 | @ NYY | W6–1 |
| Sep 22 | @ NYY | L0–2 |
| Sep 20 |  vs BOS | W5–1 |
| Date | Opponent | Result |
|---|---|---|
| Sep 24 | vs TB | W6–4 |
| Sep 23 | vs TB | W9–2 |
| Sep 22 | vs TB | L1–6 |
| Sep 22 | vs TB | W2–0 |
| Sep 20 |  @ ARI | L4–8 |
Standings
American League
| Team | W | L | PCT | GB | DIFF | STRK |
|---|---|---|---|---|---|---|
| 1Rays | 96 | 63 | .604 | - | +77 | L2 |
2 Guardians | 83 | 76 | .522 | 13 | +3 | W1 |
3 Astros | 79 | 80 | .497 | 17 | -51 | W1 |
| 4Yankees | 92 | 67 | .579 | 4 | +143 | W2 |
| 5Red Sox | 85 | 74 | .535 | 11 | +79 | L1 |
6 White Sox | 82 | 77 | .516 | 14 | +52 | W1 |
7 Rangers | 79 | 80 | .497 | 17 | -40 | W1 |
8 Orioles | 78 | 81 | .491 | 18 | -26 | W3 |
9 Blue Jays | 77 | 82 | .484 | 19 | -47 | L3 |
10 Twins | 75 | 84 | .472 | 21 | -64 | W2 |
11 Tigers | 74 | 85 | .465 | 22 | +71 | L2 |
12 Mariners | 74 | 85 | .465 | 22 | -64 | L1 |
13 Royals | 68 | 91 | .428 | 28 | -112 | L1 |
14 Athletics | 63 | 96 | .396 | 33 | -219 | L1 |
15 Angels | 61 | 98 | .384 | 35 | -91 | W1 |
National League
| Team | W | L | PCT | GB | DIFF | STRK |
|---|---|---|---|---|---|---|
1 Brewers | 100 | 59 | .629 | - | +207 | W2 |
2 Dodgers | 97 | 62 | .610 | 3 | +194 | L2 |
3 Braves | 93 | 66 | .585 | 7 | +116 | L1 |
4 Padres | 89 | 70 | .560 | 11 | +40 | W2 |
5 Cubs | 88 | 71 | .553 | 12 | +146 | W1 |
6 Phillies | 87 | 72 | .547 | 13 | +24 | L2 |
| 7Diamondbacks | 85 | 74 | .535 | 15 | +10 | W5 |
8 Pirates | 81 | 78 | .509 | 19 | +28 | W1 |
9 Marlins | 78 | 81 | .491 | 22 | +3 | L1 |
10 Cardinals | 77 | 82 | .484 | 23 | -22 | L1 |
11 Nationals | 75 | 84 | .472 | 25 | +9 | W2 |
12 Reds | 74 | 85 | .465 | 26 | -159 | W1 |
13 Mets | 73 | 86 | .459 | 27 | -35 | L1 |
14 Giants | 65 | 94 | .409 | 35 | -84 | L2 |
15 Rockies | 57 | 102 | .358 | 43 | -188 | L4 |
TB
VS
NYY
Pitchers
Ian Seymour
Catchers
Liam Hicks
Infielders
Junior Caminero
Richie Palacios
Ryan Vilade
Taylor Walls
Outfielders
Victor Mesa Jr.
Chandler Simpson
Jonny DeLuca
Designated Hitters
Yandy Diaz
Pitchers
Cam Schlittler
Catchers
Austin Wells
Infielders
Ben Rice
Amed Rosario
George Lombard Jr.
Anthony Volpe
Outfielders
Cody Bellinger
Heliot Ramos
Jose Caballero
Designated Hitters
Paul Goldschmidt
Rays
VS
Yankees
Batting
159
Team Games Played
159
5332
At Bats
5264
1374
Hits
1233
683
Runs Batted In
698
165
Home Runs
223
164
Stolen Bases
153
.258
Batting Average
.234
719
Runs
731
221
Doubles
221
22
Triples
18
2134
Total Bases
2159
507
Walks
566
1116
Strikeouts
1457
.326
On Base Percentage
.311
.400
Slugging Percentage
.410
.727
OBP Pct + SLG Pct
.721
159
Games Played
159
159
Games Started
159
58
Hit By Pitch
37
0.0
Wins Above Replacement
0.0
0.0
Offensive Wins Above Replacement
0.0
54
Caught Stealing
48
1
Is Qualified
1
711.9
Runs Created
689.1
4.6
Runs Created Per 27 Outs
4.4
.085
Walks Per Plate Appearance
.096
0.45
Walk To Strikeout Ratio
0.39
.143
Isolated Power
.176
.258
Secondary Average
.303
3.77
Pitches Per Plate Appearance
3.98
408
Extra Base Hits
462
5987
Plate Appearances
5923
32.3
At Bats Per Home Run
23.6
45
Sacrifice Hit
10
42
Sacrifice Flies
41
Pitching
159
Team Games Played
159
54
Quality Starts
65
96
Wins
92
63
Losses
67
57
Saves
45
113
Holds
86
1212
Hits
1180
587
Earned runs
506
199
Home Runs
160
397
Walks
478
1303
Strikeouts
1421
8.3
Strikeouts Per 9 Innings
9.0
139.0
Pitches Per Start
145.1
1.14
Walks Plus Hits Per Inning Pitched
1.16
3.73
Earned Run Average
3.20
63
Losses
67
1417.0
Innings pitched
1423.1
.604
Win Percentage
.579
76
Save Opportunities
73
.228
Opponent Batting Average
.223
.286
Opponent's On-base pct.
.292
.391
Opponent's Slugging pct.
.364
.677
Opponent's OPB Pct + SLG Pct
.657
5307
At Bats
5289
231
Doubles
214
17
Triples
26
52
Batters Hit
55
129
Stolen Bases
74
159
Games Played
159
1
Complete Games
0
12
Shutouts
15
40
Wild Pitches
34
612
Runs Batted In
562
3
Balks
3
1417.0
Innings pitched
1423.1
8.3
Strikeouts Per 9 Innings
9.0
34
Caught Stealing
22
159
Games Started
159
0.0
Wins Above Replacement
0.0
1
Is Qualified
1
642
Runs
588
587
Earned Runs
506
2074
Total Bases
1926
Fielding
159
Team Games Played
159
1417
Full Innings
1423
5592
Total Chances
5752
4251
Putouts
4270
1250
Assists
1387
91
Errors
95
221
Double Plays
221
0.984
Fielding Percentage
0.983
34.9
Range Factor
35.8
0.0
Zone Rating
0.0
159
Games Played
159
0
Games Started
0
0.0
Defensive Wins Above Replacement
0.0
1
Qualified
1