

Red Sox vs Rangers Live Score (16 Sep, 2026)
Game Information
Stage
STD
Season
2026
First Pitch
Tue, Sep 15, 8:05 pm
Venue
Globe Life Field
Location
Arlington, Texas
Venue Type
Indoor
Broadcast
MLB.TV
Attendance
30,907
Live Situation
1Balls
3Strikes
0Outs
—Pitcher
—At Bat
Pitch Sequence
1
BALL
Slider
86 MPH
2
STRIKE FOUL
Changeup
86 MPH
3
STRIKE SWINGING
Changeup
85 MPH
4
STRIKE SWINGING
Curve
82 MPH
Injury Report







Team Stats
 BOS
TEX


2
Runs
4
6
Hits
7
0
Errors
1
1
Home Runs
0
3
Walks
3
15
Strikeouts
10
Player Box Score
Boston Red Sox
| Player | H-AB | AB | R | H | RBI | HR | BB | K | #P | AVG | OBP | SLG |
|---|---|---|---|---|---|---|---|---|---|---|---|---|
 Roman Anthony | 1-5 | 5 | 0 | 1 | 0 | 0 | 0 | 2 | 14 | .240 | .338 | .371 |
 Mickey Gasper | 1-2 | 2 | 0 | 1 | 0 | 0 | 1 | 1 | 14 | .267 | .377 | .488 |
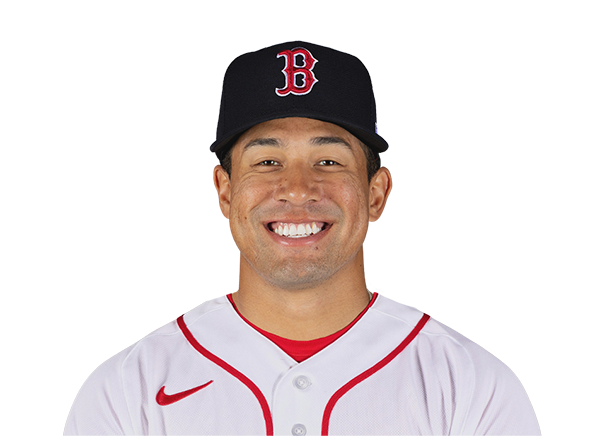 Jahmai Jones | 1-2 | 2 | 0 | 1 | 0 | 0 | 0 | 1 | 9 | .214 | .308 | .379 |
 Adley Rutschman | 0-4 | 4 | 0 | 0 | 0 | 0 | 0 | 0 | 20 | .236 | .315 | .418 |
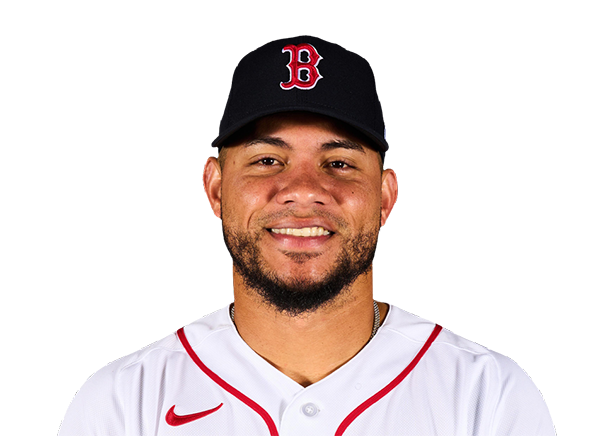 Willson Contreras | 0-3 | 3 | 0 | 0 | 0 | 0 | 1 | 2 | 19 | .275 | .385 | .514 |
 Wilyer Abreu | 0-4 | 4 | 0 | 0 | 0 | 0 | 0 | 3 | 22 | .255 | .334 | .463 |
 Trevor Story | 1-3 | 3 | 0 | 1 | 0 | 0 | 1 | 1 | 15 | .240 | .270 | .344 |
 Jarren Duran | 0-2 | 2 | 0 | 0 | 0 | 0 | 0 | 2 | 11 | .204 | .261 | .361 |
 Andruw Monasterio | 0-1 | 1 | 0 | 0 | 0 | 0 | 0 | 1 | 8 | .239 | .299 | .384 |
 Nate Eaton | 0-0 | 0 | 0 | 0 | 0 | 0 | 0 | 0 | 0 | .132 | .267 | .263 |
 Caleb Durbin | 1-3 | 3 | 1 | 1 | 0 | 0 | 0 | 1 | 17 | .251 | .332 | .385 |
 Nick Sogard | 1-3 | 3 | 1 | 1 | 2 | 1 | 0 | 1 | 12 | .264 | .360 | .416 |
Texas Rangers
| Player | H-AB | AB | R | H | RBI | HR | BB | K | #P | AVG | OBP | SLG |
|---|---|---|---|---|---|---|---|---|---|---|---|---|
 Justin Foscue | 0-1 | 1 | 0 | 0 | 0 | 0 | 1 | 1 | 14 | .268 | .330 | .493 |
 Evan Carter | 0-2 | 2 | 0 | 0 | 0 | 0 | 0 | 0 | 5 | .193 | .291 | .319 |
 Corey Seager | 2-4 | 4 | 0 | 2 | 2 | 0 | 0 | 1 | 20 | .234 | .325 | .438 |
 Josh Jung | 0-4 | 4 | 0 | 0 | 0 | 0 | 0 | 2 | 17 | .294 | .359 | .436 |
 Jake Burger | 0-3 | 3 | 0 | 0 | 0 | 0 | 1 | 1 | 17 | .232 | .303 | .424 |
 Brandon Nimmo | 1-4 | 4 | 1 | 1 | 0 | 0 | 0 | 2 | 12 | .263 | .327 | .413 |
 Wyatt Langford | 0-4 | 4 | 0 | 0 | 0 | 0 | 0 | 1 | 15 | .239 | .325 | .435 |
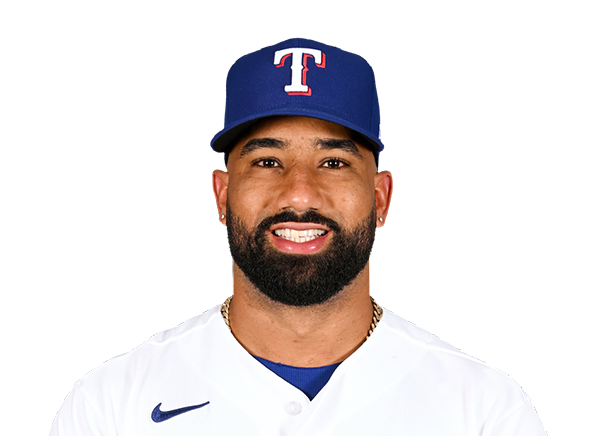 Ezequiel Duran | 2-3 | 3 | 1 | 2 | 0 | 0 | 0 | 0 | 10 | .271 | .332 | .441 |
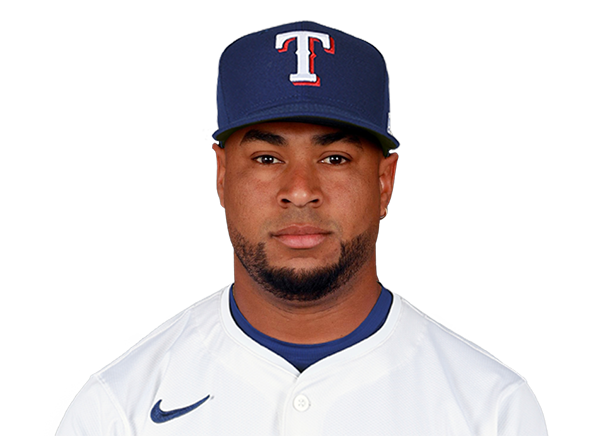 Elias Diaz | 1-2 | 2 | 1 | 1 | 2 | 0 | 0 | 1 | 13 | .239 | .271 | .405 |
 Alejandro Osuna | 0-1 | 1 | 0 | 0 | 0 | 0 | 0 | 1 | 3 | .254 | .345 | .295 |
 Danny Jansen | 1-2 | 2 | 1 | 1 | 0 | 0 | 1 | 0 | 16 | .192 | .282 | .359 |
Boston Red Sox
| Player | IP | H | R | ER | BB | K | HR | PC-ST | ERA | PC |
|---|---|---|---|---|---|---|---|---|---|---|
 Patrick Sandoval | 2.2 | 4 | 4 | 4 | 2 | 5 | 0 | 68-46 | 4.99 | 68 |
 Brayan Bello | 1.2 | 0 | 0 | 0 | 0 | 2 | 0 | 19-13 | 4.74 | 19 |
 Alec Gamboa | 1.0 | 1 | 0 | 0 | 1 | 1 | 0 | 18-10 | 1.24 | 18 |
 Wyatt Olds | 0.2 | 2 | 0 | 0 | 0 | 1 | 0 | 14-10 | 1.32 | 14 |
 Jovani Moran | 2.0 | 0 | 0 | 0 | 0 | 1 | 0 | 23-17 | 3.23 | 23 |
Texas Rangers
| Player | IP | H | R | ER | BB | K | HR | PC-ST | ERA | PC |
|---|---|---|---|---|---|---|---|---|---|---|
 Jacob deGrom | 5.0 | 3 | 2 | 2 | 1 | 8 | 1 | 92-53 | 3.79 | 92 |
 Chase Silseth | 1.0 | 1 | 0 | 0 | 0 | 3 | 0 | 20-15 | 3.38 | 20 |
 Tyler Alexander | 1.0 | 0 | 0 | 0 | 0 | 1 | 0 | 11-9 | 3.38 | 11 |
 Robert Garcia | 0.1 | 1 | 0 | 0 | 1 | 0 | 0 | 11-5 | 2.19 | 11 |
 Jacob Latz | 1.2 | 1 | 0 | 0 | 1 | 3 | 0 | 27-17 | 2.00 | 27 |
H2H / Season Series
TEX4–2
BOS
BOS4–6
TEX
BOS6–3
TEX
BOS10–1
TEX
Last 5 Games
| Date | Opponent | Result |
|---|---|---|
| Sep 15 | @ TEX | L2–4 |
| Sep 13 |  vs KC | W4–1 |
| Sep 12 | vs KC | W5–1 |
| Sep 11 | vs KC | L2–3 |
| Sep 9 |  vs LAA | L4–6 |
| Date | Opponent | Result |
|---|---|---|
| Sep 15 | vs BOS | W4–2 |
| Sep 13 |  @ ARI | W7–6 |
| Sep 12 | @ ARI | W6–2 |
| Sep 11 | @ ARI | L1–9 |
| Sep 10 |  @ SEA | L3–4 |
Standings
American League
| Team | W | L | PCT | GB | DIFF | STRK |
|---|---|---|---|---|---|---|
1 Rays | 91 | 59 | .607 | - | +70 | W4 |
2 White Sox | 77 | 74 | .510 | 14.5 | +37 | L1 |
3 Astros | 76 | 75 | .503 | 15.5 | -51 | W1 |
4 Yankees | 88 | 63 | .583 | 3.5 | +137 | W3 |
| 5Red Sox | 82 | 69 | .543 | 9.5 | +86 | L1 |
6 Guardians | 77 | 75 | .507 | 15 | -10 | W1 |
| 7Rangers | 75 | 76 | .497 | 16.5 | -42 | W3 |
8 Blue Jays | 75 | 77 | .493 | 17 | -41 | L2 |
9 Orioles | 74 | 78 | .487 | 18 | -32 | W2 |
10 Tigers | 72 | 79 | .477 | 19.5 | +80 | W6 |
11 Twins | 70 | 81 | .464 | 21.5 | -74 | L3 |
| 12Mariners | 70 | 82 | .461 | 22 | -61 | L3 |
| 13Royals | 66 | 85 | .437 | 25.5 | -96 | L3 |
14 Athletics | 61 | 90 | .404 | 30.5 | -204 | L1 |
| 15Angels | 58 | 93 | .384 | 33.5 | -73 | W2 |
National League
| Team | W | L | PCT | GB | DIFF | STRK |
|---|---|---|---|---|---|---|
1 Brewers | 94 | 57 | .623 | - | +199 | W1 |
2 Dodgers | 92 | 59 | .609 | 2 | +177 | W2 |
3 Braves | 89 | 63 | .586 | 5.5 | +115 | W1 |
4 Cubs | 84 | 68 | .553 | 10.5 | +139 | L1 |
5 Phillies | 83 | 68 | .550 | 11 | +28 | L1 |
6 Padres | 82 | 69 | .543 | 12 | +17 | L1 |
| 7Diamondbacks | 80 | 72 | .526 | 14.5 | +1 | L1 |
8 Pirates | 75 | 76 | .497 | 19 | +22 | L1 |
9 Marlins | 75 | 77 | .493 | 19.5 | +7 | W1 |
10 Cardinals | 75 | 77 | .493 | 19.5 | -13 | L1 |
11 Nationals | 71 | 81 | .467 | 23.5 | +6 | W4 |
12 Reds | 70 | 81 | .464 | 24 | -152 | L2 |
13 Mets | 69 | 82 | .457 | 25 | -37 | L3 |
14 Giants | 63 | 89 | .414 | 31.5 | -71 | W1 |
15 Rockies | 56 | 95 | .371 | 38 | -164 | W1 |
BOS
VS
TEX
Pitchers
Patrick Sandoval
Catchers
Adley Rutschman
Infielders
Willson Contreras
Trevor Story
Caleb Durbin
Nick Sogard
Outfielders
Roman Anthony
Wilyer Abreu
Jarren Duran
Designated Hitters
Mickey Gasper
Pitchers
Jacob deGrom
Catchers
Danny Jansen
Infielders
Justin Foscue
Corey Seager
Josh Jung
Jake Burger
Outfielders
Brandon Nimmo
Wyatt Langford
Ezequiel Duran
Designated Hitters
Elias Diaz
Red Sox
VS
Rangers
Batting
151
Team Games Played
151
5066
At Bats
5018
1255
Hits
1220
636
Runs Batted In
607
156
Home Runs
173
101
Stolen Bases
73
.248
Batting Average
.243
665
Runs
628
271
Doubles
218
24
Triples
22
2042
Total Bases
2001
483
Walks
491
1233
Strikeouts
1290
.322
On Base Percentage
.317
.403
Slugging Percentage
.399
.725
OBP Pct + SLG Pct
.716
151
Games Played
151
151
Games Started
151
91
Hit By Pitch
70
0.0
Wins Above Replacement
0.0
0.0
Offensive Wins Above Replacement
0.0
38
Caught Stealing
20
1
Is Qualified
1
672.6
Runs Created
643.2
4.5
Runs Created Per 27 Outs
4.4
.084
Walks Per Plate Appearance
.087
0.39
Walk To Strikeout Ratio
0.38
.155
Isolated Power
.156
.263
Secondary Average
.264
3.84
Pitches Per Plate Appearance
3.87
451
Extra Base Hits
413
5722
Plate Appearances
5646
32.5
At Bats Per Home Run
29.0
32
Sacrifice Hit
34
46
Sacrifice Flies
32
Pitching
151
Team Games Played
151
61
Quality Starts
49
82
Wins
75
69
Losses
76
42
Saves
42
89
Holds
76
1225
Hits
1272
536
Earned runs
633
147
Home Runs
181
436
Walks
458
1308
Strikeouts
1272
8.8
Strikeouts Per 9 Innings
8.7
140.7
Pitches Per Start
145.2
1.24
Walks Plus Hits Per Inning Pitched
1.31
3.59
Earned Run Average
4.31
69
Losses
76
1343.1
Innings pitched
1322.1
.543
Win Percentage
.497
56
Save Opportunities
60
.242
Opponent Batting Average
.249
.307
Opponent's On-base pct.
.317
.379
Opponent's Slugging pct.
.412
.687
Opponent's OPB Pct + SLG Pct
.730
5062
At Bats
5099
235
Doubles
242
9
Triples
23
60
Batters Hit
63
106
Stolen Bases
91
151
Games Played
151
0
Complete Games
0
16
Shutouts
13
31
Wild Pitches
43
554
Runs Batted In
651
3
Balks
1
1343.1
Innings pitched
1322.1
8.8
Strikeouts Per 9 Innings
8.7
20
Caught Stealing
24
151
Games Started
151
0.0
Wins Above Replacement
0.0
1
Is Qualified
1
579
Runs
670
536
Earned Runs
633
1919
Total Bases
2103
Fielding
151
Team Games Played
151
1343
Full Innings
1322
5422
Total Chances
5208
4030
Putouts
3967
1316
Assists
1176
76
Errors
65
271
Double Plays
218
0.986
Fielding Percentage
0.988
35.8
Range Factor
35.0
0.0
Zone Rating
0.0
151
Games Played
151
0
Games Started
0
0.0
Defensive Wins Above Replacement
0.0
1
Qualified
1