

Red Sox vs Yankees Live Score (1 Oct, 2026)
Game Information
Stage
RD16
Season
2026
First Pitch
Wed, Sep 30, 8:00 pm
Venue
Yankee Stadium
Location
Bronx, New York
Venue Type
Outdoor
Broadcast
NBC
Attendance
49,004
Live Situation
2Balls
3Strikes
0Outs
—Pitcher
—At Bat
Pitch Sequence
1
STRIKE LOOKING
Four-seam FB
97 MPH
2
BALL
Four-seam FB
96 MPH
3
STRIKE FOUL
Splitter
89 MPH
4
BALL
Four-seam FB
96 MPH
5
STRIKE SWINGING
Four-seam FB
95 MPH
Injury Report


Team Stats
 BOS
NYY

2
Runs
9
4
Hits
14
1
Errors
0
2
Home Runs
2
2
Walks
3
8
Strikeouts
10
Player Box Score
Boston Red Sox
| Player | H-AB | AB | R | H | RBI | HR | BB | K | #P | AVG | OBP | SLG |
|---|---|---|---|---|---|---|---|---|---|---|---|---|
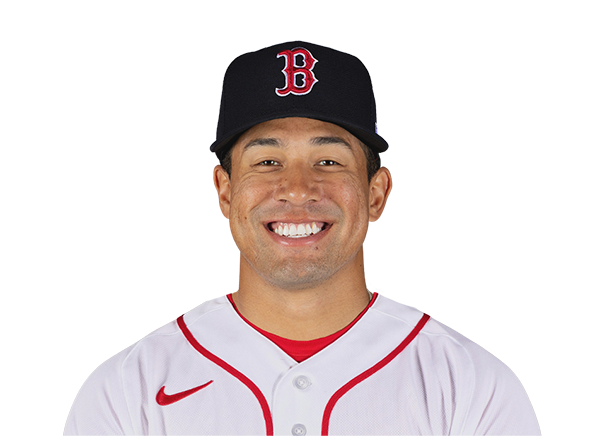 Jahmai Jones |
0-4 | 4 | 0 | 0 | 0 | 0 | 0 | 2 | 21 | .000 | .000 | .000 |
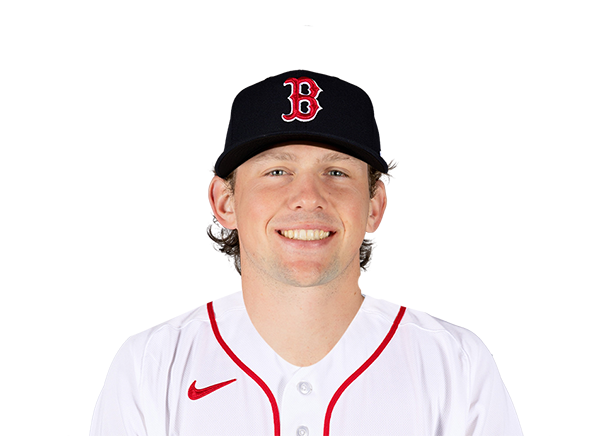 Adley Rutschman |
0-4 | 4 | 0 | 0 | 0 | 0 | 0 | 1 | 18 | .125 | .125 | .125 |
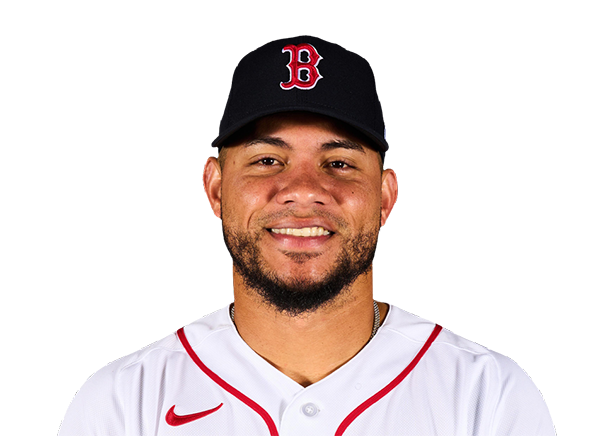 Willson Contreras |
2-2 | 2 | 1 | 2 | 1 | 1 | 2 | 0 | 20 | .333 | .500 | .833 |
 Wilyer Abreu |
0-4 | 4 | 0 | 0 | 0 | 0 | 0 | 1 | 17 | .143 | .143 | .143 |
 Ceddanne Rafaela |
0-4 | 4 | 0 | 0 | 0 | 0 | 0 | 0 | 13 | .000 | .000 | .000 |
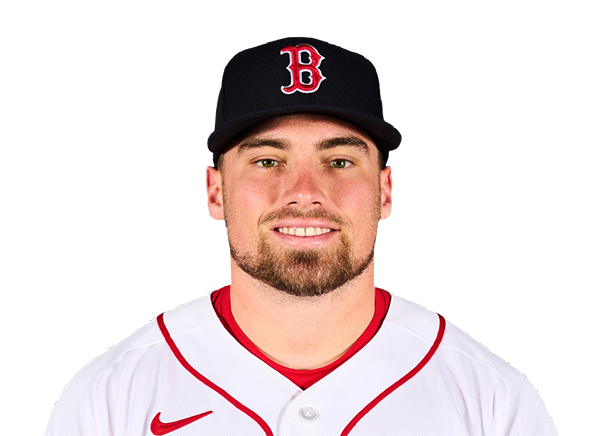 Caleb Durbin |
0-4 | 4 | 0 | 0 | 0 | 0 | 0 | 1 | 17 | .000 | .000 | .000 |
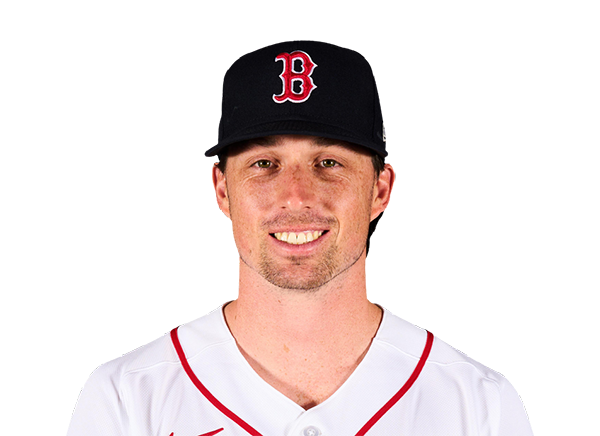 Nick Sogard |
1-3 | 3 | 1 | 1 | 1 | 1 | 0 | 1 | 10 | .167 | .167 | .667 |
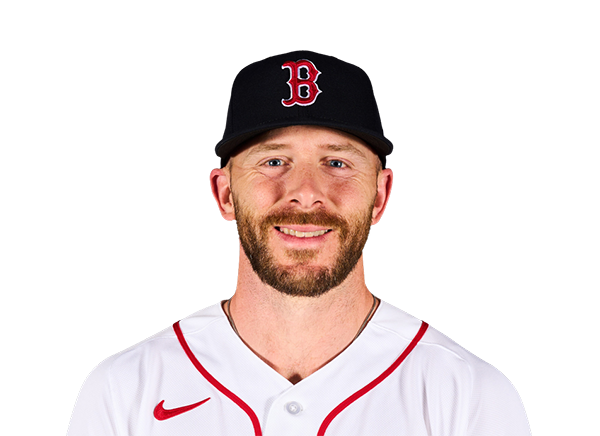 Trevor Story |
0-3 | 3 | 0 | 0 | 0 | 0 | 0 | 1 | 15 | .167 | .167 | .333 |
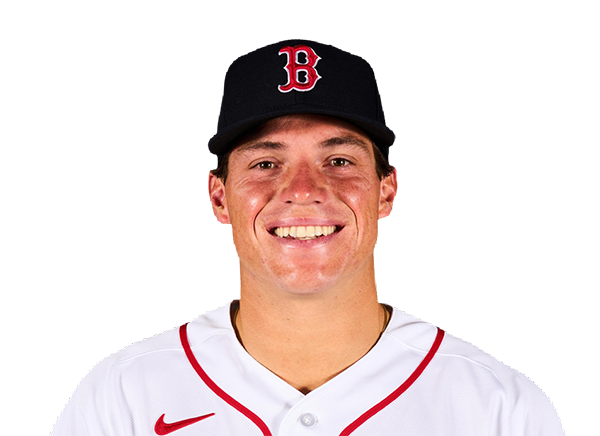 Nate Eaton |
1-2 | 2 | 0 | 1 | 0 | 0 | 0 | 1 | 8 | .500 | .500 | 1.000 |
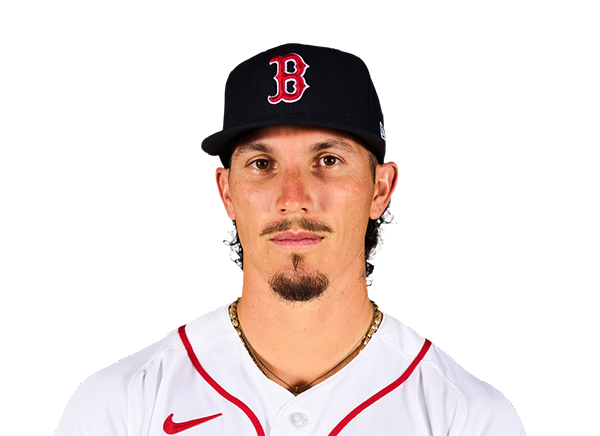 Jarren Duran |
0-1 | 1 | 0 | 0 | 0 | 0 | 0 | 0 | 3 | .000 | .250 | .000 |
New York Yankees
| Player | H-AB | AB | R | H | RBI | HR | BB | K | #P | AVG | OBP | SLG |
|---|---|---|---|---|---|---|---|---|---|---|---|---|
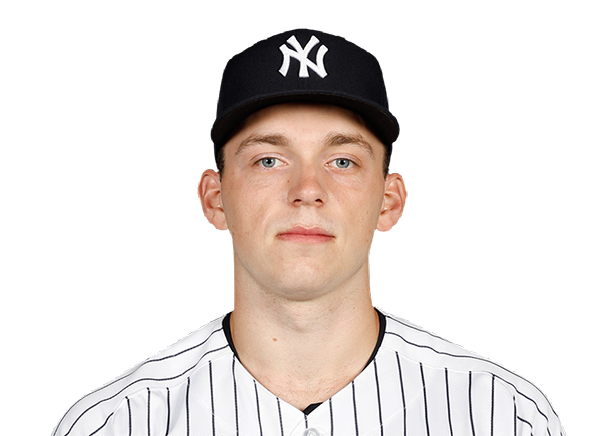 Ben Rice |
1-4 | 4 | 1 | 1 | 0 | 0 | 1 | 1 | 19 | .556 | .600 | 1.333 |
 Cody Bellinger |
2-5 | 5 | 1 | 2 | 4 | 1 | 0 | 1 | 18 | .333 | .333 | .667 |
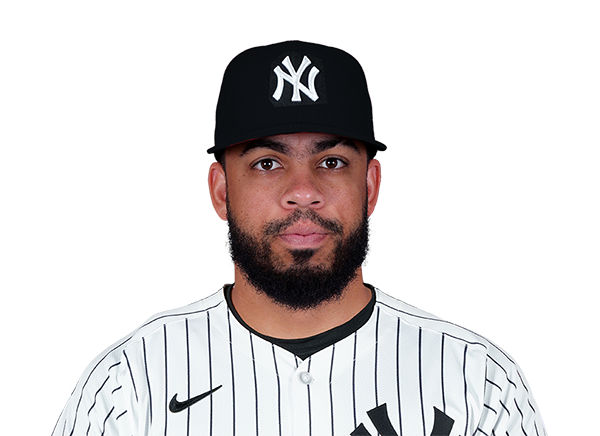 Luis Garcia Jr. |
3-5 | 5 | 1 | 3 | 1 | 1 | 0 | 1 | 19 | .500 | .500 | 1.000 |
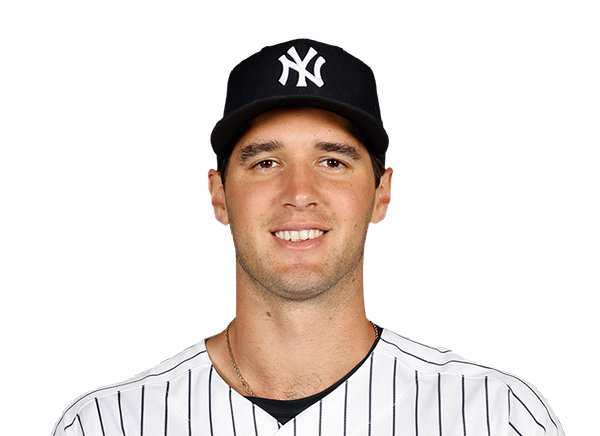 Spencer Jones |
1-5 | 5 | 1 | 1 | 0 | 0 | 0 | 4 | 25 | .250 | .333 | .250 |
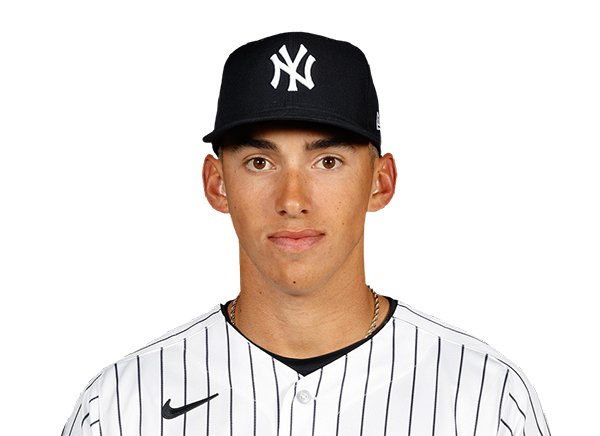 George Lombard Jr. |
1-4 | 4 | 1 | 1 | 1 | 0 | 0 | 2 | 14 | .500 | .500 | .500 |
 Jazz Chisholm Jr. |
2-3 | 3 | 2 | 2 | 0 | 0 | 1 | 0 | 17 | .667 | .750 | .667 |
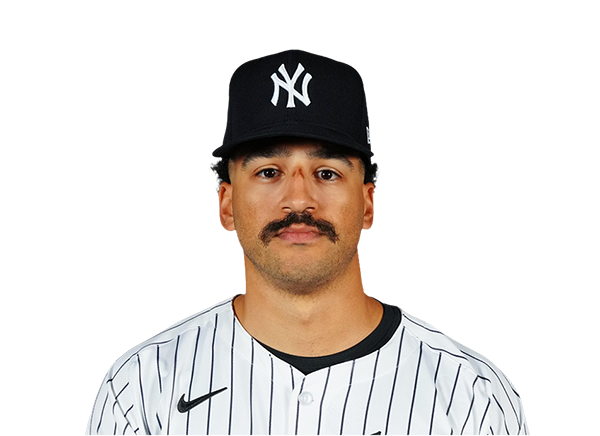 Trent Grisham |
2-3 | 3 | 1 | 2 | 0 | 0 | 1 | 0 | 11 | .500 | .600 | .500 |
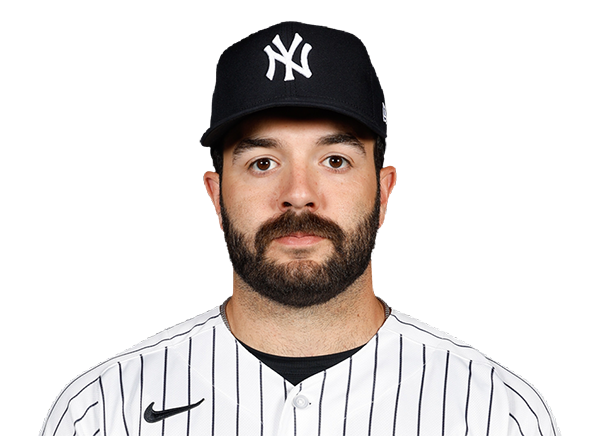 Austin Wells |
1-3 | 3 | 1 | 1 | 2 | 0 | 0 | 0 | 13 | .500 | .375 | .500 |
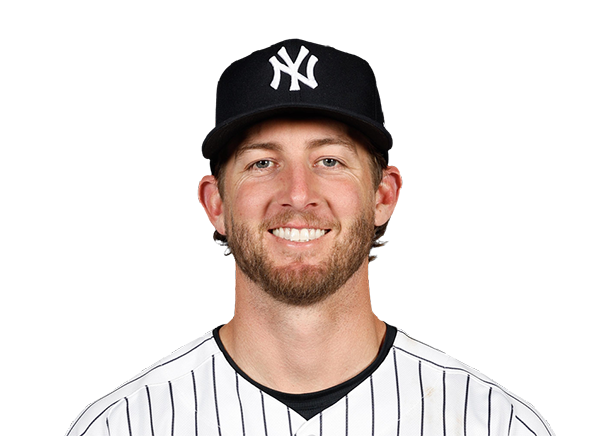 Ryan McMahon |
1-3 | 3 | 0 | 1 | 1 | 0 | 0 | 1 | 9 | .250 | .400 | .250 |
 Paul Goldschmidt |
0-1 | 1 | 0 | 0 | 0 | 0 | 0 | 0 | 2 | .000 | .333 | .000 |
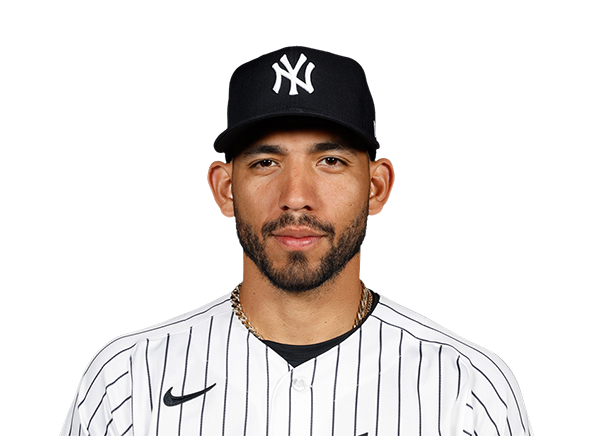 Jose Caballero |
0-0 | 0 | 0 | 0 | 0 | 0 | 0 | 0 | 0 | .000 | .000 | .000 |
Boston Red Sox
| Player | IP | H | R | ER | BB | K | HR | PC-ST | ERA | PC |
|---|---|---|---|---|---|---|---|---|---|---|
 Sonny Gray |
4.2 | 6 | 2 | 2 | 0 | 5 | 1 | 70-50 | 3.86 | 70 |
 Erik Miller |
0.1 | 2 | 0 | 0 | 0 | 0 | 0 | 5-4 | 13.50 | 5 |
 Garrett Crochet |
0.0 | 3 | 4 | 4 | 0 | 1 | 0 | 16-11 | INF | 16 |
 Garrett Whitlock |
1.1 | 3 | 3 | 3 | 3 | 1 | 1 | 35-22 | 20.25 | 35 |
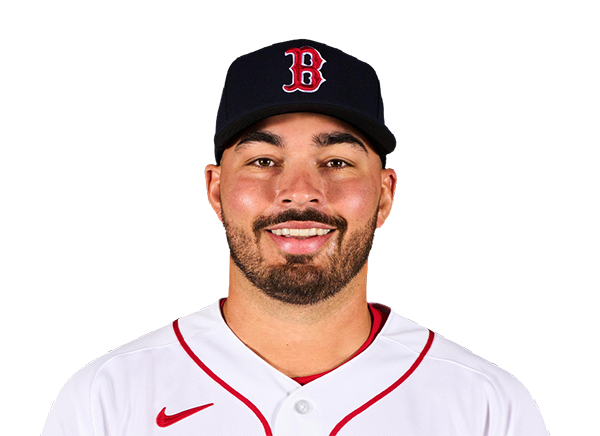 Alec Gamboa |
0.2 | 0 | 0 | 0 | 0 | 0 | 0 | 7-4 | 27.00 | 7 |
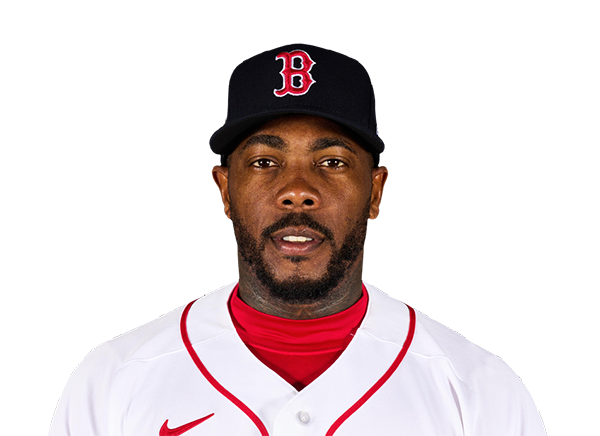 Aroldis Chapman |
1.0 | 0 | 0 | 0 | 0 | 3 | 0 | 14-10 | 0.00 | 14 |
New York Yankees
| Player | IP | H | R | ER | BB | K | HR | PC-ST | ERA | PC |
|---|---|---|---|---|---|---|---|---|---|---|
 Max Fried |
6.0 | 3 | 1 | 1 | 1 | 6 | 1 | 98-62 | 1.50 | 98 |
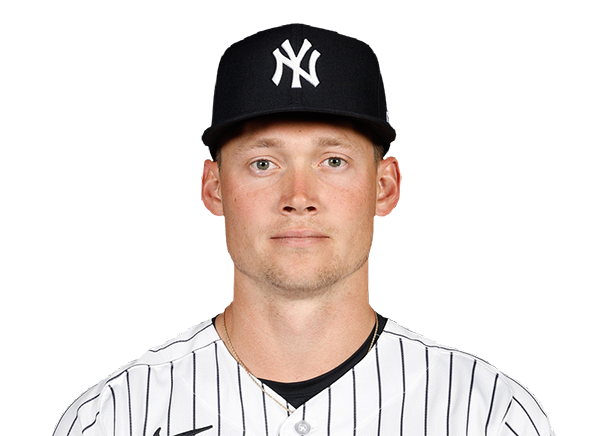 Will Warren |
1.2 | 1 | 1 | 1 | 0 | 1 | 1 | 19-14 | 5.40 | 19 |
 Brent Headrick |
0.1 | 0 | 0 | 0 | 0 | 0 | 0 | 3-2 | 0.00 | 3 |
 David Bednar |
1.0 | 0 | 0 | 0 | 1 | 1 | 0 | 22-13 | 0.00 | 22 |
H2H / Season Series
NYY9–2
BOS
NYY9–0
BOS
NYY16–1
BOS
NYY9–2
BOS
NYY0–6
BOS
NYY1–0
BOS
BOS5–4
NYY
BOS4–1
NYY
BOS6–1
NYY
BOS6–3
NYY
Last 5 Games
| Date | Opponent | Result |
|---|---|---|
| Sep 30 | @ NYY | L2–9 |
| Sep 29 | @ NYY | L0–9 |
| Date | Opponent | Result |
|---|---|---|
| Sep 30 | vs BOS | W9–2 |
| Sep 29 | vs BOS | W9–0 |
Standings
American League
| Team | W | L | PCT | GB | DIFF | STRK |
|---|---|---|---|---|---|---|
1 Rays | 98 | 64 | .605 | - | +86 | L1 |
2 Guardians | 85 | 77 | .525 | 13 | +11 | L1 |
3 Astros | 81 | 81 | .500 | 17 | -32 | W2 |
| 4Yankees | 93 | 68 | .578 | 4.5 | +138 | W1 |
| 5Red Sox | 87 | 75 | .537 | 11 | +78 | L1 |
6 White Sox | 84 | 78 | .519 | 14 | +56 | W1 |
7 Rangers | 80 | 82 | .494 | 18 | -46 | L1 |
8 Orioles | 79 | 82 | .491 | 18.5 | -21 | L1 |
9 Blue Jays | 79 | 83 | .488 | 19 | -46 | W1 |
10 Twins | 77 | 85 | .475 | 21 | -58 | W1 |
11 Tigers | 76 | 86 | .469 | 22 | +71 | L1 |
12 Mariners | 76 | 86 | .469 | 22 | -58 | W2 |
13 Royals | 69 | 93 | .426 | 29 | -120 | W1 |
14 Athletics | 64 | 98 | .395 | 34 | -238 | L2 |
15 Angels | 62 | 100 | .383 | 36 | -97 | L2 |
National League
| Team | W | L | PCT | GB | DIFF | STRK |
|---|---|---|---|---|---|---|
1 Brewers | 103 | 59 | .636 | - | +214 | W5 |
2 Dodgers | 100 | 62 | .617 | 3 | +201 | W3 |
3 Braves | 94 | 68 | .580 | 9 | +116 | L1 |
4 Padres | 91 | 71 | .562 | 12 | +41 | W2 |
5 Cubs | 89 | 73 | .549 | 14 | +147 | W1 |
6 Phillies | 88 | 74 | .543 | 15 | +15 | W1 |
7 Diamondbacks | 86 | 76 | .531 | 17 | +9 | L2 |
8 Pirates | 82 | 80 | .506 | 21 | +28 | W1 |
9 Marlins | 80 | 82 | .494 | 23 | +3 | W1 |
10 Cardinals | 77 | 85 | .475 | 26 | -29 | L4 |
11 Nationals | 77 | 85 | .475 | 26 | +6 | W1 |
12 Reds | 75 | 87 | .463 | 28 | -160 | L1 |
13 Mets | 74 | 88 | .457 | 29 | -32 | L1 |
14 Giants | 65 | 97 | .401 | 38 | -91 | L5 |
15 Rockies | 58 | 104 | .358 | 45 | -192 | L1 |
BOS
VS
NYY
Pitchers
Sonny Gray
Catchers
Adley Rutschman
Infielders
Willson Contreras
Caleb Durbin
Nick Sogard
Trevor Story
Outfielders
Wilyer Abreu
Ceddanne Rafaela
Nate Eaton
Designated Hitters
Jahmai Jones
Pitchers
Max Fried
Catchers
Austin Wells
Infielders
Luis Garcia Jr.
George Lombard Jr.
Jazz Chisholm Jr.
Ryan McMahon
Outfielders
Cody Bellinger
Spencer Jones
Trent Grisham
Designated Hitters
Ben Rice
Red Sox
VS
Yankees
Batting
2
Team Games Played
2
60
At Bats
68
7
Hits
26
2
Runs Batted In
17
2
Home Runs
4
0
Stolen Bases
4
.117
Batting Average
.382
2
Runs
18
2
Doubles
1
0
Triples
0
15
Total Bases
39
3
Walks
8
19
Strikeouts
14
.159
On Base Percentage
.436
.250
Slugging Percentage
.574
.409
OBP Pct + SLG Pct
1.009
2
Games Played
2
2
Games Started
2
0
Hit By Pitch
0
0.0
Wins Above Replacement
0.0
0.0
Offensive Wins Above Replacement
0.0
0
Caught Stealing
0
1
Is Qualified
1
1.0
Runs Created
16.7
0.5
Runs Created Per 27 Outs
9.6
.048
Walks Per Plate Appearance
.101
0.16
Walk To Strikeout Ratio
0.57
.133
Isolated Power
.191
.183
Secondary Average
.368
4.57
Pitches Per Plate Appearance
3.90
4
Extra Base Hits
5
63
Plate Appearances
79
30.0
At Bats Per Home Run
17.0
0
Sacrifice Hit
1
0
Sacrifice Flies
2
Pitching
2
Team Games Played
2
0
Quality Starts
2
0
Wins
2
2
Losses
0
0
Saves
0
0
Holds
1
26
Hits
7
18
Earned runs
2
4
Home Runs
2
8
Walks
3
14
Strikeouts
19
7.9
Strikeouts Per 9 Innings
9.5
154.0
Pitches Per Start
144.0
2.13
Walks Plus Hits Per Inning Pitched
0.56
10.13
Earned Run Average
1.00
2
Losses
0
16.0
Innings pitched
18.0
.000
Win Percentage
1.000
0
Save Opportunities
0
.382
Opponent Batting Average
.117
.436
Opponent's On-base pct.
.159
.574
Opponent's Slugging pct.
.250
1.009
Opponent's OPB Pct + SLG Pct
.409
68
At Bats
60
1
Doubles
2
0
Triples
0
0
Batters Hit
0
4
Stolen Bases
0
2
Games Played
2
0
Complete Games
0
0
Shutouts
1
1
Wild Pitches
0
17
Runs Batted In
2
0
Balks
0
16.0
Innings pitched
18.0
7.9
Strikeouts Per 9 Innings
9.5
0
Caught Stealing
0
2
Games Started
2
0.0
Wins Above Replacement
0.0
1
Is Qualified
1
18
Runs
2
18
Earned Runs
2
39
Total Bases
15
Fielding
2
Team Games Played
2
144
Full Innings
162
62
Total Chances
67
48
Putouts
54
13
Assists
13
1
Errors
0
7
Double Plays
3
0.984
Fielding Percentage
1.000
3.8
Range Factor
3.7
0.0
Zone Rating
0.0
2
Games Played
2
0
Games Started
0
0.0
Defensive Wins Above Replacement
0.0
1
Qualified
1