

Reds vs Blue Jays Live Score (25 Sep, 2026)
Game Information
Stage
STD
Season
2026
First Pitch
Fri, Sep 25, 7:07 pm
Venue
Rogers Centre
Location
Toronto, Ontario
Venue Type
Indoor
Broadcast
MLB.TV
Attendance
42,535
Live Situation
0Balls
3Strikes
0Outs
—Pitcher
—At Bat
Pitch Sequence
1
STRIKE FOUL
Four-seam FB
100 MPH
2
STRIKE SWINGING
Slider
93 MPH
3
STRIKE SWINGING
Four-seam FB
100 MPH
Injury Report

Team Stats
 CIN
TOR


5
Runs
6
12
Hits
10
1
Errors
0
1
Home Runs
0
1
Walks
5
11
Strikeouts
6
Player Box Score
Cincinnati Reds
| Player | H-AB | AB | R | H | RBI | HR | BB | K | #P | AVG | OBP | SLG |
|---|---|---|---|---|---|---|---|---|---|---|---|---|
 Carlos Jorge | 2-5 | 5 | 1 | 2 | 0 | 0 | 0 | 1 | 12 | .179 | .220 | .308 |
 Elly De La Cruz | 1-4 | 4 | 1 | 1 | 2 | 0 | 1 | 1 | 24 | .285 | .367 | .521 |
 Sal Stewart | 1-5 | 5 | 1 | 1 | 1 | 0 | 0 | 3 | 16 | .265 | .333 | .463 |
 JJ Bleday | 0-4 | 4 | 0 | 0 | 0 | 0 | 0 | 2 | 17 | .214 | .321 | .407 |
 Eugenio Suarez | 2-4 | 4 | 1 | 2 | 1 | 1 | 0 | 1 | 17 | .212 | .308 | .433 |
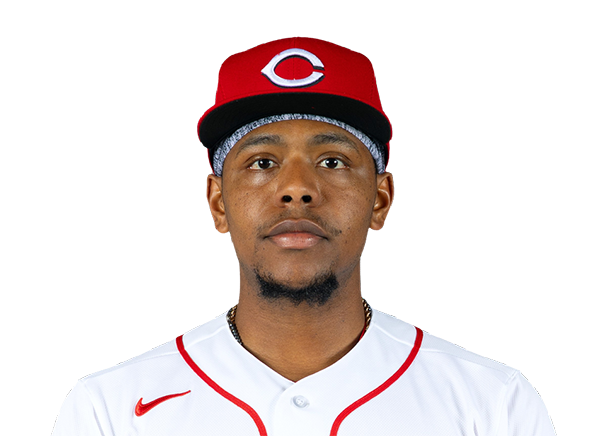 Ke'Bryan Hayes | 0-0 | 0 | 0 | 0 | 0 | 0 | 0 | 0 | 0 | .141 | .194 | .225 |
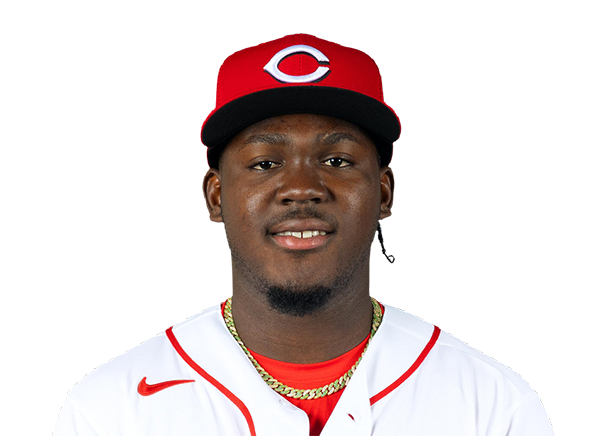 Hector Rodriguez | 2-4 | 4 | 0 | 2 | 1 | 0 | 0 | 1 | 16 | .228 | .271 | .404 |
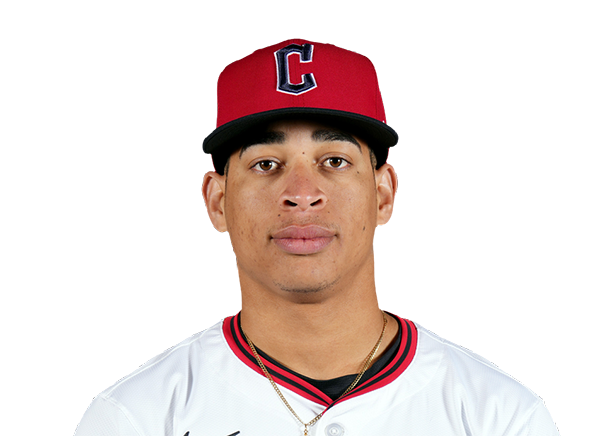 Juan Brito | 2-4 | 4 | 0 | 2 | 0 | 0 | 0 | 1 | 14 | .263 | .308 | .414 |
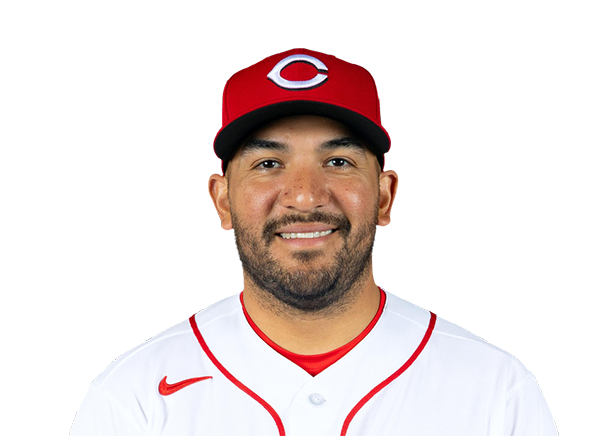 Jose Trevino | 1-4 | 4 | 0 | 1 | 0 | 0 | 0 | 0 | 12 | .217 | .221 | .336 |
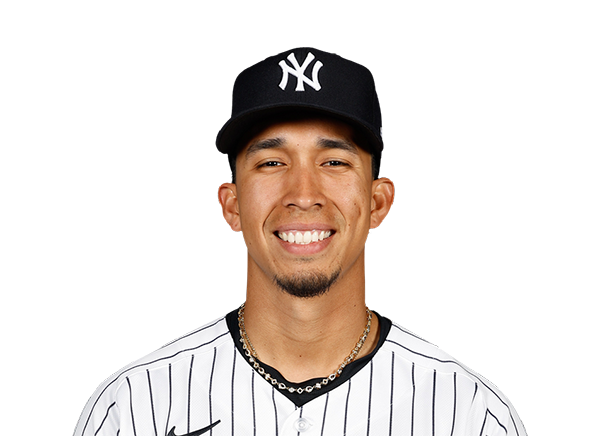 Oswaldo Cabrera | 1-4 | 4 | 1 | 1 | 0 | 0 | 0 | 1 | 13 | .100 | .100 | .150 |
Toronto Blue Jays
| Player | H-AB | AB | R | H | RBI | HR | BB | K | #P | AVG | OBP | SLG |
|---|---|---|---|---|---|---|---|---|---|---|---|---|
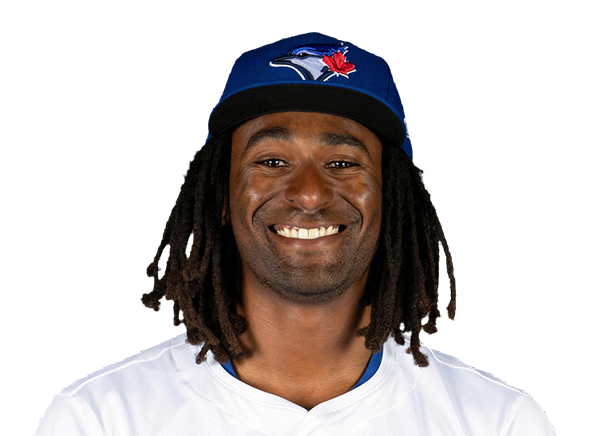 Charles McAdoo | 2-3 | 3 | 1 | 2 | 0 | 0 | 0 | 1 | 15 | .255 | .304 | .362 |
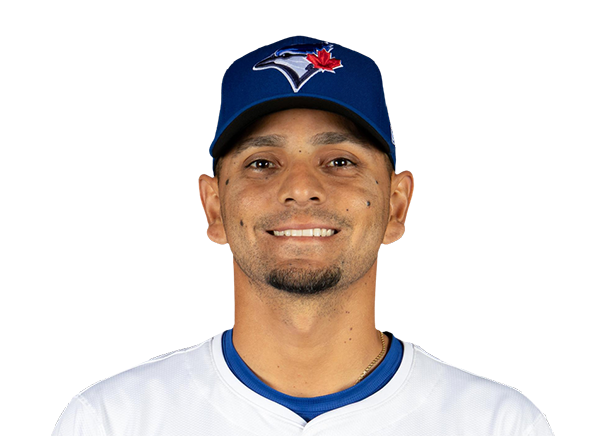 Andres Gimenez | 0-1 | 1 | 1 | 0 | 0 | 0 | 1 | 1 | 8 | .244 | .290 | .361 |
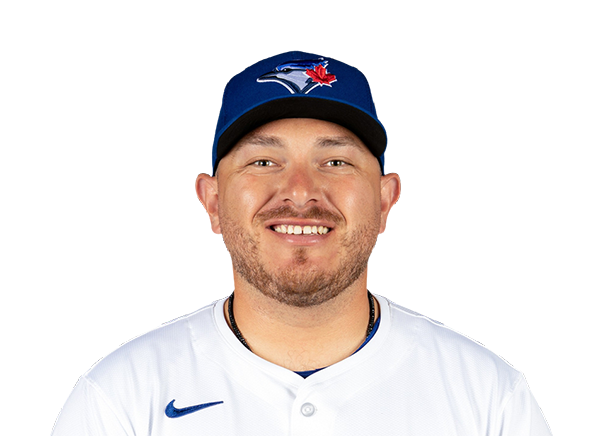 Alejandro Kirk | 1-3 | 3 | 2 | 1 | 1 | 0 | 2 | 0 | 24 | .282 | .356 | .421 |
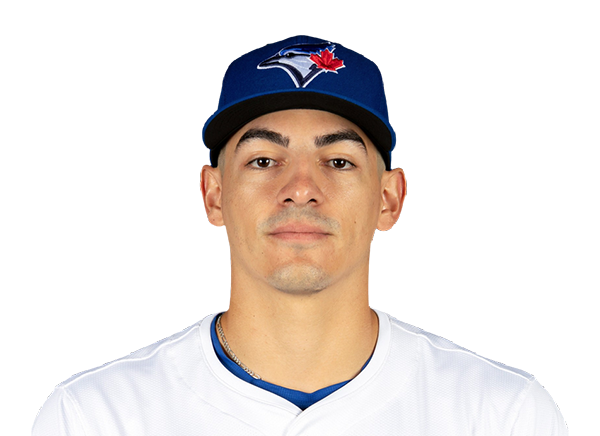 Brandon Valenzuela | 0-0 | 0 | 0 | 0 | 0 | 0 | 0 | 0 | 0 | .224 | .307 | .363 |
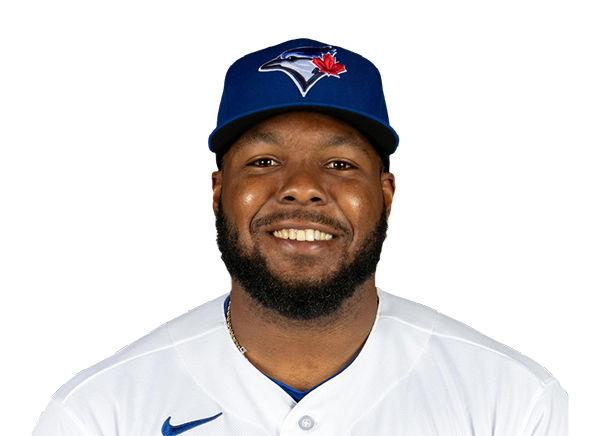 Vladimir Guerrero Jr. | 1-5 | 5 | 1 | 1 | 1 | 0 | 0 | 1 | 15 | .262 | .334 | .359 |
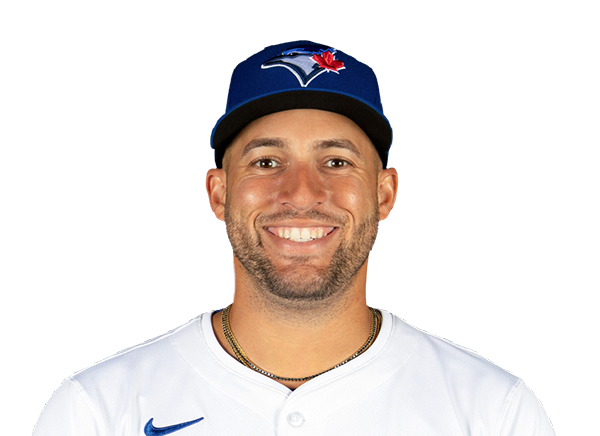 George Springer | 0-5 | 5 | 1 | 0 | 0 | 0 | 0 | 1 | 17 | .248 | .320 | .402 |
 Kazuma Okamoto | 2-3 | 3 | 0 | 2 | 3 | 0 | 1 | 0 | 15 | .234 | .310 | .456 |
 Nathan Lukes | 2-3 | 3 | 0 | 2 | 1 | 0 | 0 | 0 | 16 | .279 | .328 | .390 |
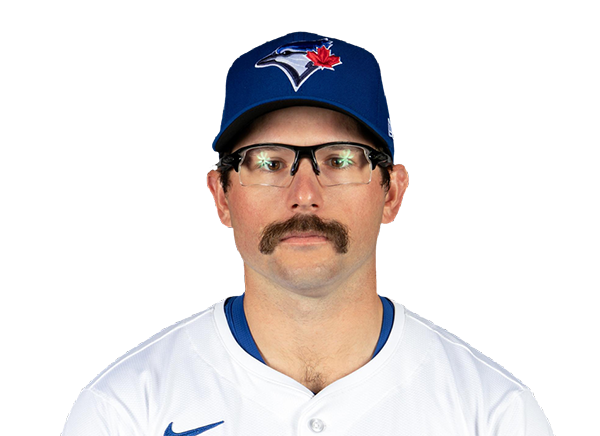 Davis Schneider | 0-1 | 1 | 0 | 0 | 0 | 0 | 1 | 1 | 15 | .149 | .311 | .322 |
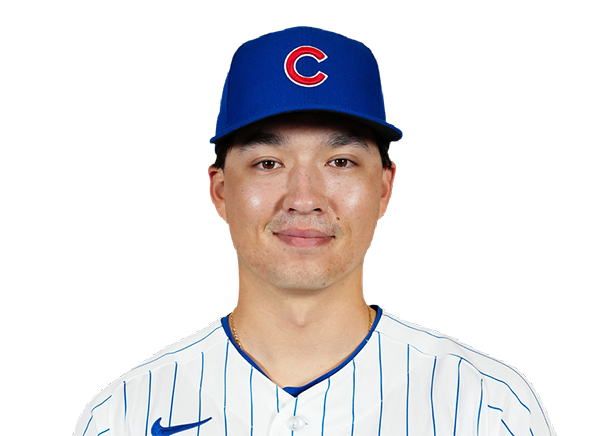 Brett Bateman | 0-1 | 1 | 0 | 0 | 0 | 0 | 0 | 0 | 4 | .318 | .392 | .411 |
 Ernie Clement | 0-4 | 4 | 0 | 0 | 0 | 0 | 0 | 0 | 8 | .262 | .288 | .368 |
 Myles Straw | 2-2 | 2 | 0 | 2 | 0 | 0 | 0 | 0 | 7 | .243 | .307 | .346 |
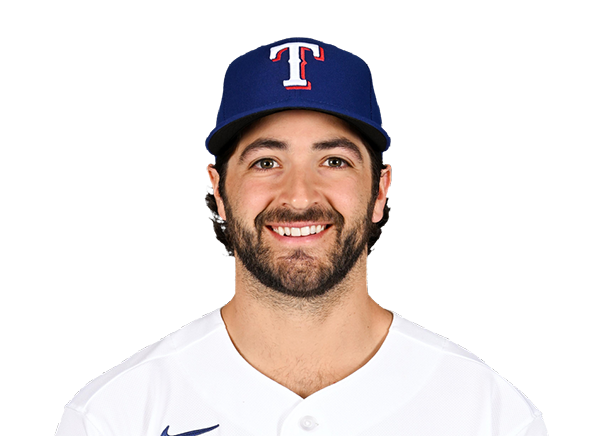 Josh Smith | 0-2 | 2 | 0 | 0 | 0 | 0 | 0 | 1 | 10 | .203 | .292 | .319 |
Cincinnati Reds
| Player | IP | H | R | ER | BB | K | HR | PC-ST | ERA | PC |
|---|---|---|---|---|---|---|---|---|---|---|
 Nick Lodolo | 5.0 | 7 | 2 | 2 | 2 | 3 | 0 | 92-54 | 4.97 | 92 |
 Luis Mey | 1.0 | 1 | 4 | 3 | 2 | 1 | 0 | 27-13 | 6.42 | 27 |
 Pierce Johnson | 1.0 | 2 | 0 | 0 | 0 | 1 | 0 | 19-13 | 4.62 | 19 |
 Graham Ashcraft | 1.0 | 0 | 0 | 0 | 1 | 1 | 0 | 16-11 | 4.19 | 16 |
Toronto Blue Jays
| Player | IP | H | R | ER | BB | K | HR | PC-ST | ERA | PC |
|---|---|---|---|---|---|---|---|---|---|---|
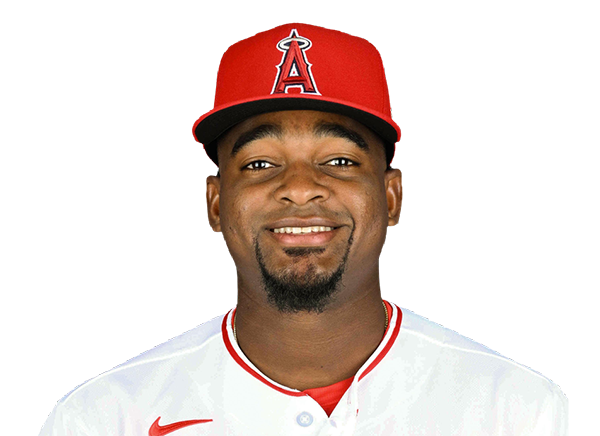 Jose Soriano | 3.0 | 8 | 5 | 5 | 0 | 2 | 1 | 48-36 | 3.91 | 48 |
|
Brendan Cellucci | 2.0 | 1 | 0 | 0 | 0 | 3 | 0 | 25-18 | 0.00 | 25 |
|
Chad Dallas | 1.1 | 2 | 0 | 0 | 1 | 3 | 0 | 33-19 | 5.02 | 33 |
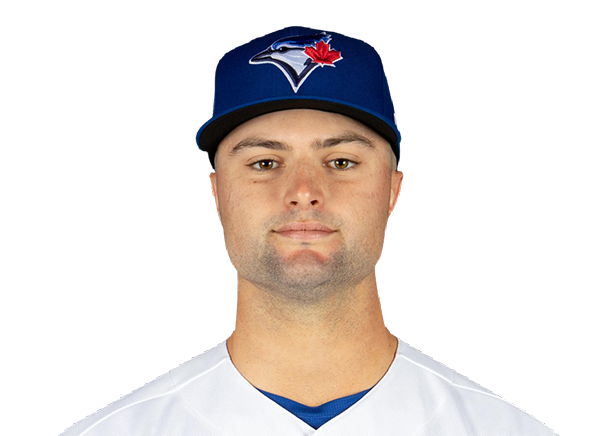 Mason Fluharty | 0.2 | 0 | 0 | 0 | 0 | 0 | 0 | 11-6 | 3.36 | 11 |
 Tyler Rogers | 1.0 | 1 | 0 | 0 | 0 | 1 | 0 | 13-11 | 1.77 | 13 |
 Louis Varland | 1.0 | 0 | 0 | 0 | 0 | 2 | 0 | 11-9 | 1.27 | 11 |
H2H / Season Series
TOR6–5
CIN
Last 5 Games
| Date | Opponent | Result |
|---|---|---|
| Sep 25 | @ TOR | L5–6 |
| Sep 24 |  @ ATL | W7–6 |
| Sep 23 | @ ATL | L2–3 |
| Sep 22 | @ ATL | W4–0 |
| Sep 20 |  vs CHC | L1–9 |
| Date | Opponent | Result |
|---|---|---|
| Sep 25 | vs CIN | W6–5 |
| Sep 23 |  @ BAL | L2–4 |
| Sep 23 | @ BAL | L2–4 |
| Sep 22 | @ BAL | T0–0 |
| Sep 21 | @ BAL | L3–4 |
Standings
American League
| Team | W | L | PCT | GB | DIFF | STRK |
|---|---|---|---|---|---|---|
1 Rays | 97 | 63 | .606 | - | +79 | W1 |
2 Guardians | 84 | 76 | .525 | 13 | +6 | W2 |
3 Astros | 79 | 81 | .494 | 18 | -52 | L1 |
4 Yankees | 93 | 68 | .578 | 4.5 | +138 | W1 |
5 Red Sox | 87 | 74 | .540 | 10.5 | +82 | W2 |
6 White Sox | 83 | 77 | .519 | 14 | +57 | W2 |
7 Rangers | 79 | 81 | .494 | 18 | -48 | L1 |
| 8Orioles | 79 | 82 | .491 | 18.5 | -21 | L1 |
| 9Blue Jays | 78 | 82 | .488 | 19 | -46 | W1 |
10 Twins | 76 | 84 | .475 | 21 | -56 | W3 |
11 Tigers | 75 | 85 | .469 | 22 | +72 | W1 |
12 Mariners | 74 | 86 | .463 | 23 | -66 | L2 |
13 Royals | 68 | 92 | .425 | 29 | -115 | L2 |
14 Athletics | 64 | 96 | .400 | 33 | -218 | W1 |
15 Angels | 62 | 98 | .388 | 35 | -89 | W2 |
National League
| Team | W | L | PCT | GB | DIFF | STRK |
|---|---|---|---|---|---|---|
1 Brewers | 101 | 59 | .631 | - | +211 | W3 |
2 Dodgers | 98 | 62 | .613 | 3 | +196 | W1 |
| 3Braves | 93 | 67 | .581 | 8 | +113 | L2 |
4 Padres | 89 | 71 | .556 | 12 | +33 | L1 |
| 5Cubs | 88 | 73 | .547 | 13.5 | +143 | L2 |
6 Phillies | 87 | 73 | .544 | 14 | +22 | L3 |
7 Diamondbacks | 86 | 74 | .538 | 15 | +17 | W6 |
8 Pirates | 81 | 79 | .506 | 20 | +27 | L1 |
9 Marlins | 79 | 81 | .494 | 22 | +6 | W1 |
10 Cardinals | 77 | 83 | .481 | 24 | -26 | L2 |
11 Nationals | 76 | 84 | .475 | 25 | +10 | W3 |
| 12Reds | 74 | 86 | .463 | 27 | -160 | L1 |
13 Mets | 73 | 87 | .456 | 28 | -36 | L2 |
14 Giants | 65 | 95 | .406 | 36 | -86 | L3 |
15 Rockies | 57 | 103 | .356 | 44 | -193 | L5 |
CIN
VS
TOR
Pitchers
Nick Lodolo
Catchers
Jose Trevino
Infielders
Sal Stewart
Eugenio Suarez
Juan Brito
Oswaldo Cabrera
Outfielders
Carlos Jorge
JJ Bleday
Hector Rodriguez
Designated Hitters
Elly De La Cruz
Pitchers
Jose Soriano
Catchers
Alejandro Kirk
Infielders
Charles McAdoo
Vladimir Guerrero Jr.
Kazuma Okamoto
Ernie Clement
Outfielders
Nathan Lukes
Davis Schneider
Myles Straw
Designated Hitters
George Springer
Reds
VS
Blue Jays
Batting
160
Team Games Played
160
5318
At Bats
5389
1218
Hits
1337
630
Runs Batted In
610
212
Home Runs
150
110
Stolen Bases
75
.229
Batting Average
.248
660
Runs
642
216
Doubles
256
15
Triples
8
2100
Total Bases
2059
550
Walks
453
1525
Strikeouts
1135
.305
On Base Percentage
.311
.395
Slugging Percentage
.382
.700
OBP Pct + SLG Pct
.693
160
Games Played
160
160
Games Started
160
51
Hit By Pitch
59
0.0
Wins Above Replacement
0.0
0.0
Offensive Wins Above Replacement
0.0
37
Caught Stealing
17
1
Is Qualified
1
657.1
Runs Created
640.7
4.1
Runs Created Per 27 Outs
4.1
.092
Walks Per Plate Appearance
.076
0.36
Walk To Strikeout Ratio
0.40
.166
Isolated Power
.134
.283
Secondary Average
.229
3.95
Pitches Per Plate Appearance
3.81
443
Extra Base Hits
414
5976
Plate Appearances
5977
25.1
At Bats Per Home Run
35.9
15
Sacrifice Hit
24
39
Sacrifice Flies
49
Pitching
160
Team Games Played
160
48
Quality Starts
45
74
Wins
78
86
Losses
82
42
Saves
52
89
Holds
105
1391
Hits
1251
764
Earned runs
618
212
Home Runs
166
662
Walks
587
1279
Strikeouts
1391
8.1
Strikeouts Per 9 Innings
8.8
153.0
Pitches Per Start
148.4
1.45
Walks Plus Hits Per Inning Pitched
1.30
4.85
Earned Run Average
3.92
86
Losses
82
1416.1
Innings pitched
1418.0
.463
Win Percentage
.488
65
Save Opportunities
69
.255
Opponent Batting Average
.235
.342
Opponent's On-base pct.
.314
.429
Opponent's Slugging pct.
.372
.771
Opponent's OPB Pct + SLG Pct
.686
5449
At Bats
5318
252
Doubles
208
30
Triples
10
86
Batters Hit
44
144
Stolen Bases
143
160
Games Played
160
0
Complete Games
1
9
Shutouts
11
47
Wild Pitches
49
790
Runs Batted In
647
3
Balks
8
1416.1
Innings pitched
1418.0
8.1
Strikeouts Per 9 Innings
8.8
35
Caught Stealing
44
160
Games Started
160
0.0
Wins Above Replacement
0.0
1
Is Qualified
1
820
Runs
688
764
Earned Runs
618
2339
Total Bases
1977
Fielding
160
Team Games Played
160
1416
Full Innings
1418
5622
Total Chances
5695
4249
Putouts
4254
1284
Assists
1344
89
Errors
97
216
Double Plays
256
0.984
Fielding Percentage
0.983
35.2
Range Factor
35.5
0.0
Zone Rating
0.0
160
Games Played
160
0
Games Started
0
0.0
Defensive Wins Above Replacement
0.0
1
Qualified
1