

Reds vs Blue Jays Live Score (26 Sep, 2026)
Game Information
Stage
STD
Season
2026
First Pitch
Sat, Sep 26, 3:07 pm
Venue
Rogers Centre
Location
Toronto, Ontario
Venue Type
Indoor
Broadcast
MLB.TV
Attendance
42,482
Live Situation
0Balls
1Strikes
0Outs
—Pitcher
—At Bat
Pitch Sequence
1
STRIKE LOOKING
Cutter
91 MPH
2
BALL IN PLAY
Sinker
94 MPH
Injury Report
Team Stats
 CIN
TOR


5
Runs
1
6
Hits
5
0
Errors
2
1
Home Runs
0
6
Walks
3
12
Strikeouts
5
Player Box Score
Cincinnati Reds
| Player | H-AB | AB | R | H | RBI | HR | BB | K | #P | AVG | OBP | SLG |
|---|---|---|---|---|---|---|---|---|---|---|---|---|
 Carlos Jorge | 1-3 | 3 | 1 | 1 | 0 | 0 | 2 | 1 | 19 | .190 | .261 | .310 |
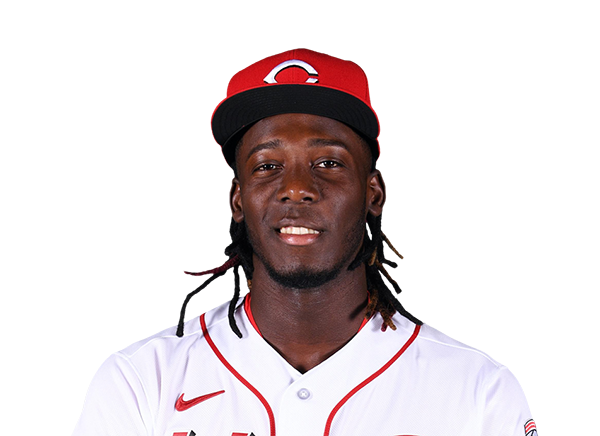 Elly De La Cruz | 0-4 | 4 | 0 | 0 | 0 | 0 | 1 | 1 | 12 | .283 | .366 | .517 |
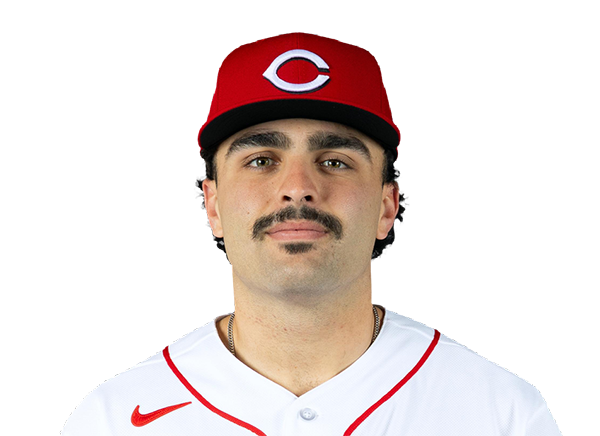 Sal Stewart | 1-5 | 5 | 0 | 1 | 0 | 0 | 0 | 1 | 14 | .265 | .332 | .460 |
 Eugenio Suarez | 1-4 | 4 | 0 | 1 | 1 | 0 | 0 | 3 | 16 | .212 | .307 | .433 |
 JJ Bleday | 1-3 | 3 | 2 | 1 | 1 | 1 | 1 | 2 | 22 | .214 | .322 | .413 |
 Tyler Stephenson | 0-4 | 4 | 1 | 0 | 0 | 0 | 0 | 2 | 18 | .241 | .323 | .404 |
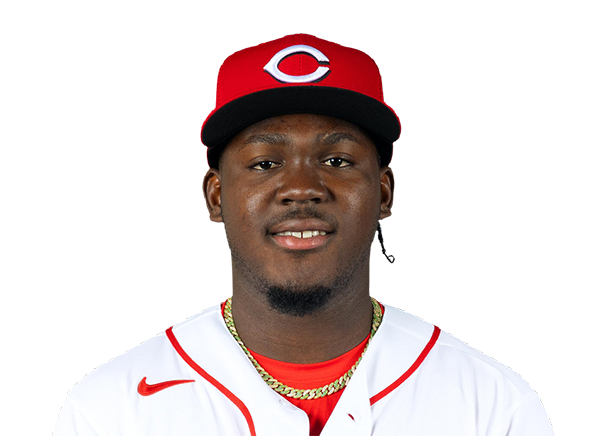 Hector Rodriguez | 2-4 | 4 | 0 | 2 | 2 | 0 | 0 | 0 | 9 | .236 | .277 | .421 |
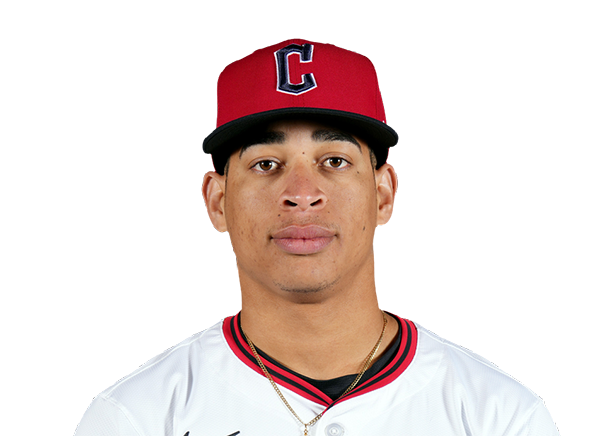 Juan Brito | 0-3 | 3 | 0 | 0 | 0 | 0 | 1 | 1 | 18 | .255 | .306 | .402 |
 Ke'Bryan Hayes | 0-0 | 0 | 0 | 0 | 0 | 0 | 0 | 0 | 0 | .141 | .194 | .225 |
 Matt McLain | 0-3 | 3 | 1 | 0 | 0 | 0 | 1 | 1 | 22 | .187 | .276 | .336 |
Toronto Blue Jays
| Player | H-AB | AB | R | H | RBI | HR | BB | K | #P | AVG | OBP | SLG |
|---|---|---|---|---|---|---|---|---|---|---|---|---|
 Brett Bateman | 2-3 | 3 | 0 | 2 | 0 | 0 | 1 | 0 | 14 | .325 | .400 | .422 |
 Nathan Lukes | 0-3 | 3 | 0 | 0 | 0 | 0 | 1 | 0 | 9 | .277 | .327 | .387 |
 Vladimir Guerrero Jr. | 0-4 | 4 | 0 | 0 | 0 | 0 | 0 | 2 | 8 | .260 | .332 | .356 |
 Alejandro Kirk | 0-4 | 4 | 0 | 0 | 0 | 0 | 0 | 0 | 12 | .278 | .351 | .415 |
 Kazuma Okamoto | 0-3 | 3 | 1 | 0 | 0 | 0 | 1 | 1 | 24 | .233 | .310 | .454 |
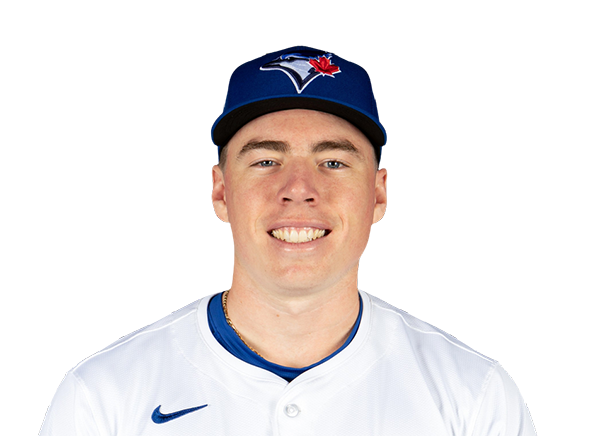 Sean Keys | 1-4 | 4 | 0 | 1 | 0 | 0 | 0 | 1 | 17 | .203 | .250 | .339 |
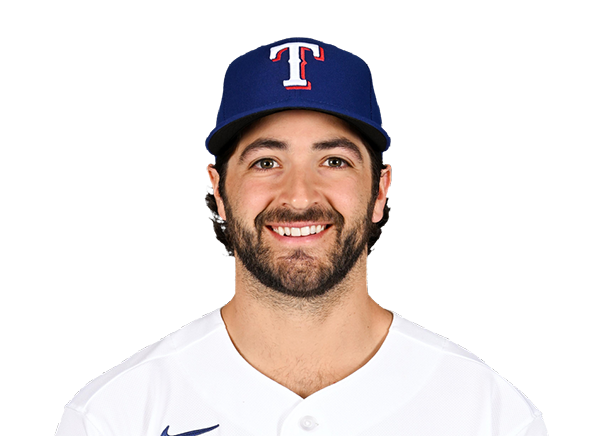 Josh Smith | 1-4 | 4 | 0 | 1 | 0 | 0 | 0 | 0 | 15 | .204 | .292 | .322 |
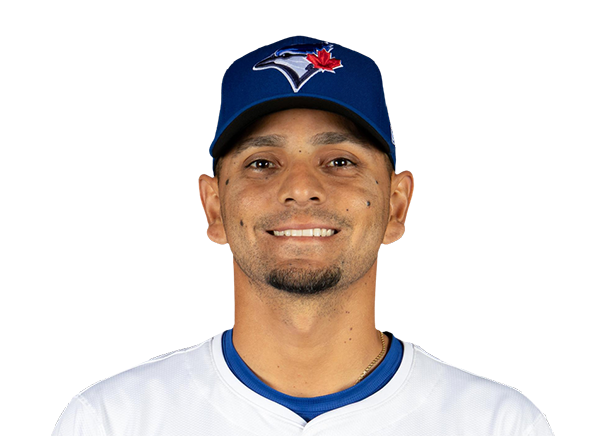 Andres Gimenez | 1-3 | 3 | 0 | 1 | 1 | 0 | 0 | 0 | 10 | .245 | .290 | .361 |
 Ernie Clement | 0-3 | 3 | 0 | 0 | 0 | 0 | 0 | 1 | 12 | .261 | .286 | .366 |
Cincinnati Reds
| Player | IP | H | R | ER | BB | K | HR | PC-ST | ERA | PC |
|---|---|---|---|---|---|---|---|---|---|---|
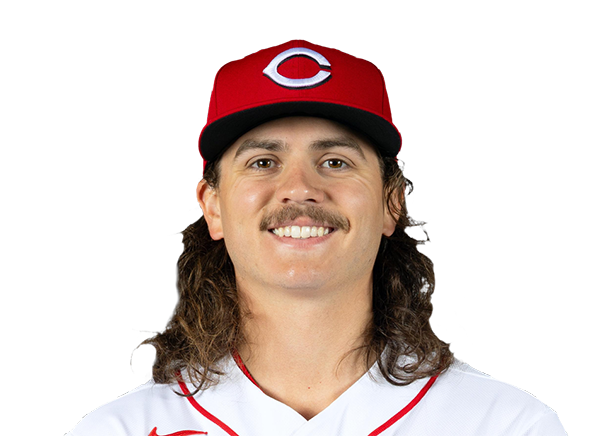 Rhett Lowder | 6.0 | 3 | 0 | 0 | 2 | 2 | 0 | 79-50 | 5.74 | 79 |
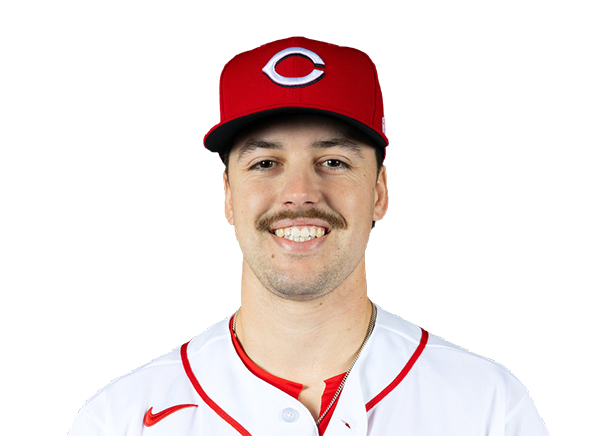 Connor Phillips | 1.0 | 1 | 1 | 1 | 1 | 1 | 0 | 21-11 | 5.40 | 21 |
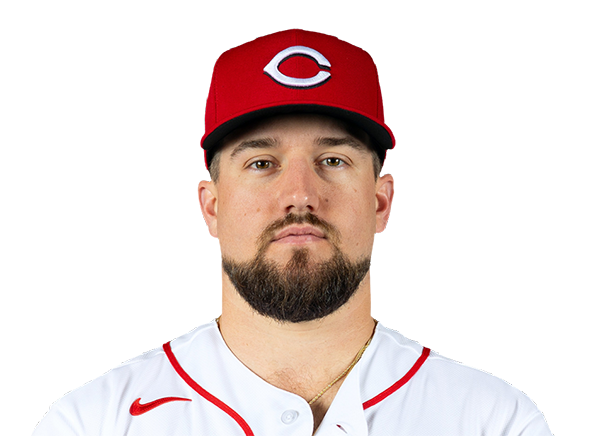 Graham Ashcraft | 1.0 | 1 | 0 | 0 | 0 | 1 | 0 | 11-9 | 4.08 | 11 |
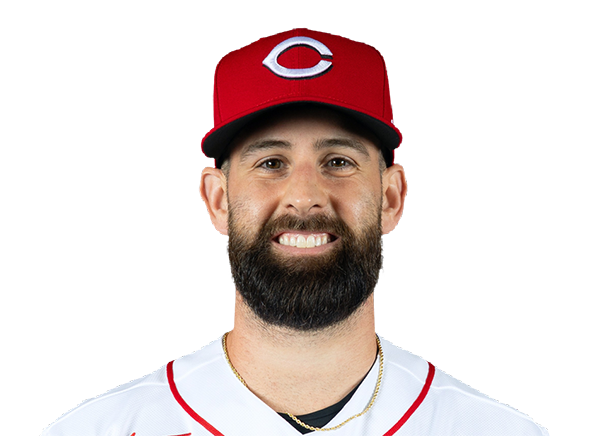 Tejay Antone | 1.0 | 0 | 0 | 0 | 0 | 1 | 0 | 10-7 | 3.11 | 10 |
Toronto Blue Jays
| Player | IP | H | R | ER | BB | K | HR | PC-ST | ERA | PC |
|---|---|---|---|---|---|---|---|---|---|---|
 Trey Yesavage | 2.0 | 2 | 1 | 1 | 1 | 3 | 1 | 30-19 | 3.69 | 30 |
 Spencer Miles | 1.0 | 2 | 2 | 1 | 1 | 2 | 0 | 28-17 | 2.63 | 28 |
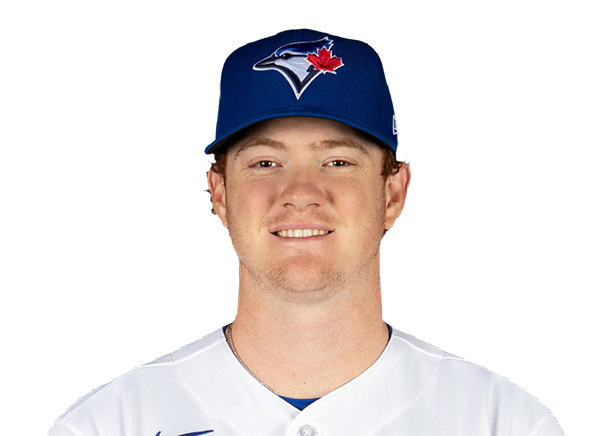 Braydon Fisher | 1.0 | 0 | 0 | 0 | 2 | 1 | 0 | 19-7 | 3.21 | 19 |
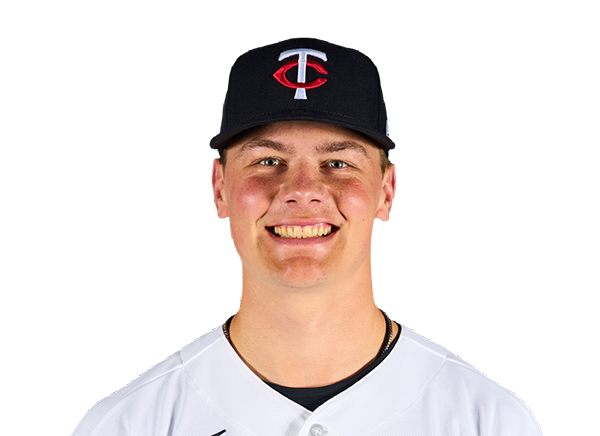 John Klein | 4.0 | 2 | 2 | 0 | 2 | 5 | 0 | 66-43 | 2.16 | 66 |
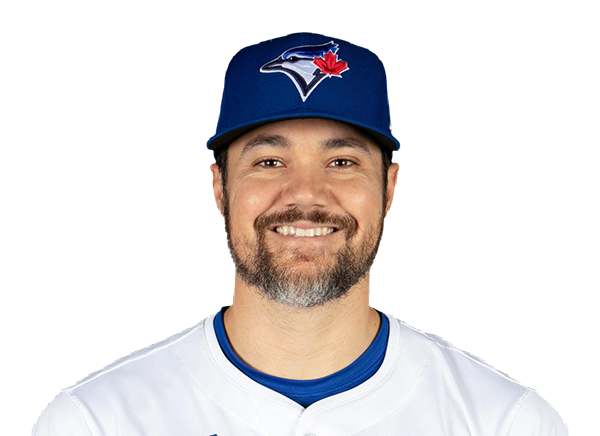 Brendon Little | 1.0 | 0 | 0 | 0 | 0 | 1 | 0 | 7-5 | 6.35 | 7 |
H2H / Season Series
TOR1–5
CIN
TOR6–5
CIN
Last 5 Games
| Date | Opponent | Result |
|---|---|---|
| Sep 26 | @ TOR | W5–1 |
| Sep 25 | @ TOR | L5–6 |
| Sep 24 |  @ ATL | W7–6 |
| Sep 23 | @ ATL | L2–3 |
| Sep 22 | @ ATL | W4–0 |
| Date | Opponent | Result |
|---|---|---|
| Sep 26 | vs CIN | L1–5 |
| Sep 25 | vs CIN | W6–5 |
| Sep 23 |  @ BAL | L2–4 |
| Sep 23 | @ BAL | L2–4 |
| Sep 22 | @ BAL | T0–0 |
Standings
American League
| Team | W | L | PCT | GB | DIFF | STRK |
|---|---|---|---|---|---|---|
1 Rays | 98 | 63 | .609 | - | +90 | W2 |
2 Guardians | 85 | 76 | .528 | 13 | +12 | W3 |
3 Astros | 80 | 81 | .497 | 18 | -41 | W1 |
4 Yankees | 93 | 68 | .578 | 5 | +138 | W1 |
5 Red Sox | 87 | 74 | .540 | 11 | +82 | W2 |
6 White Sox | 83 | 78 | .516 | 15 | +54 | L1 |
7 Rangers | 80 | 81 | .497 | 18 | -44 | W1 |
| 8Orioles | 79 | 82 | .491 | 19 | -21 | L1 |
| 9Blue Jays | 78 | 83 | .484 | 20 | -50 | L1 |
10 Twins | 76 | 85 | .472 | 22 | -60 | L1 |
11 Tigers | 76 | 85 | .472 | 22 | +73 | W2 |
12 Mariners | 75 | 86 | .466 | 23 | -62 | W1 |
13 Royals | 68 | 93 | .422 | 30 | -121 | L3 |
14 Athletics | 64 | 97 | .398 | 34 | -229 | L1 |
15 Angels | 62 | 99 | .385 | 36 | -93 | L1 |
National League
| Team | W | L | PCT | GB | DIFF | STRK |
|---|---|---|---|---|---|---|
1 Brewers | 102 | 59 | .634 | - | +212 | W4 |
2 Dodgers | 99 | 62 | .615 | 3 | +197 | W2 |
| 3Braves | 94 | 67 | .584 | 8 | +118 | W1 |
4 Padres | 90 | 71 | .559 | 12 | +36 | W1 |
5 Cubs | 88 | 73 | .547 | 14 | +143 | L2 |
6 Phillies | 87 | 74 | .540 | 15 | +11 | L4 |
7 Diamondbacks | 86 | 75 | .534 | 16 | +14 | L1 |
8 Pirates | 81 | 80 | .503 | 21 | +26 | L2 |
9 Marlins | 79 | 82 | .491 | 23 | +1 | L1 |
10 Cardinals | 77 | 84 | .478 | 25 | -27 | L3 |
11 Nationals | 76 | 85 | .472 | 26 | +4 | L1 |
| 12Reds | 75 | 86 | .466 | 27 | -156 | W1 |
13 Mets | 74 | 87 | .460 | 28 | -30 | W1 |
14 Giants | 65 | 96 | .404 | 37 | -87 | L4 |
15 Rockies | 58 | 103 | .360 | 44 | -190 | W1 |
CIN
VS
TOR
Pitchers
Rhett Lowder
Catchers
Tyler Stephenson
Infielders
Elly De La Cruz
Sal Stewart
Juan Brito
Matt McLain
Outfielders
Carlos Jorge
JJ Bleday
Hector Rodriguez
Designated Hitters
Eugenio Suarez
Pitchers
Trey Yesavage
Catchers
Alejandro Kirk
Infielders
Kazuma Okamoto
Sean Keys
Andres Gimenez
Ernie Clement
Outfielders
Brett Bateman
Nathan Lukes
Josh Smith
Designated Hitters
Vladimir Guerrero Jr.
Reds
VS
Blue Jays
Batting
161
Team Games Played
161
5351
At Bats
5420
1224
Hits
1342
634
Runs Batted In
611
213
Home Runs
150
112
Stolen Bases
75
.229
Batting Average
.248
665
Runs
643
217
Doubles
258
16
Triples
8
2112
Total Bases
2066
556
Walks
456
1537
Strikeouts
1140
.305
On Base Percentage
.310
.395
Slugging Percentage
.381
.700
OBP Pct + SLG Pct
.692
161
Games Played
161
161
Games Started
161
51
Hit By Pitch
59
0.0
Wins Above Replacement
0.0
0.0
Offensive Wins Above Replacement
0.0
39
Caught Stealing
17
1
Is Qualified
1
660.9
Runs Created
641.8
4.1
Runs Created Per 27 Outs
4.0
.092
Walks Per Plate Appearance
.076
0.36
Walk To Strikeout Ratio
0.40
.166
Isolated Power
.134
.283
Secondary Average
.228
3.95
Pitches Per Plate Appearance
3.81
446
Extra Base Hits
416
6015
Plate Appearances
6011
25.1
At Bats Per Home Run
36.1
15
Sacrifice Hit
24
39
Sacrifice Flies
49
Pitching
161
Team Games Played
161
49
Quality Starts
45
75
Wins
78
86
Losses
83
42
Saves
52
89
Holds
105
1396
Hits
1257
765
Earned runs
620
212
Home Runs
167
665
Walks
593
1284
Strikeouts
1403
8.1
Strikeouts Per 9 Innings
8.8
152.8
Pitches Per Start
148.4
1.45
Walks Plus Hits Per Inning Pitched
1.30
4.83
Earned Run Average
3.91
86
Losses
83
1425.1
Innings pitched
1427.0
.466
Win Percentage
.484
65
Save Opportunities
69
.255
Opponent Batting Average
.235
.342
Opponent's On-base pct.
.314
.428
Opponent's Slugging pct.
.372
.770
Opponent's OPB Pct + SLG Pct
.686
5480
At Bats
5351
254
Doubles
209
30
Triples
11
86
Batters Hit
44
144
Stolen Bases
145
161
Games Played
161
0
Complete Games
1
9
Shutouts
11
48
Wild Pitches
49
791
Runs Batted In
651
3
Balks
8
1425.1
Innings pitched
1427.0
8.1
Strikeouts Per 9 Innings
8.8
35
Caught Stealing
46
161
Games Started
161
0.0
Wins Above Replacement
0.0
1
Is Qualified
1
821
Runs
693
765
Earned Runs
620
2346
Total Bases
1989
Fielding
161
Team Games Played
161
1425
Full Innings
1427
5660
Total Chances
5731
4276
Putouts
4281
1295
Assists
1351
89
Errors
99
217
Double Plays
258
0.984
Fielding Percentage
0.983
35.2
Range Factor
35.5
0.0
Zone Rating
0.0
161
Games Played
161
0
Games Started
0
0.0
Defensive Wins Above Replacement
0.0
1
Qualified
1