

Reds vs Blue Jays Live Score (27 Sep, 2026)
Game Information
Stage
STD
Season
2026
First Pitch
Sun, Sep 27, 3:07 pm
Venue
Rogers Centre
Location
Toronto, Ontario
Venue Type
Indoor
Broadcast
MLB.TV
Attendance
42,131
Live Situation
2Balls
2Strikes
0Outs
—Pitcher
—At Bat
Pitch Sequence
1
BALL
Four-seam FB
92 MPH
2
STRIKE LOOKING
Sweeper
82 MPH
3
STRIKE SWINGING
Four-seam FB
92 MPH
4
STRIKE FOUL
Sweeper
83 MPH
5
STRIKE FOUL
Four-seam FB
93 MPH
6
STRIKE FOUL
Sweeper
83 MPH
7
BALL
Four-seam FB
91 MPH
8
STRIKE FOUL
Four-seam FB
92 MPH
9
BALL IN PLAY
Sweeper
84 MPH
Injury Report
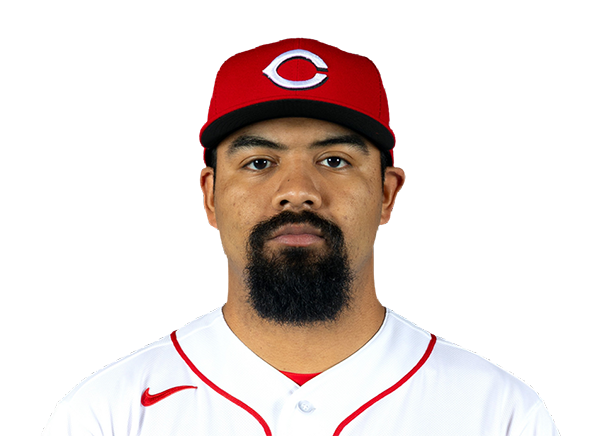
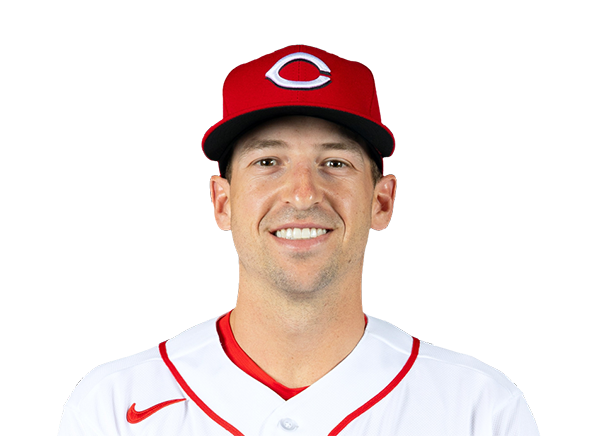
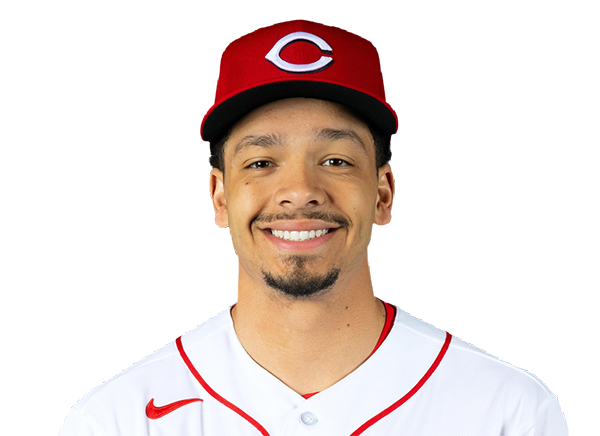
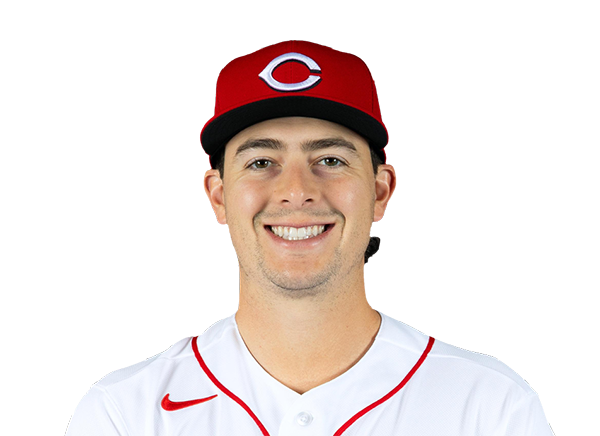
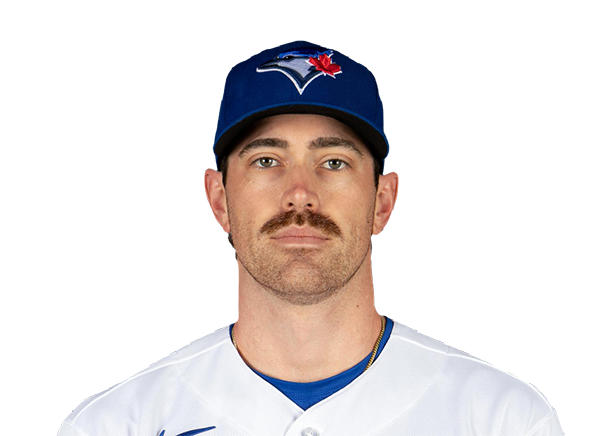
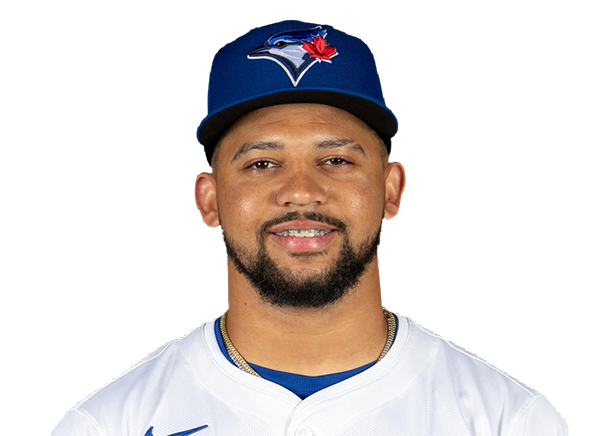
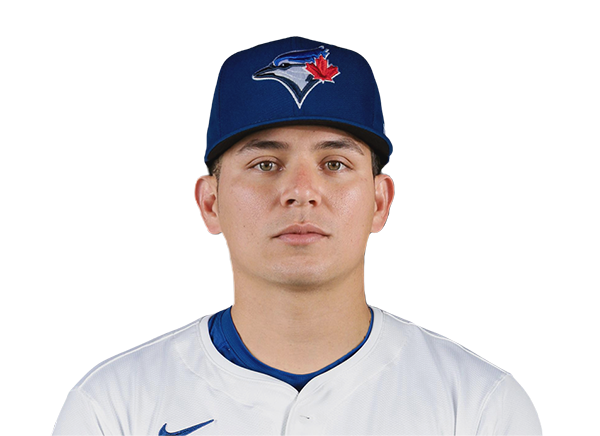
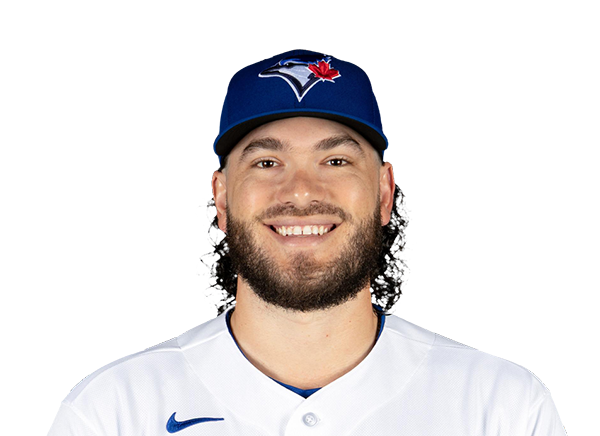
Team Stats
 CIN
TOR


1
Runs
5
7
Hits
5
0
Errors
0
0
Home Runs
2
1
Walks
3
7
Strikeouts
9
Player Box Score
Cincinnati Reds
| Player | H-AB | AB | R | H | RBI | HR | BB | K | #P | AVG | OBP | SLG |
|---|---|---|---|---|---|---|---|---|---|---|---|---|
 Carlos Jorge | 2-4 | 4 | 0 | 2 | 1 | 0 | 0 | 0 | 10 | .217 | .280 | .326 |
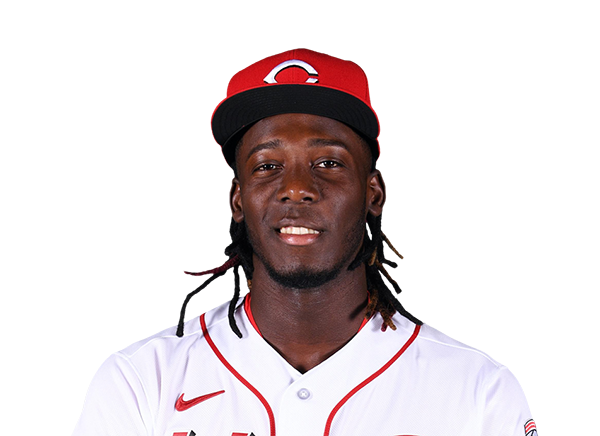 Elly De La Cruz | 1-4 | 4 | 0 | 1 | 0 | 0 | 0 | 2 | 23 | .283 | .365 | .515 |
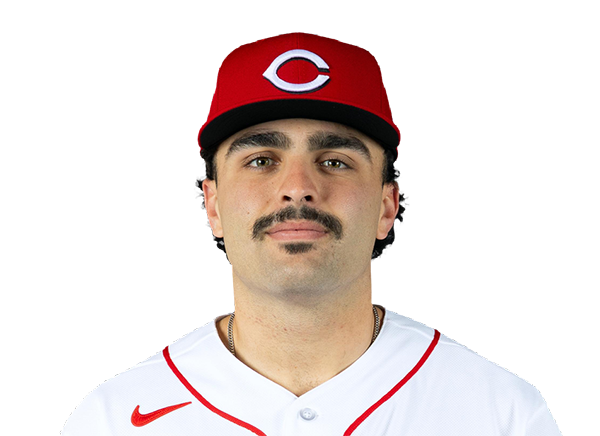 Sal Stewart | 0-4 | 4 | 0 | 0 | 0 | 0 | 0 | 0 | 17 | .263 | .330 | .457 |
 JJ Bleday | 2-4 | 4 | 0 | 2 | 0 | 0 | 0 | 1 | 17 | .217 | .324 | .416 |
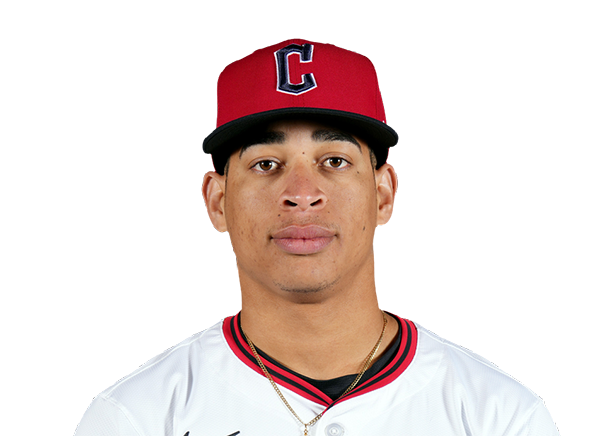 Juan Brito | 0-4 | 4 | 0 | 0 | 0 | 0 | 0 | 1 | 16 | .245 | .296 | .387 |
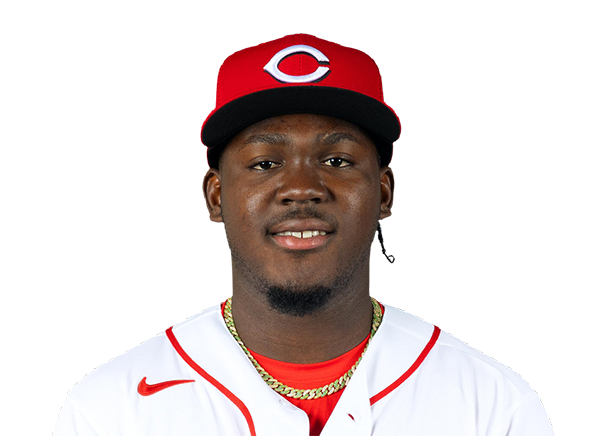 Hector Rodriguez | 0-4 | 4 | 0 | 0 | 0 | 0 | 0 | 0 | 21 | .229 | .270 | .410 |
 Matt McLain | 0-3 | 3 | 0 | 0 | 0 | 0 | 0 | 1 | 11 | .185 | .274 | .334 |
 Will Banfield | 0-3 | 3 | 0 | 0 | 0 | 0 | 0 | 2 | 18 | .150 | .143 | .200 |
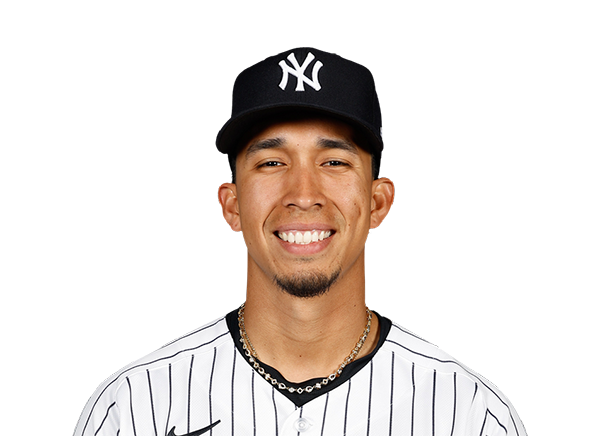 Oswaldo Cabrera | 2-2 | 2 | 1 | 2 | 0 | 0 | 1 | 0 | 8 | .182 | .217 | .273 |
Toronto Blue Jays
| Player | H-AB | AB | R | H | RBI | HR | BB | K | #P | AVG | OBP | SLG |
|---|---|---|---|---|---|---|---|---|---|---|---|---|
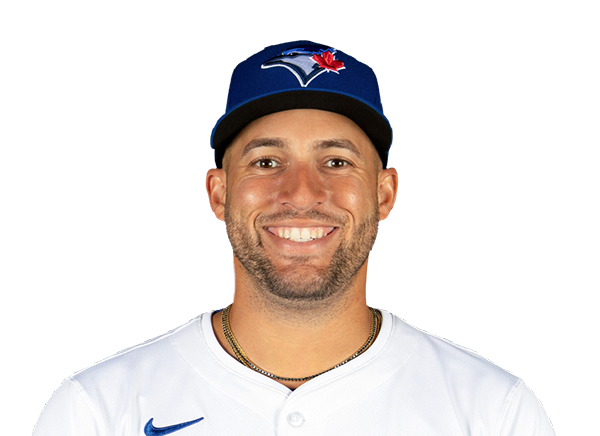 George Springer | 1-2 | 2 | 0 | 1 | 0 | 0 | 0 | 1 | 10 | .249 | .321 | .405 |
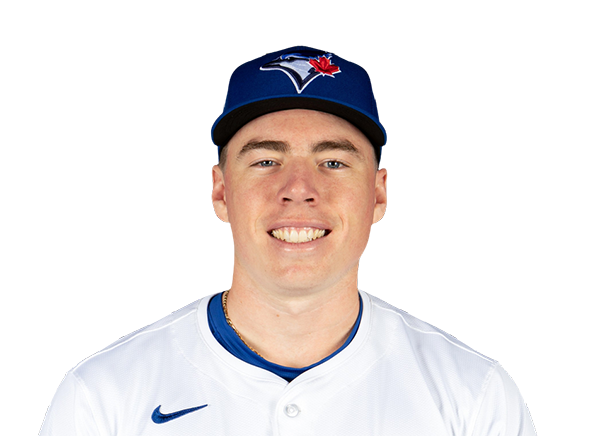 Sean Keys | 0-2 | 2 | 1 | 0 | 0 | 0 | 0 | 2 | 9 | .197 | .242 | .328 |
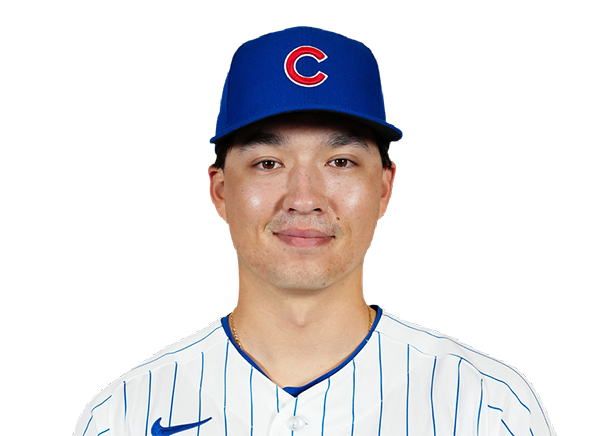 Brett Bateman | 2-4 | 4 | 1 | 2 | 0 | 0 | 0 | 1 | 14 | .329 | .402 | .424 |
 Kazuma Okamoto | 0-2 | 2 | 0 | 0 | 0 | 0 | 1 | 2 | 18 | .232 | .310 | .452 |
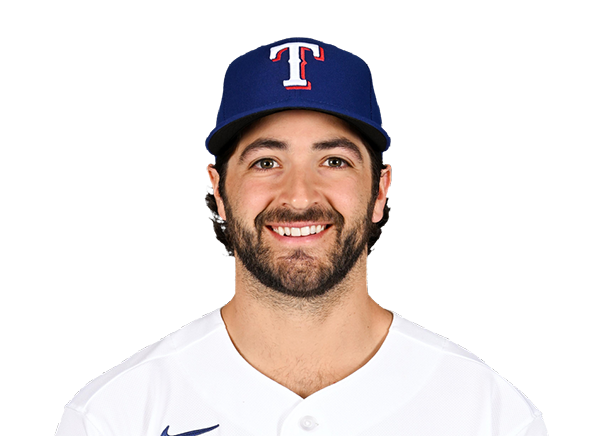 Josh Smith | 0-1 | 1 | 0 | 0 | 0 | 0 | 0 | 0 | 8 | .203 | .290 | .321 |
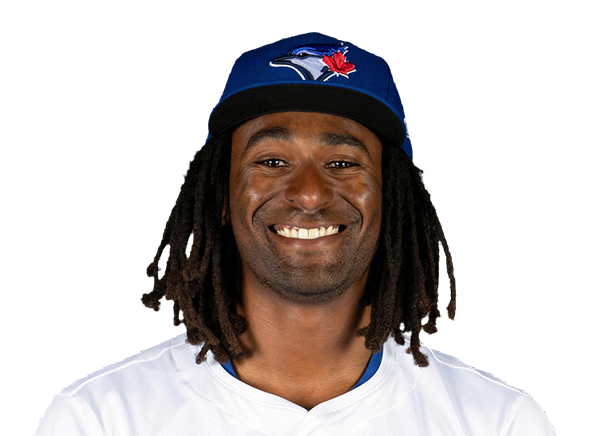 Charles McAdoo | 1-3 | 3 | 1 | 1 | 2 | 1 | 0 | 0 | 12 | .258 | .302 | .392 |
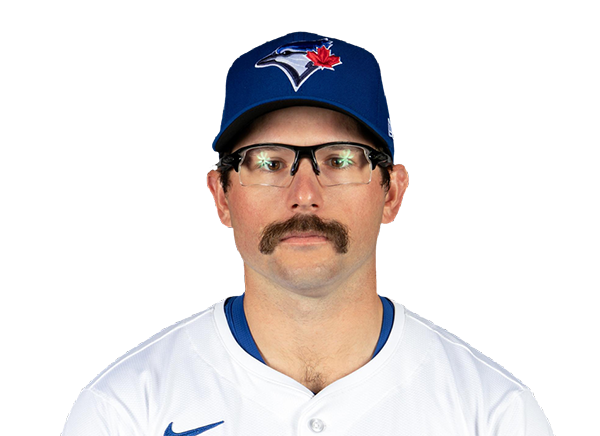 Davis Schneider | 0-3 | 3 | 1 | 0 | 1 | 0 | 1 | 1 | 22 | .145 | .310 | .315 |
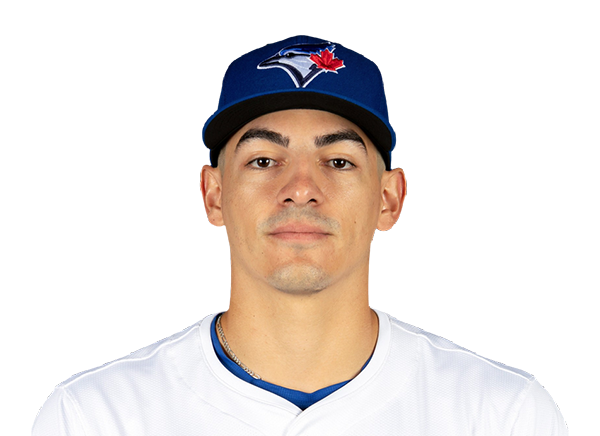 Brandon Valenzuela | 1-2 | 2 | 1 | 1 | 2 | 1 | 1 | 1 | 11 | .226 | .311 | .377 |
 Myles Straw | 0-3 | 3 | 0 | 0 | 0 | 0 | 0 | 1 | 16 | .241 | .304 | .342 |
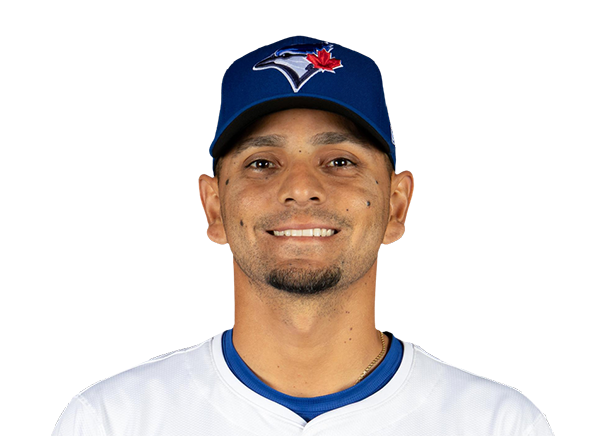 Andres Gimenez | 0-2 | 2 | 0 | 0 | 0 | 0 | 0 | 0 | 10 | .244 | .291 | .359 |
 Ernie Clement | 0-3 | 3 | 0 | 0 | 0 | 0 | 0 | 0 | 6 | .259 | .285 | .364 |
Cincinnati Reds
| Player | IP | H | R | ER | BB | K | HR | PC-ST | ERA | PC |
|---|---|---|---|---|---|---|---|---|---|---|
 Brandon Williamson | 3.0 | 4 | 4 | 4 | 3 | 3 | 1 | 76-41 | 5.30 | 76 |
 Zach McCambley | 2.0 | 0 | 0 | 0 | 0 | 3 | 0 | 24-14 | 4.05 | 24 |
 Luis Mey | 1.0 | 0 | 0 | 0 | 0 | 2 | 0 | 13-10 | 6.23 | 13 |
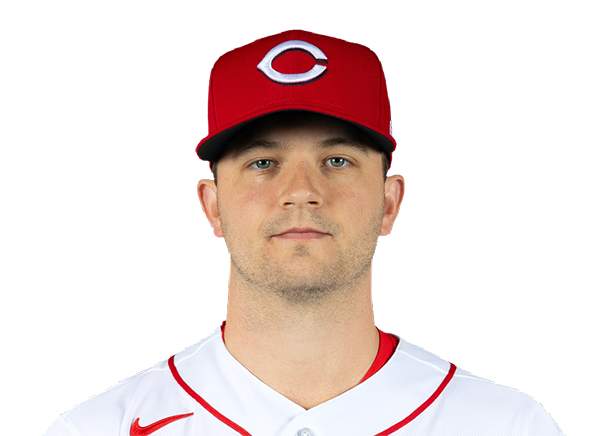 Carson Spiers | 2.0 | 1 | 1 | 1 | 0 | 1 | 1 | 23-16 | 7.50 | 23 |
Toronto Blue Jays
| Player | IP | H | R | ER | BB | K | HR | PC-ST | ERA | PC |
|---|---|---|---|---|---|---|---|---|---|---|
 Max Scherzer | 7.0 | 6 | 1 | 1 | 1 | 7 | 0 | 114-77 | 5.74 | 114 |
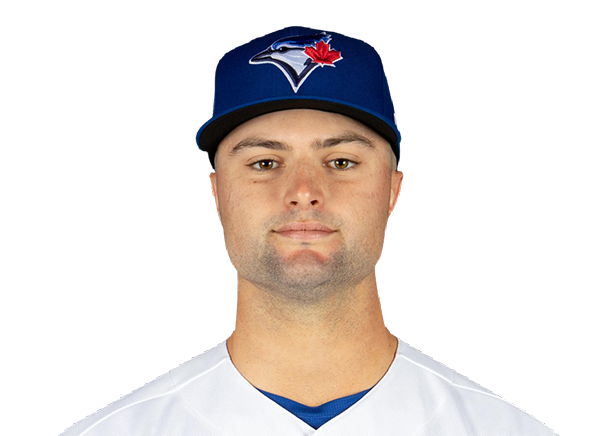 Mason Fluharty | 1.0 | 0 | 0 | 0 | 0 | 0 | 0 | 7-4 | 3.30 | 7 |
 Paul Sewald | 1.0 | 1 | 0 | 0 | 0 | 0 | 0 | 20-14 | 4.73 | 20 |
H2H / Season Series
TOR5–1
CIN
TOR1–5
CIN
TOR6–5
CIN
Last 5 Games
| Date | Opponent | Result |
|---|---|---|
| Sep 27 | @ TOR | L1–5 |
| Sep 26 | @ TOR | W5–1 |
| Sep 25 | @ TOR | L5–6 |
| Sep 24 |  @ ATL | W7–6 |
| Sep 23 | @ ATL | L2–3 |
| Date | Opponent | Result |
|---|---|---|
| Sep 26 | vs CIN | L1–5 |
| Sep 25 | vs CIN | W6–5 |
| Sep 23 |  @ BAL | L2–4 |
| Sep 23 | @ BAL | L2–4 |
| Sep 22 | @ BAL | T0–0 |
Standings
American League
| Team | W | L | PCT | GB | DIFF | STRK |
|---|---|---|---|---|---|---|
1 Rays | 98 | 64 | .605 | - | +86 | L1 |
2 Guardians | 85 | 77 | .525 | 13 | +11 | L1 |
3 Astros | 81 | 81 | .500 | 17 | -32 | W2 |
4 Yankees | 93 | 68 | .578 | 4.5 | +138 | W1 |
5 Red Sox | 87 | 75 | .537 | 11 | +78 | L1 |
6 White Sox | 84 | 78 | .519 | 14 | +56 | W1 |
7 Rangers | 80 | 82 | .494 | 18 | -46 | L1 |
| 8Orioles | 79 | 82 | .491 | 18.5 | -21 | L1 |
| 9Blue Jays | 79 | 83 | .488 | 19 | -46 | W1 |
10 Twins | 77 | 85 | .475 | 21 | -58 | W1 |
11 Tigers | 76 | 86 | .469 | 22 | +71 | L1 |
12 Mariners | 76 | 86 | .469 | 22 | -58 | W2 |
13 Royals | 69 | 93 | .426 | 29 | -120 | W1 |
14 Athletics | 64 | 98 | .395 | 34 | -238 | L2 |
15 Angels | 62 | 100 | .383 | 36 | -97 | L2 |
National League
| Team | W | L | PCT | GB | DIFF | STRK |
|---|---|---|---|---|---|---|
1 Brewers | 103 | 59 | .636 | - | +214 | W5 |
2 Dodgers | 100 | 62 | .617 | 3 | +201 | W3 |
| 3Braves | 94 | 68 | .580 | 9 | +116 | L1 |
4 Padres | 91 | 71 | .562 | 12 | +41 | W2 |
5 Cubs | 89 | 73 | .549 | 14 | +147 | W1 |
6 Phillies | 88 | 74 | .543 | 15 | +15 | W1 |
7 Diamondbacks | 86 | 76 | .531 | 17 | +9 | L2 |
8 Pirates | 82 | 80 | .506 | 21 | +28 | W1 |
9 Marlins | 80 | 82 | .494 | 23 | +3 | W1 |
10 Cardinals | 77 | 85 | .475 | 26 | -29 | L4 |
11 Nationals | 77 | 85 | .475 | 26 | +6 | W1 |
| 12Reds | 75 | 87 | .463 | 28 | -160 | L1 |
13 Mets | 74 | 88 | .457 | 29 | -32 | L1 |
14 Giants | 65 | 97 | .401 | 38 | -91 | L5 |
15 Rockies | 58 | 104 | .358 | 45 | -192 | L1 |
CIN
VS
TOR
Pitchers
Brandon Williamson
Catchers
Will Banfield
Infielders
Sal Stewart
Juan Brito
Matt McLain
Oswaldo Cabrera
Outfielders
Carlos Jorge
JJ Bleday
Hector Rodriguez
Designated Hitters
Elly De La Cruz
Pitchers
Max Scherzer
Catchers
Brandon Valenzuela
Infielders
Kazuma Okamoto
Charles McAdoo
Andres Gimenez
Ernie Clement
Outfielders
Brett Bateman
Davis Schneider
Myles Straw
Designated Hitters
George Springer
Reds
VS
Blue Jays
Batting
162
Team Games Played
162
5383
At Bats
5447
1231
Hits
1347
635
Runs Batted In
616
213
Home Runs
152
112
Stolen Bases
75
.229
Batting Average
.247
666
Runs
648
219
Doubles
259
16
Triples
8
2121
Total Bases
2078
557
Walks
459
1544
Strikeouts
1149
.305
On Base Percentage
.310
.394
Slugging Percentage
.381
.699
OBP Pct + SLG Pct
.692
162
Games Played
162
162
Games Started
162
51
Hit By Pitch
60
0.0
Wins Above Replacement
0.0
0.0
Offensive Wins Above Replacement
0.0
39
Caught Stealing
17
1
Is Qualified
1
662.1
Runs Created
645.2
4.1
Runs Created Per 27 Outs
4.0
.092
Walks Per Plate Appearance
.076
0.36
Walk To Strikeout Ratio
0.40
.165
Isolated Power
.134
.282
Secondary Average
.229
3.95
Pitches Per Plate Appearance
3.81
448
Extra Base Hits
419
6048
Plate Appearances
6043
25.3
At Bats Per Home Run
35.8
15
Sacrifice Hit
24
39
Sacrifice Flies
50
Pitching
162
Team Games Played
162
49
Quality Starts
46
75
Wins
79
87
Losses
83
42
Saves
52
89
Holds
106
1401
Hits
1264
770
Earned runs
621
214
Home Runs
167
668
Walks
594
1293
Strikeouts
1410
8.1
Strikeouts Per 9 Innings
8.8
152.7
Pitches Per Start
148.3
1.44
Walks Plus Hits Per Inning Pitched
1.29
4.83
Earned Run Average
3.89
87
Losses
83
1433.1
Innings pitched
1436.0
.463
Win Percentage
.488
65
Save Opportunities
69
.254
Opponent Batting Average
.235
.341
Opponent's On-base pct.
.314
.428
Opponent's Slugging pct.
.371
.770
Opponent's OPB Pct + SLG Pct
.685
5507
At Bats
5383
255
Doubles
211
30
Triples
11
87
Batters Hit
44
144
Stolen Bases
145
162
Games Played
162
0
Complete Games
1
9
Shutouts
11
49
Wild Pitches
49
796
Runs Batted In
652
3
Balks
8
1433.1
Innings pitched
1436.0
8.1
Strikeouts Per 9 Innings
8.8
35
Caught Stealing
46
162
Games Started
162
0.0
Wins Above Replacement
0.0
1
Is Qualified
1
826
Runs
694
770
Earned Runs
621
2358
Total Bases
1998
Fielding
162
Team Games Played
162
1433
Full Innings
1436
5688
Total Chances
5765
4300
Putouts
4308
1299
Assists
1358
89
Errors
99
219
Double Plays
259
0.984
Fielding Percentage
0.983
35.2
Range Factor
35.5
0.0
Zone Rating
0.0
162
Games Played
162
0
Games Started
0
0.0
Defensive Wins Above Replacement
0.0
1
Qualified
1