

Reds vs Brewers Live Score (2 Jul, 2026)
Game Information
Stage
Standard
Season
2026
First Pitch
Thu, Jul 2, 2:10 pm
Venue
American Family Field
Location
Milwaukee, Wisconsin
Attendance
41,390
Live Situation
0Balls
0Strikes
0Outs
—Pitcher
—At Bat
Pitch Sequence
1
BALL IN PLAY
Sinker
93 MPH
Injury Report


Team Stats
 CIN
MIL


7
Runs
2
11
Hits
4
1
Errors
1
3
Home Runs
1
3
Walks
2
13
Strikeouts
7
Player Box Score
Cincinnati Reds
| Player | H-AB | AB | R | H | RBI | HR | BB | K | #P | AVG | OBP | SLG |
|---|---|---|---|---|---|---|---|---|---|---|---|---|
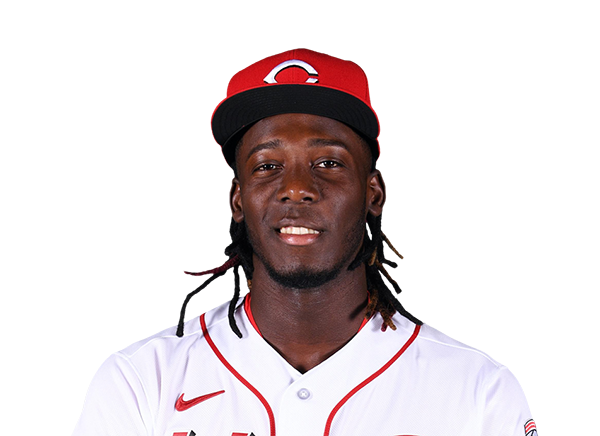 Elly De La Cruz | 1-5 | 5 | 0 | 1 | 0 | 0 | 0 | 1 | 13 | .272 | .339 | .485 |
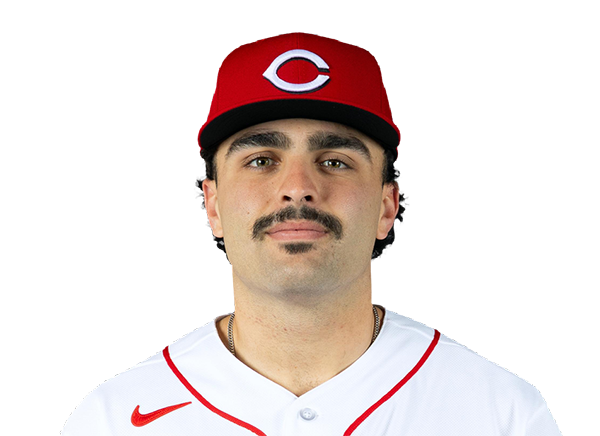 Sal Stewart | 1-4 | 4 | 1 | 1 | 1 | 1 | 1 | 2 | 25 | .257 | .342 | .471 |
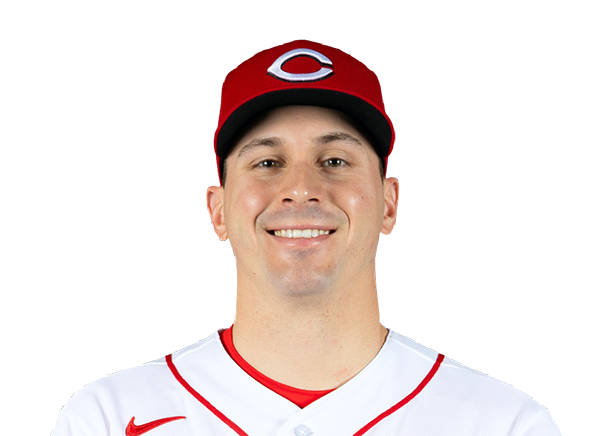 JJ Bleday | 1-4 | 4 | 1 | 1 | 0 | 0 | 1 | 2 | 22 | .237 | .347 | .488 |
 Eugenio Suarez | 1-4 | 4 | 1 | 1 | 0 | 0 | 1 | 2 | 23 | .207 | .278 | .370 |
 Nathaniel Lowe | 1-4 | 4 | 0 | 1 | 0 | 0 | 0 | 2 | 14 | .253 | .341 | .468 |
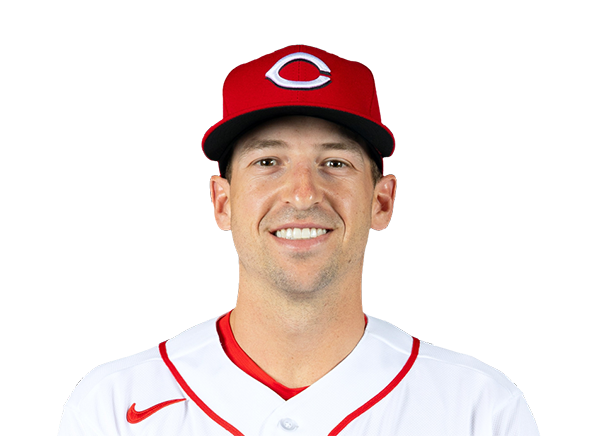 Spencer Steer | 0-1 | 1 | 0 | 0 | 0 | 0 | 0 | 0 | 2 | .235 | .313 | .414 |
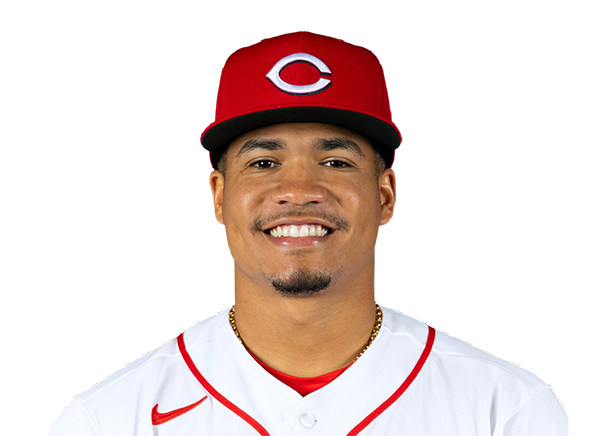 Noelvi Marte | 1-5 | 5 | 1 | 1 | 1 | 0 | 0 | 1 | 20 | .200 | .257 | .381 |
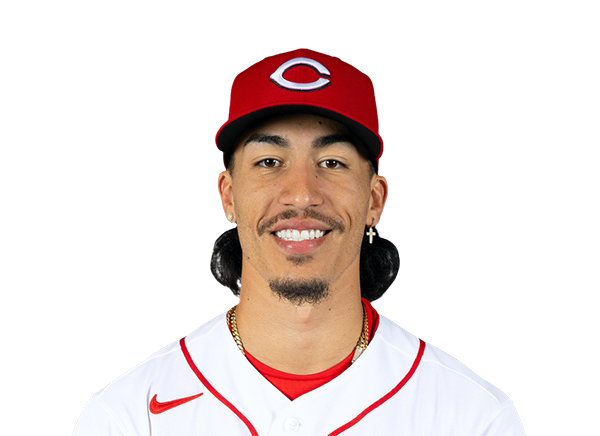 Edwin Arroyo | 0-3 | 3 | 0 | 0 | 0 | 0 | 0 | 2 | 16 | .257 | .309 | .297 |
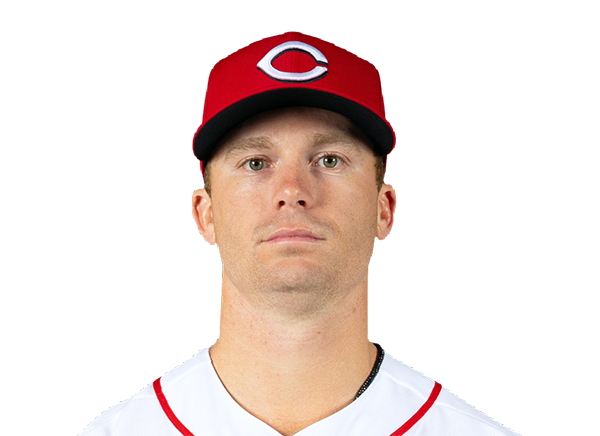 Matt McLain | 0-1 | 1 | 1 | 0 | 0 | 0 | 0 | 0 | 2 | .195 | .298 | .337 |
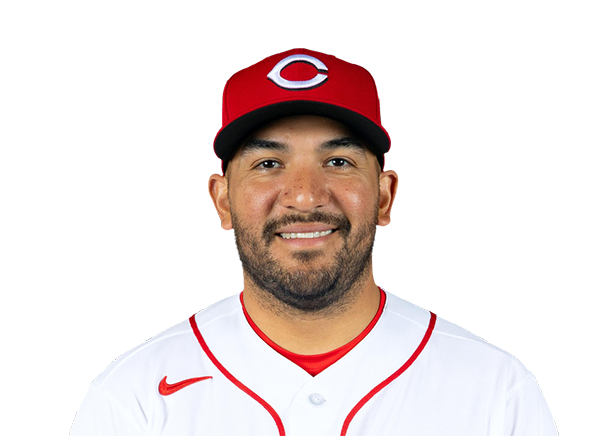 Jose Trevino | 3-4 | 4 | 1 | 3 | 3 | 1 | 0 | 0 | 15 | .232 | .246 | .321 |
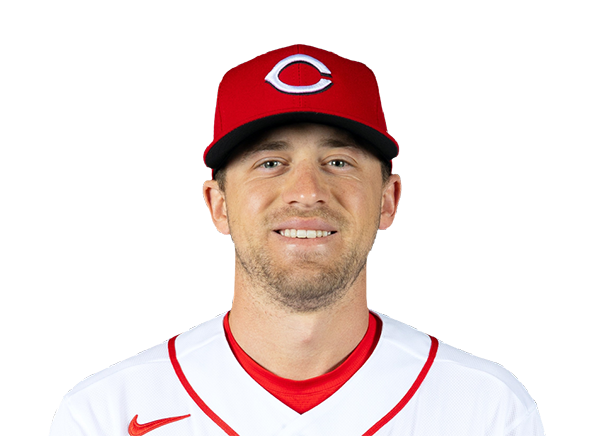 TJ Friedl | 2-3 | 3 | 1 | 2 | 2 | 1 | 0 | 1 | 11 | .181 | .259 | .271 |
Milwaukee Brewers
| Player | H-AB | AB | R | H | RBI | HR | BB | K | #P | AVG | OBP | SLG |
|---|---|---|---|---|---|---|---|---|---|---|---|---|
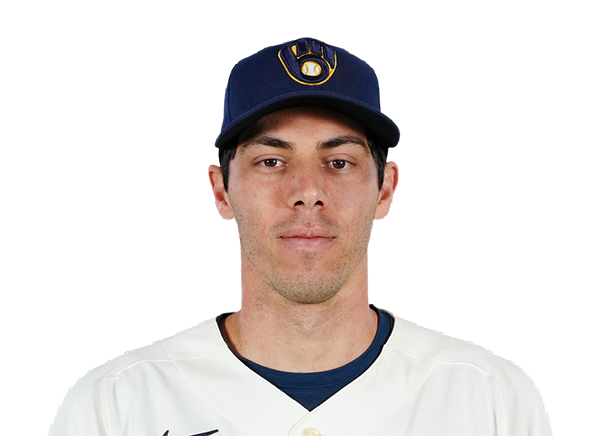 Christian Yelich | 0-3 | 3 | 0 | 0 | 0 | 0 | 1 | 1 | 18 | .252 | .333 | .386 |
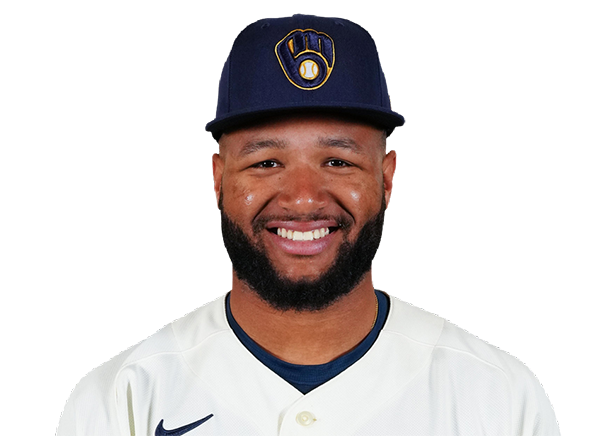 Jackson Chourio | 1-4 | 4 | 1 | 1 | 0 | 0 | 0 | 1 | 15 | .295 | .353 | .525 |
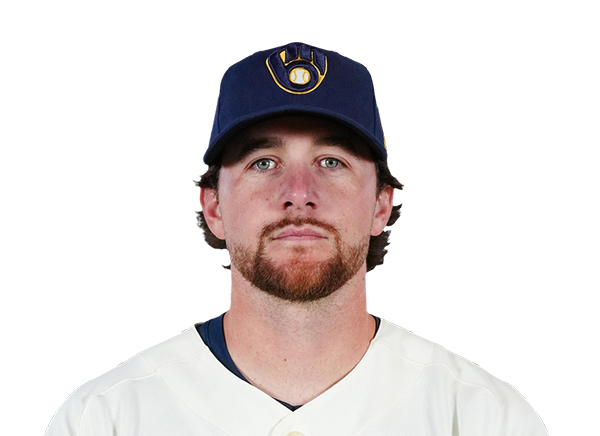 Brice Turang | 1-4 | 4 | 0 | 1 | 1 | 0 | 0 | 2 | 17 | .259 | .359 | .450 |
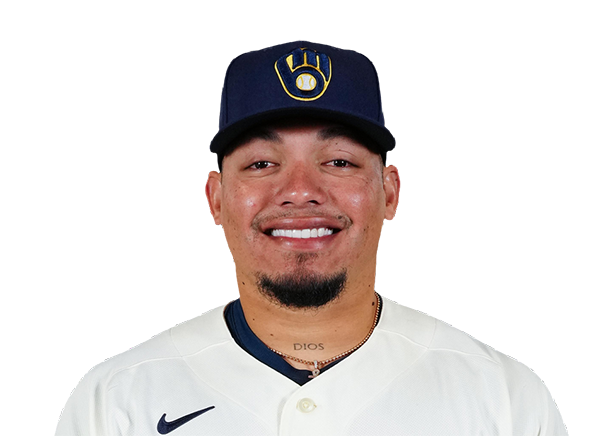 William Contreras | 0-4 | 4 | 0 | 0 | 0 | 0 | 0 | 1 | 7 | .293 | .358 | .418 |
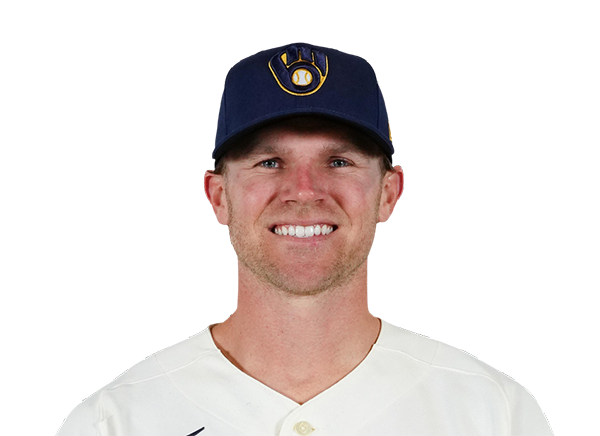 Jake Bauers | 0-4 | 4 | 0 | 0 | 0 | 0 | 0 | 1 | 23 | .264 | .365 | .492 |
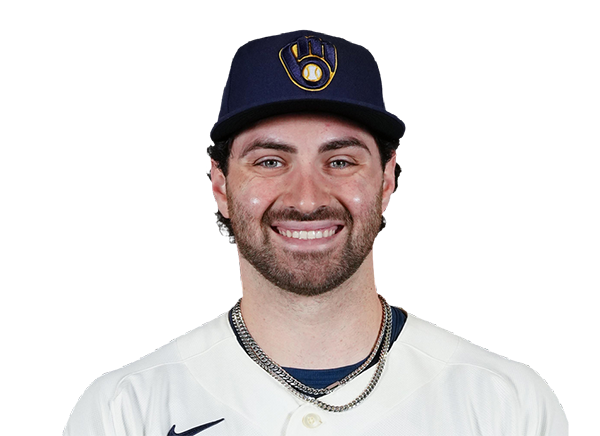 Garrett Mitchell | 1-3 | 3 | 1 | 1 | 1 | 1 | 1 | 0 | 12 | .265 | .361 | .452 |
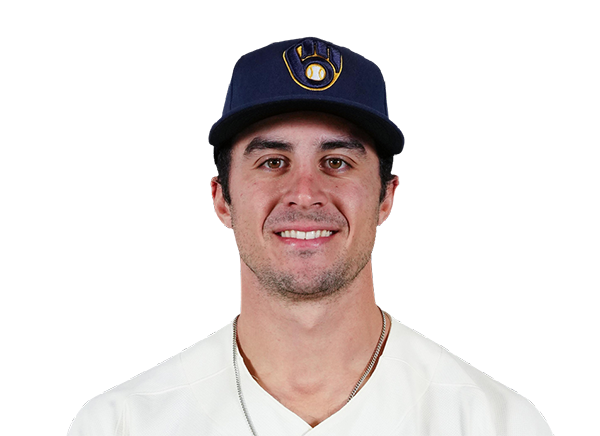 Sal Frelick | 0-2 | 2 | 0 | 0 | 0 | 0 | 0 | 0 | 8 | .250 | .321 | .340 |
 Cooper Pratt | 0-3 | 3 | 0 | 0 | 0 | 0 | 0 | 0 | 16 | .182 | .275 | .205 |
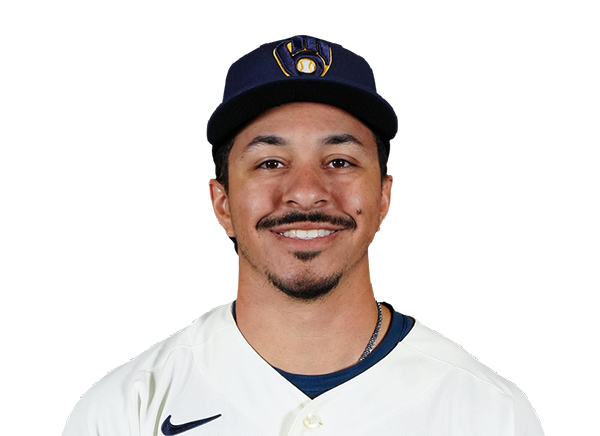 David Hamilton | 1-2 | 2 | 0 | 1 | 0 | 0 | 0 | 1 | 9 | .235 | .312 | .327 |
 Joey Ortiz | 0-1 | 1 | 0 | 0 | 0 | 0 | 0 | 0 | 4 | .202 | .279 | .264 |
Cincinnati Reds
| Player | IP | H | R | ER | BB | K | HR | PC-ST | ERA | PC |
|---|---|---|---|---|---|---|---|---|---|---|
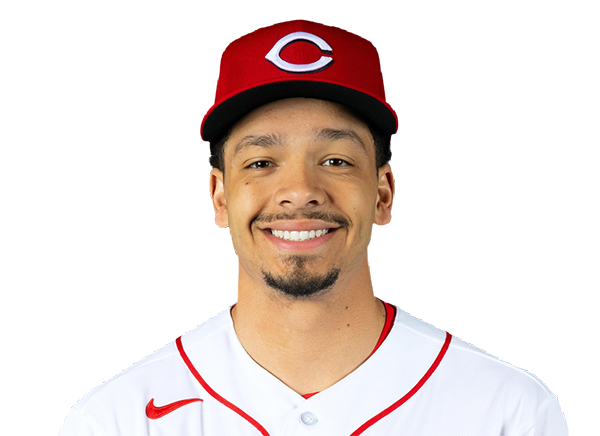 Chase Burns | 6.0 | 4 | 2 | 2 | 2 | 4 | 1 | 89-55 | 2.40 | 89 |
 Sam Moll | 1.1 | 0 | 0 | 0 | 0 | 1 | 0 | 24-15 | 4.00 | 24 |
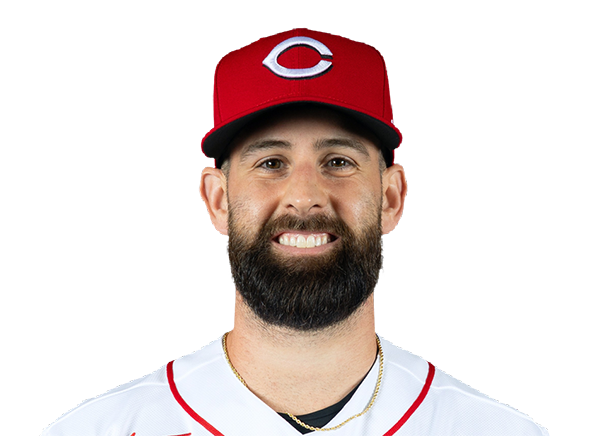 Tejay Antone | 0.2 | 0 | 0 | 0 | 0 | 1 | 0 | 5-4 | 2.52 | 5 |
 Brock Burke | 1.0 | 0 | 0 | 0 | 0 | 1 | 0 | 11-9 | 3.05 | 11 |
Milwaukee Brewers
| Player | IP | H | R | ER | BB | K | HR | PC-ST | ERA | PC |
|---|---|---|---|---|---|---|---|---|---|---|
 Jacob Misiorowski | 5.0 | 5 | 5 | 1 | 0 | 10 | 2 | 82-57 | 1.47 | 82 |
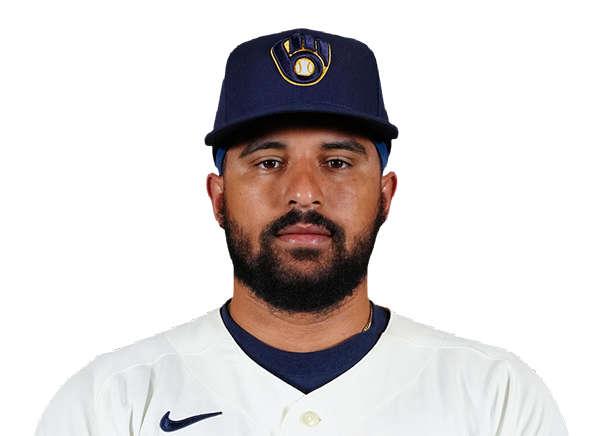 Grant Anderson | 1.2 | 1 | 1 | 1 | 0 | 2 | 1 | 20-13 | 3.53 | 20 |
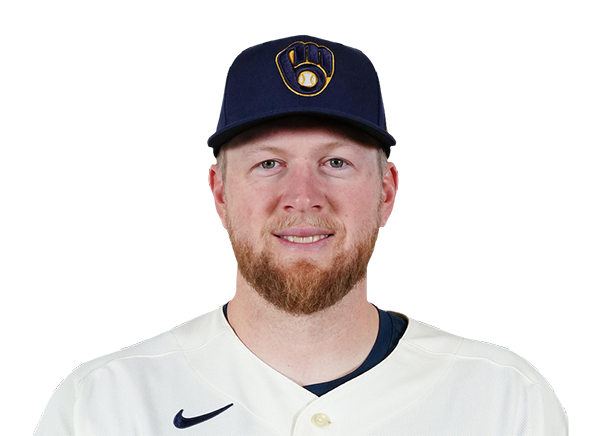 Jared Koenig | 0.1 | 1 | 0 | 0 | 2 | 0 | 0 | 21-10 | 0.00 | 21 |
 Joel Kuhnel | 1.0 | 3 | 1 | 1 | 0 | 0 | 0 | 21-12 | 4.84 | 21 |
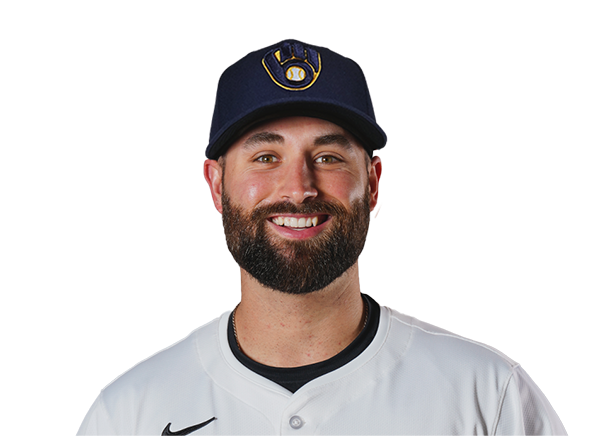 Garrett Stallings | 1.0 | 1 | 0 | 0 | 1 | 1 | 0 | 19-10 | 0.00 | 19 |
H2H / Season Series
MIL2–7
CIN
MIL4–2
CIN
MIL7–2
CIN
MIL5–3
CIN
CIN5–6
MIL
CIN0–2
MIL
CIN1–2
MIL
MIL4–1
CIN
MIL9–1
CIN
CIN6–3
MIL
Last 5 Games
| Date | Opponent | Result |
|---|---|---|
| Aug 23 |  @ ARI | L3–5 |
| Aug 22 | @ ARI | W11–5 |
| Aug 21 | @ ARI | L0–9 |
| Aug 20 |  vs STL | L9–10 |
| Aug 19 | vs STL | W5–4 |
| Date | Opponent | Result |
|---|---|---|
| Aug 23 |  vs ATL | L2–4 |
| Aug 22 | vs ATL | W4–1 |
| Aug 21 | vs ATL | W2–1 |
| Aug 20 |  vs SEA | W7–4 |
| Aug 19 | vs SEA | L5–7 |
Standings
American League
| Team | W | L | PCT | GB | DIFF | STRK |
|---|---|---|---|---|---|---|
1 Rays | 77 | 53 | .592 | - | +44 | W1 |
2 White Sox | 68 | 62 | .523 | 9 | +43 | W1 |
3 Astros | 65 | 66 | .496 | 12.5 | -44 | L2 |
4 Yankees | 74 | 56 | .569 | 3 | +100 | W1 |
5 Red Sox | 71 | 59 | .546 | 6 | +99 | W3 |
6 Rangers | 65 | 66 | .496 | 12.5 | -46 | W1 |
7 Guardians | 65 | 66 | .496 | 12.5 | -9 | W4 |
8 Blue Jays | 64 | 68 | .485 | 14 | -55 | L1 |
9 Twins | 63 | 68 | .481 | 14.5 | -54 | L3 |
10 Orioles | 63 | 68 | .481 | 14.5 | -35 | L1 |
| 11Mariners | 62 | 69 | .473 | 15.5 | -61 | L1 |
12 Tigers | 61 | 69 | .469 | 16 | +73 | L5 |
13 Royals | 58 | 74 | .439 | 20 | -91 | W8 |
14 Angels | 52 | 79 | .397 | 25.5 | -70 | L1 |
15 Athletics | 51 | 80 | .389 | 26.5 | -187 | W2 |
National League
| Team | W | L | PCT | GB | DIFF | STRK |
|---|---|---|---|---|---|---|
| 1Brewers | 81 | 50 | .618 | - | +161 | L1 |
2 Dodgers | 80 | 51 | .611 | 1 | +151 | W6 |
| 3Braves | 76 | 55 | .580 | 5 | +110 | W1 |
4 Cubs | 75 | 56 | .573 | 6 | +115 | W1 |
5 Phillies | 73 | 58 | .557 | 8 | +27 | W9 |
6 Padres | 71 | 60 | .542 | 10 | +16 | W3 |
| 7Diamondbacks | 69 | 62 | .527 | 12 | +9 | W1 |
8 Marlins | 67 | 64 | .511 | 14 | +21 | W3 |
| 9Cardinals | 66 | 66 | .500 | 15.5 | -2 | L3 |
10 Pirates | 63 | 69 | .477 | 18.5 | +25 | L3 |
| 11Reds | 62 | 69 | .473 | 19 | -94 | L1 |
12 Nationals | 61 | 71 | .462 | 20.5 | +10 | L4 |
13 Mets | 59 | 72 | .450 | 22 | -40 | L1 |
14 Giants | 52 | 78 | .400 | 28.5 | -80 | L4 |
15 Rockies | 50 | 80 | .385 | 30.5 | -136 | L6 |
CIN
VS
MIL
Pitchers
Chase Burns
Sam Moll
Tejay Antone
Brock Burke
Catchers
Jose Trevino
Infielders
Elly De La Cruz
Sal Stewart
Nathaniel Lowe
Spencer Steer
Edwin Arroyo
Matt McLain
Outfielders
JJ Bleday
Noelvi Marte
TJ Friedl
Designated Hitters
Eugenio Suarez
Pitchers
Jacob Misiorowski
Grant Anderson
Jared Koenig
Joel Kuhnel
Garrett Stallings
Catchers
William Contreras
Infielders
Brice Turang
Jake Bauers
Cooper Pratt
David Hamilton
Joey Ortiz
Outfielders
Jackson Chourio
Garrett Mitchell
Sal Frelick
Designated Hitters
Christian Yelich
Reds
VS
Brewers
Batting
131
Team Games Played
131
4349
At Bats
4428
986
Hits
1123
513
Runs Batted In
611
169
Home Runs
120
89
Stolen Bases
129
.227
Batting Average
.254
537
Runs
650
188
Doubles
229
12
Triples
21
1705
Total Bases
1754
471
Walks
543
1247
Strikeouts
1095
.307
On Base Percentage
.337
.392
Slugging Percentage
.396
.699
OBP Pct + SLG Pct
.733
131
Games Played
131
131
Games Started
131
43
Hit By Pitch
33
0.0
Wins Above Replacement
0.0
0.0
Offensive Wins Above Replacement
0.0
30
Caught Stealing
41
1
Is Qualified
1
536.6
Runs Created
617.2
4.1
Runs Created Per 27 Outs
4.8
.096
Walks Per Plate Appearance
.107
0.38
Walk To Strikeout Ratio
0.50
.165
Isolated Power
.143
.287
Secondary Average
.285
3.94
Pitches Per Plate Appearance
4.00
369
Extra Base Hits
370
4910
Plate Appearances
5076
25.7
At Bats Per Home Run
36.9
14
Sacrifice Hit
30
30
Sacrifice Flies
35
Pitching
131
Team Games Played
131
44
Quality Starts
46
62
Wins
81
69
Losses
50
33
Saves
43
73
Holds
68
1101
Hits
951
584
Earned runs
445
162
Home Runs
130
543
Walks
415
1054
Strikeouts
1269
8.1
Strikeouts Per 9 Innings
9.8
153.2
Pitches Per Start
145.4
1.41
Walks Plus Hits Per Inning Pitched
1.17
4.52
Earned Run Average
3.42
69
Losses
50
1164.0
Innings pitched
1171.1
.473
Win Percentage
.618
54
Save Opportunities
61
.248
Opponent Batting Average
.220
.336
Opponent's On-base pct.
.295
.412
Opponent's Slugging pct.
.357
.747
Opponent's OPB Pct + SLG Pct
.651
4441
At Bats
4325
195
Doubles
175
23
Triples
13
65
Batters Hit
52
124
Stolen Bases
57
131
Games Played
131
0
Complete Games
1
8
Shutouts
9
38
Wild Pitches
44
610
Runs Batted In
469
2
Balks
6
1164.0
Innings pitched
1171.1
8.1
Strikeouts Per 9 Innings
9.8
26
Caught Stealing
29
131
Games Started
131
0.0
Wins Above Replacement
0.0
1
Is Qualified
1
631
Runs
489
584
Earned Runs
445
1828
Total Bases
1542
Fielding
131
Team Games Played
131
1164
Full Innings
1171
4620
Total Chances
4592
3492
Putouts
3514
1056
Assists
1020
72
Errors
58
188
Double Plays
229
0.984
Fielding Percentage
0.987
35.2
Range Factor
34.8
0.0
Zone Rating
0.0
131
Games Played
131
0
Games Started
0
0.0
Defensive Wins Above Replacement
0.0
1
Qualified
1